 Rust
Rust
How we measured explains the setup. This page is about Rust.
The app
- Rust 1.98, axum 0.8 on tokio, redis-rs 1.7 with one multiplexed
ConnectionManagerconnection opentelemetry,opentelemetry_sdkandopentelemetry-otlp0.33. Rust has no auto-instrumentation, so the spans are made by hand with the OpenTelemetry API: an axum middleware makes theSERVERspan (and reads the W3C context from the headers), and the handler makes theCLIENTspan around theINCRcall. With tracing off, the middleware isn't added and the handler takes a branch with no span code at all.
async fn incr(State(st): State<AppState>) -> Response {
    let mut conn = st.redis.clone();
    let res: RedisResult<i64> = if st.traced {
        otel::traced_incr(&mut conn, st.redis_host, st.redis_port).await
    } else {
        redis::cmd("INCR").arg("counter").query_async(&mut conn).await
    };
    match res {
        Ok(v) => v.to_string().into_response(),
        Err(e) => (StatusCode::INTERNAL_SERVER_ERROR, e.to_string()).into_response(),
    }
}
pub fn init() -> Result<SdkTracerProvider, Box<dyn Error>> {
    let exporter = SpanExporter::builder().with_http().with_protocol(Protocol::HttpBinary).build()?;
    // the batch span processor runs on its own thread with a blocking HTTP client
    let provider = SdkTracerProvider::builder().with_batch_exporter(exporter).build();
    global::set_tracer_provider(provider.clone());
    global::set_text_map_propagator(TraceContextPropagator::new());
    Ok(provider)
}
Results
Each shaded area on the charts is a 4-minute measurement in one mode (the second of the two passes; the tables average both).
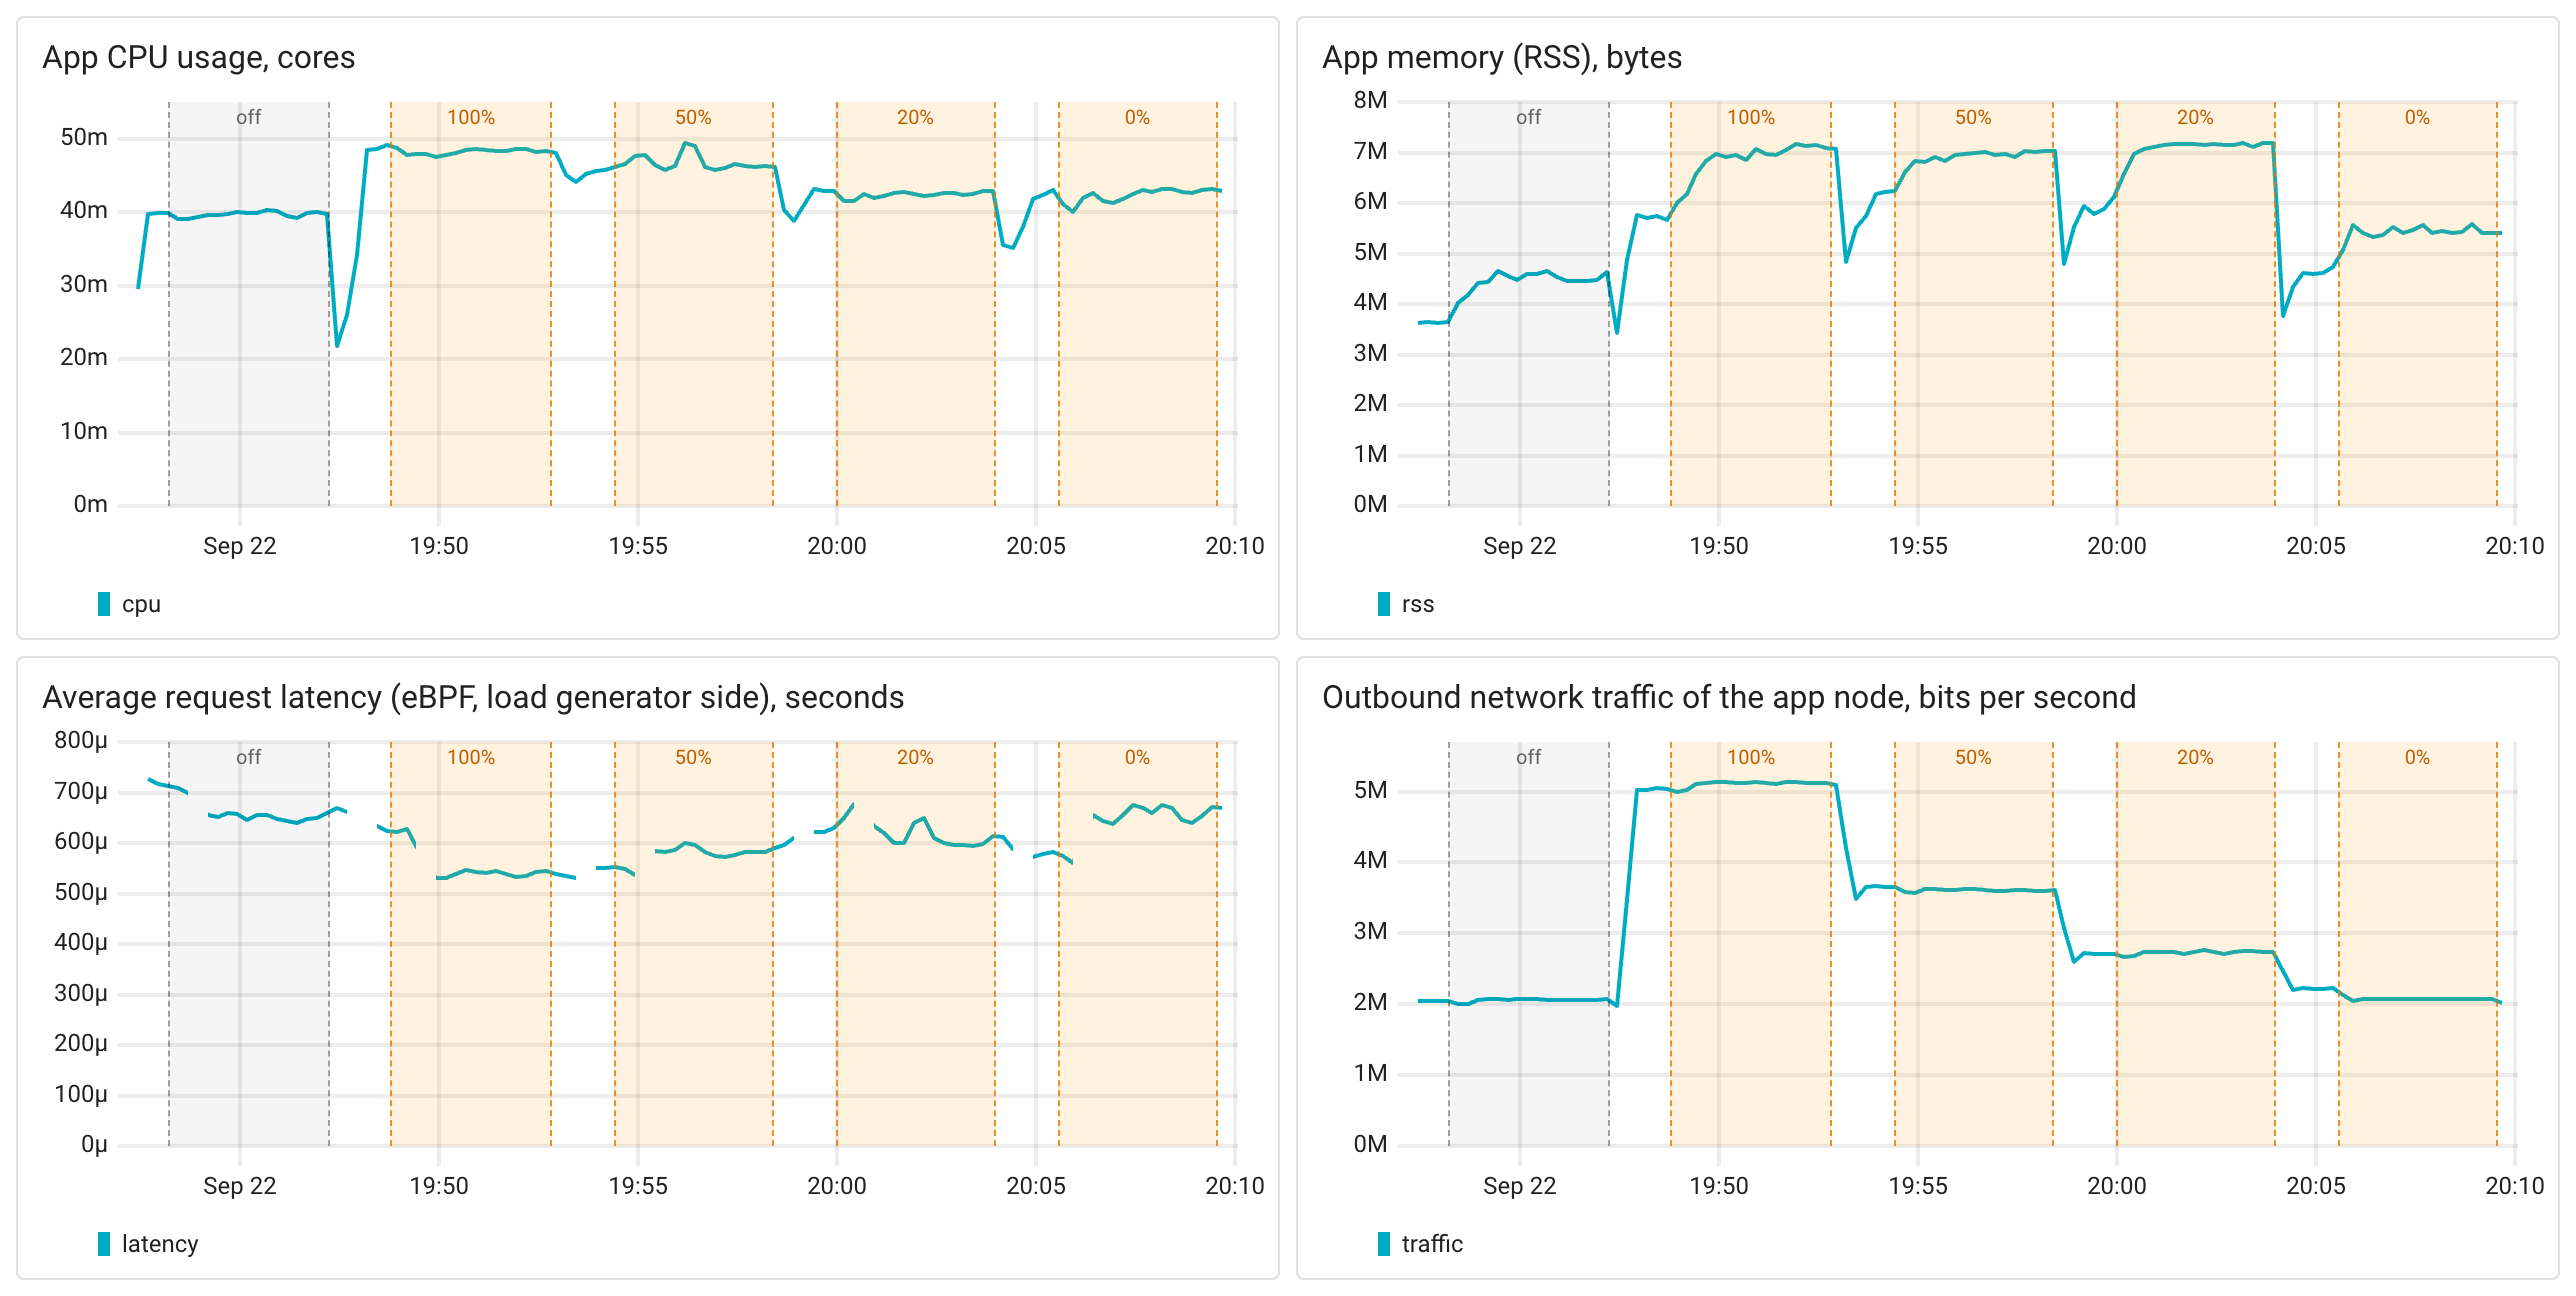
| Mode | off | 100% | 50% | 20% | 0% |
|---|---|---|---|---|---|
| Spans received by Coroot, per second | 0 | 1,994 | 998 | 396 | 0 |
| CPU usage, cores | 0.040 | 0.049 (+21%) | 0.046 (+15%) | 0.043 (+7%) | 0.043 (+6%) |
| Memory (RSS), MB | 4.5 | 6.9 | 6.9 | 6.7 | 5.2 |
| Trace export traffic, Mbit/s | - | 2.9 | 1.5 | 0.7 | 0 |
| Latency, p50, ms | 0.58 | 0.58 | 0.56 | 0.55 | 0.61 |
| Latency, p99, ms | 1.6 | 1.5 | 1.5 | 1.3 | 1.6 |
- CPU: tracing every request costs 0.009 CPU cores per 1,000 requests per second, +21% for this app. That's the cheapest result in the whole benchmark by a wide margin: the SDK does little work per span, and the export runs on its own thread. At 0% sampling the overhead is +6%.
- Memory: 1-2.5MB on top of a 4.5MB process.
- Network: about 180 bytes per span, the smallest spans in the benchmark. Hand-made spans carry only the attributes you set.
- Latency: no visible change.
- Nothing was dropped.
Where the CPU goes
Release builds of Rust drop frame pointers, which leaves the eBPF profiler unable to walk the stacks. For this flame graph the app was rebuilt with
RUSTFLAGS="-C force-frame-pointers=yes" and run once more through the off → 100% modes, so the numbers in the table above are not affected by it.
Red frames take a bigger share of CPU time with tracing on, green frames a smaller one.
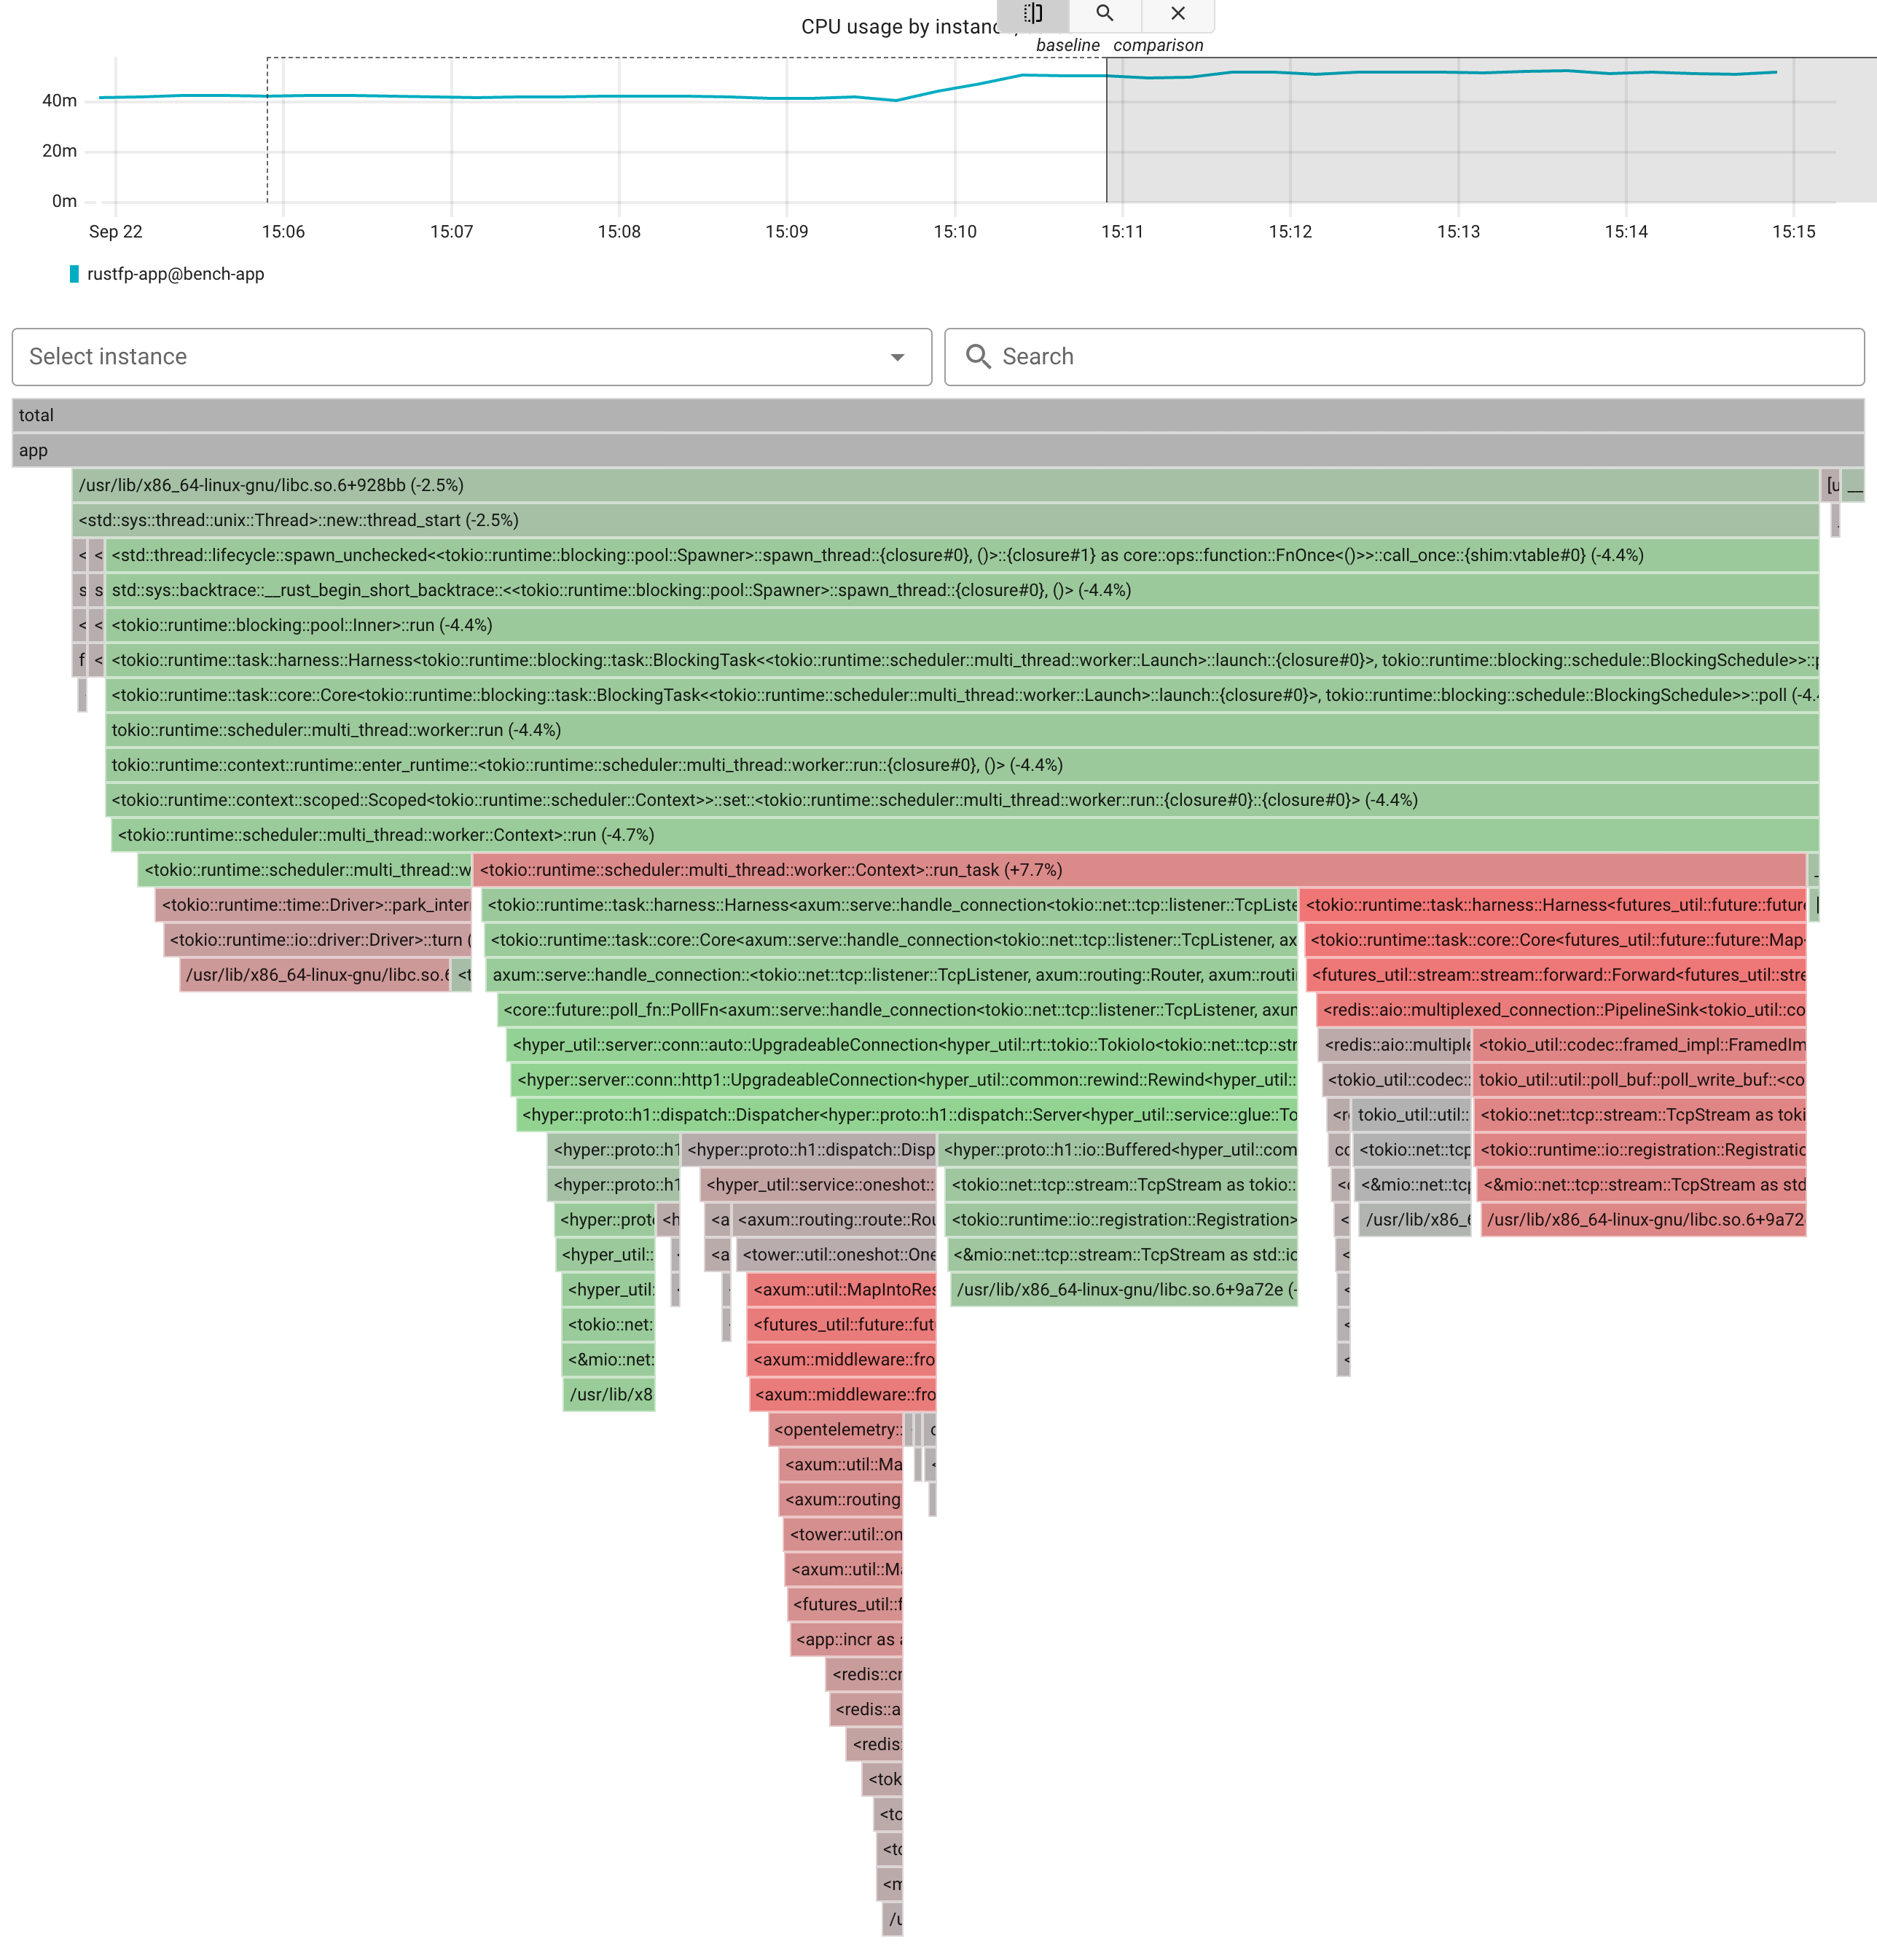
The request path now goes through the axum::middleware::from_fn layer that creates the server span, and the handler creates the client span around the INCR call.
On the right, the redis connection's pipeline sink gets a bigger share too: with tracing on, the same thread also writes the exported spans to the network.
Everything else, the tokio scheduler and hyper's HTTP parsing, keeps the same share.
Takeaways
- Tracing a Rust service costs about 0.01 CPU cores per 1,000 requests per second and a couple of megabytes of memory. Latency doesn't change.
- Sampling lowers the cost but doesn't remove it. At 0% the instrumentation still adds 6% CPU: spans are created, the context is propagated and the sampling decision is made on every request.