 C++
How we measured explains the setup. This page is about C++.
The app
- C++20 (GCC 14), Drogon 1.9 with 4 IO threads, redis-plus-plus 1.3 on hiredis with a connection pool
- opentelemetry-cpp 1.29: the trace SDK, the OTLP/HTTP protobuf exporter, the batch span processor and the W3C propagators. There is no instrumentation for Drogon or redis-plus-plus, so the two spans are created by hand with the SDK API, like in Rust. With tracing off, a plain handler with no span code is registered instead.
app.registerHandler("/", [redis, target](const HttpRequestPtr &req, std::function<void(const HttpResponsePtr &)> &&cb) {
    otel::traced_request(req, std::move(cb), target, [&redis] { return redis->incr("counter"); });
}, {Get});
// SERVER span, with the parent taken from the incoming W3C headers
auto parent = propagator->Extract(RequestCarrier(*req), Context{});
StartSpanOptions so; so.kind = SpanKind::kServer; so.parent = parent;
auto server = tracer->StartSpan(method + " " + path, {{"http.request.method", method}, {"url.path", path}}, so);

// CLIENT span around the INCR
StartSpanOptions co; co.kind = SpanKind::kClient; co.parent = server->GetContext();
auto client = tracer->StartSpan("INCR", {{"db.system", "redis"}, {"db.query.text", "INCR counter"}, {"server.address", host}}, co);
long long v = incr();
client->End();
server->SetAttribute("http.response.status_code", 200);
server->End();
One thing the C++ SDK doesn't do: it ignores OTEL_TRACES_SAMPLER and OTEL_TRACES_SAMPLER_ARG. The app reads them itself and builds a ParentBasedSampler(TraceIdRatioBasedSampler(ratio)).
The exporter's endpoint, headers and the service name do come from the standard environment variables.
The binary is built with -O2 -g -fno-omit-frame-pointer and left unstripped, so that Coroot's profiler can walk and name its stacks.
Results
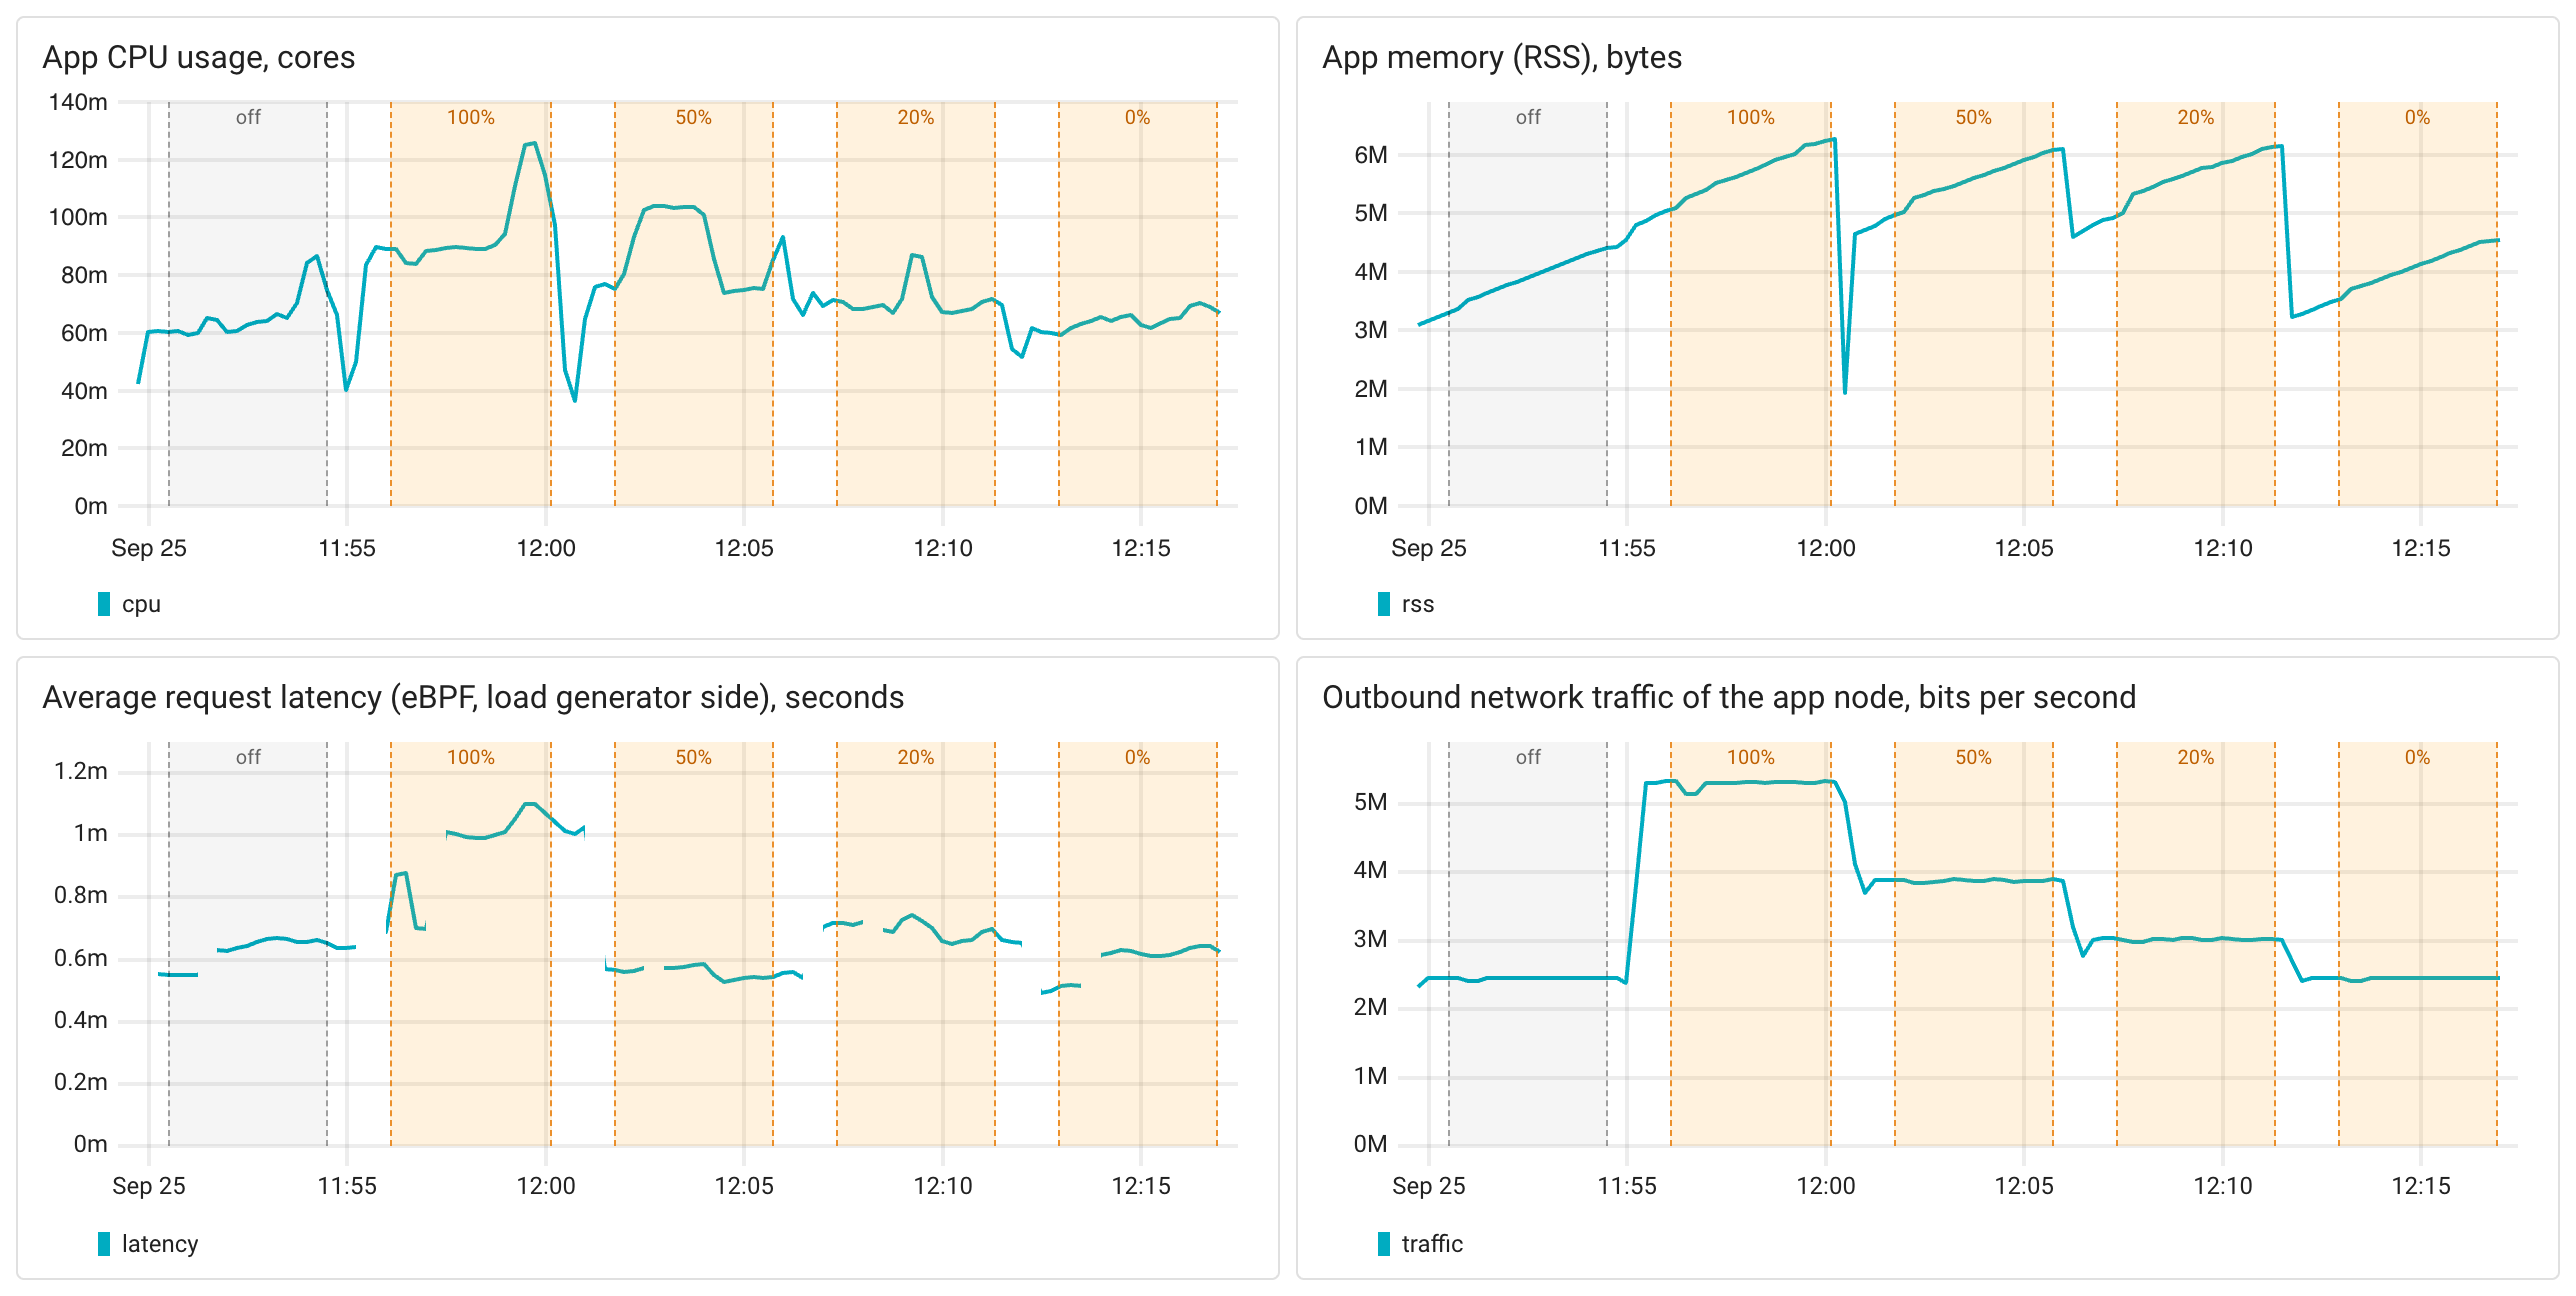
Each shaded area on the charts is a 4-minute measurement in one mode (the second of the two passes; the tables average both).
| Mode | off | 100% | 50% | 20% | 0% |
|---|---|---|---|---|---|
| Spans received by Coroot, per second | 0 | 1,994 | 996 | 400 | 0 |
| CPU usage, cores | 0.067 | 0.095 (+42%) | 0.089 (+33%) | 0.071 (+5%) | 0.074 (+10%) |
| Memory (RSS), MB | 4.0 | 5.7 | 5.7 | 5.7 | 4.1 |
| Trace export traffic, Mbit/s | - | 2.9 | 1.4 | 0.6 | 0 |
| Latency, p50, ms | 0.55 | 0.64 | 0.55 | 0.56 | 0.55 |
| Latency, p99, ms | 1.9 | 2.9 | 1.7 | 1.8 | 1.5 |
- CPU: tracing every request costs 0.03 CPU cores per 1,000 requests per second, +42% for this app. At 20% and 0% sampling it's within 5-10%, close to the noise between runs (the two passes of the same mode differ by up to 0.015 cores).
- Memory: 1.7MB more. On the charts, memory climbs during every 4-minute run, including the one without the SDK. That's not a leak: in a 20-minute run the process grows for the first 6 minutes and then stays flat, with or without tracing. Each phase restarts the app, so the charts only show that ramp.
- Network: about 180 bytes per span, like Rust: hand-made spans carry only the attributes you set.
- Latency: the median goes up by 0.1 ms with every request traced, and nothing changes at lower sampling rates.
- Nothing was dropped.
Where the CPU goes
The flame graph compares the app without the SDK (baseline) with the app tracing every request (comparison). Red frames take a bigger share of CPU time with tracing on, green frames a smaller one.
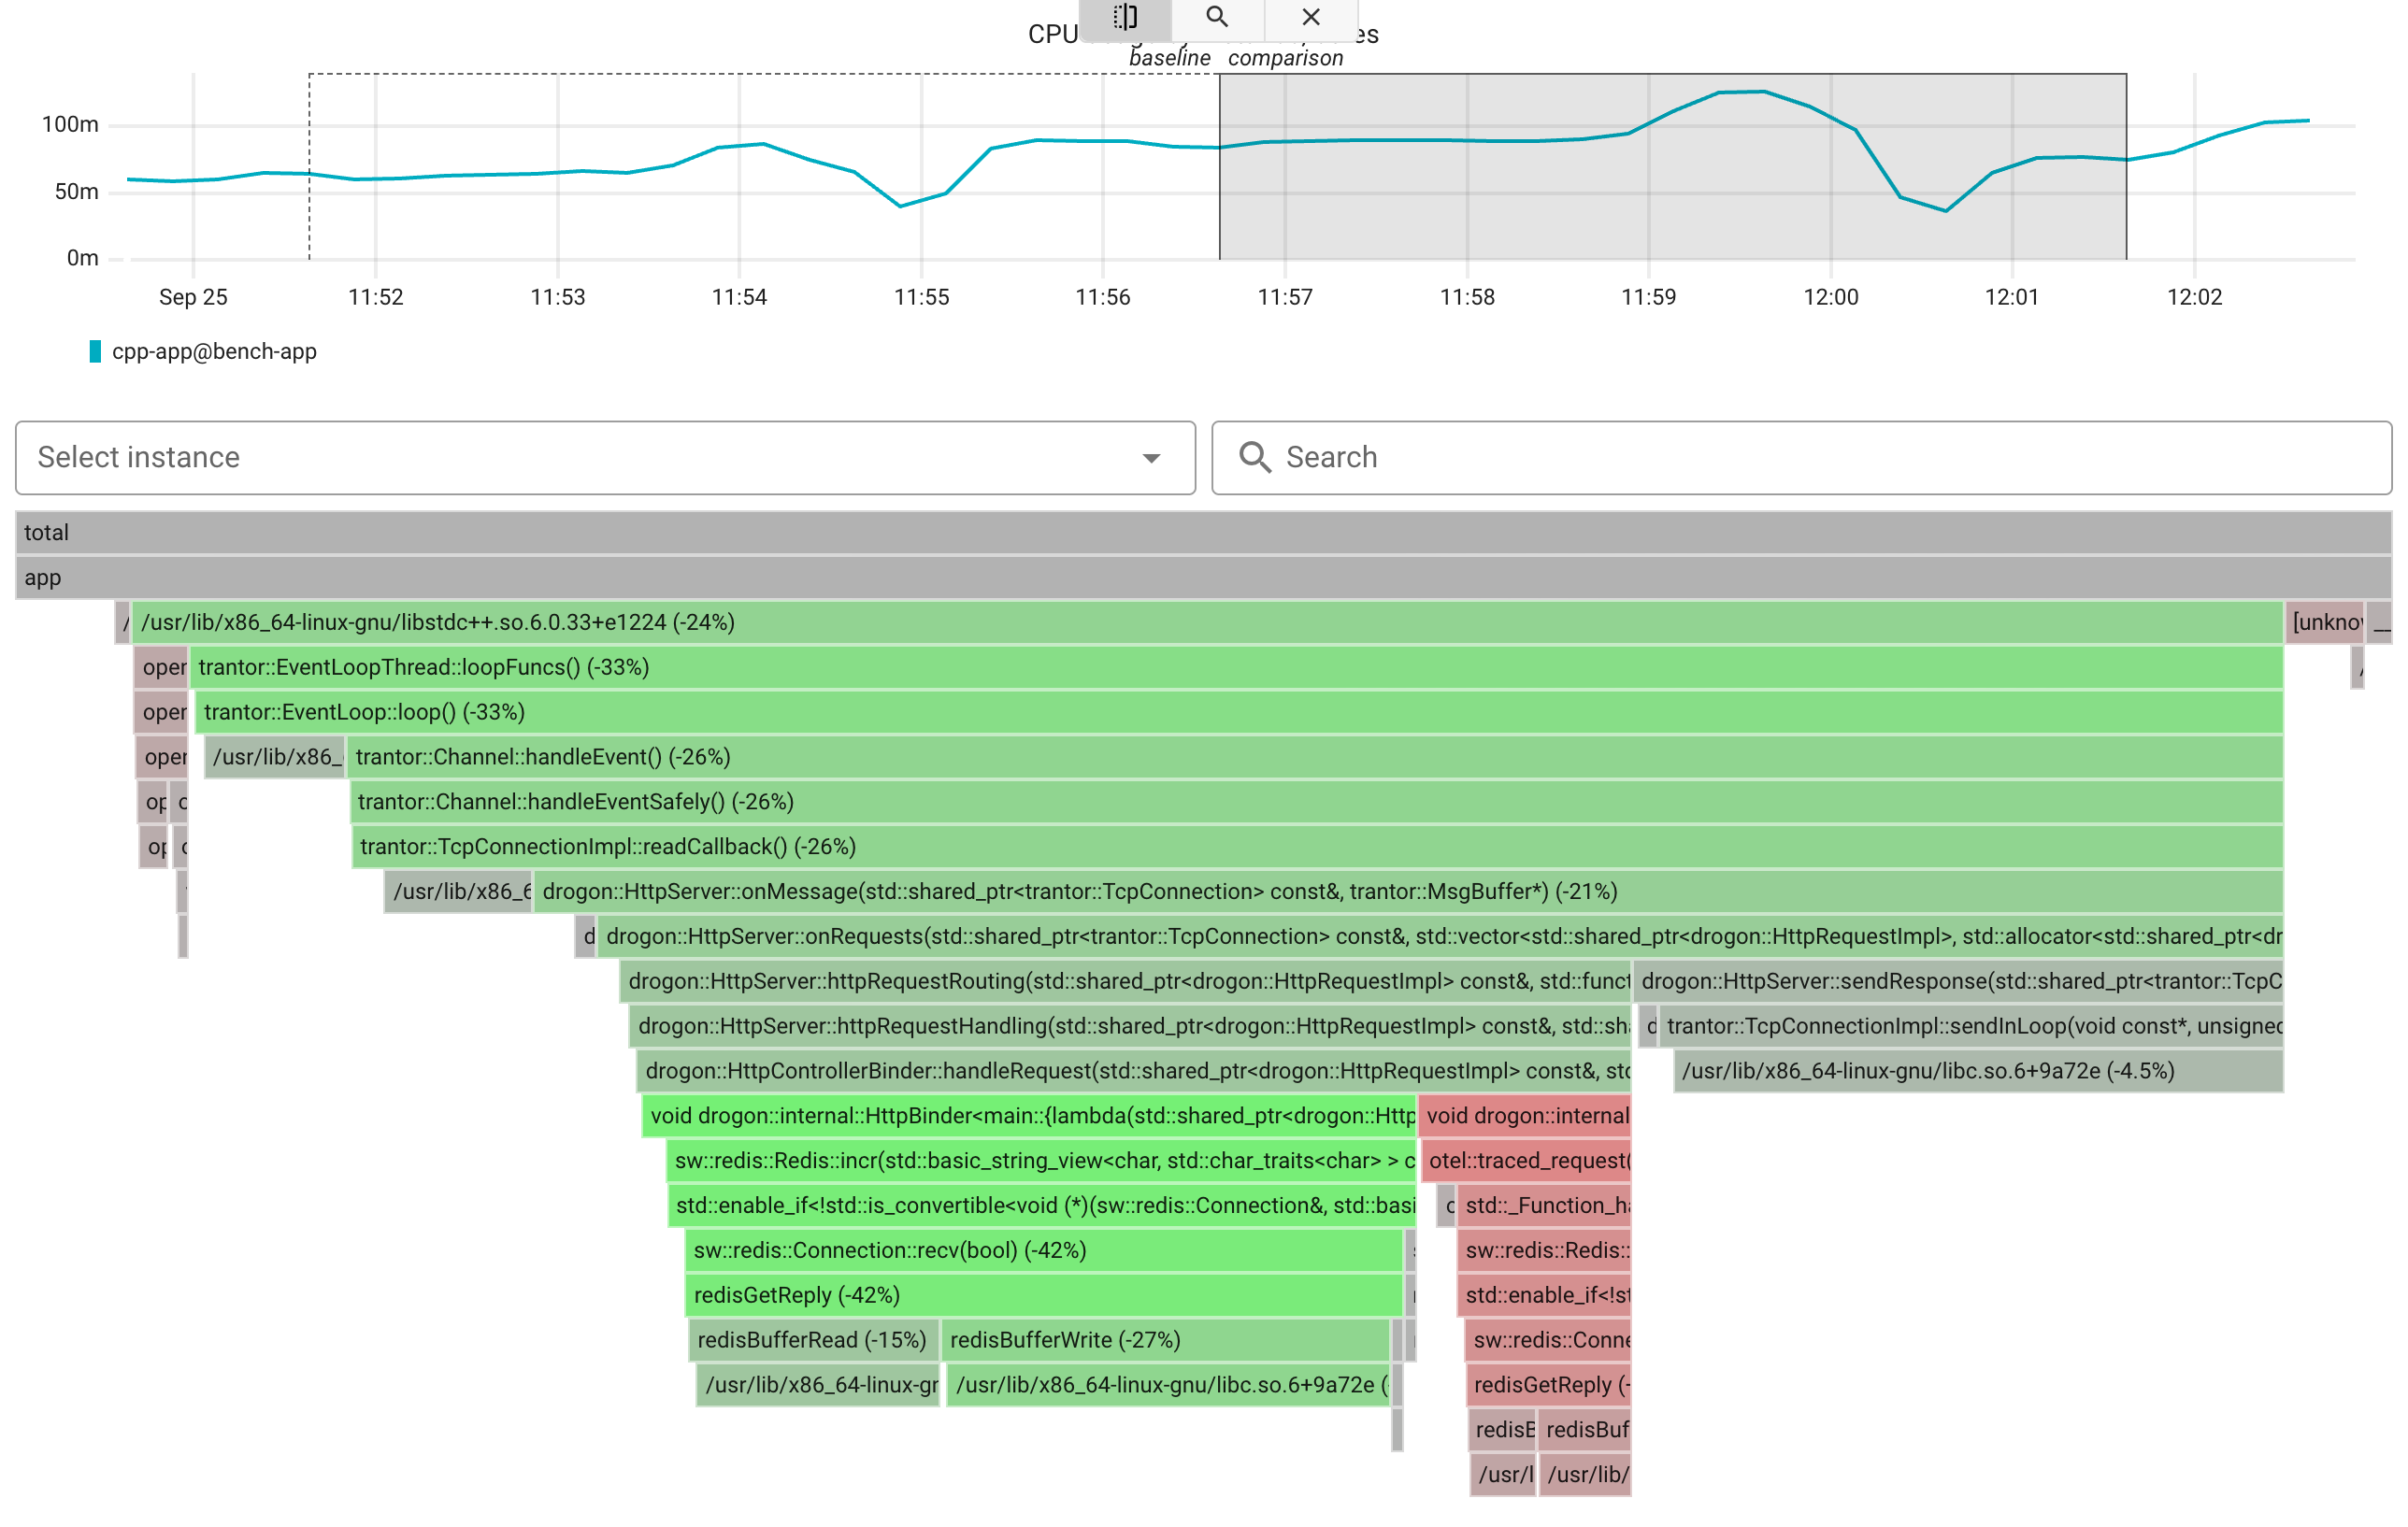
The request path is the same Drogon stack in both cases. The plain handler lambda (green) is replaced by otel::traced_request (red), which creates the two spans around the same redis->incr() call.
The exporter does its work on its own thread, so the IO threads only pay for creating the spans and handing them to the batch processor.
Takeaways
- Tracing a C++ service costs about 0.03 CPU cores per 1,000 requests per second and less than 2MB of memory. Latency barely changes.
- Sampling lowers the cost but doesn't remove it: at 0% the instrumentation still adds about 10% CPU, since the spans are created and the sampling decision is made on every request.