 Java
Java
How we measured explains the setup. This page is about Java.
The app
- Java 21 (Eclipse Temurin), Spring Boot 3.5 with embedded Tomcat, Spring Data Redis with Lettuce 6.6. No JVM flags: the heap is the container-aware default
- The OpenTelemetry Java agent 2.31 (SDK 1.65). It instruments the app at startup, so the app itself has no OpenTelemetry code at all
@SpringBootApplication
@RestController
public class App {
    private final StringRedisTemplate redis;

    public App(StringRedisTemplate redis) {
        this.redis = redis;
    }

    @GetMapping("/")
    public ResponseEntity<String> index() {
        Long value = redis.opsForValue().increment("counter");
        return ResponseEntity.ok().contentType(MediaType.TEXT_PLAIN).body(String.valueOf(value));
    }
}
The agent is attached only when tracing is on:
export OTEL_TRACES_EXPORTER=otlp
export OTEL_METRICS_EXPORTER=none
export OTEL_LOGS_EXPORTER=none
export OTEL_EXPORTER_OTLP_PROTOCOL=http/protobuf
java -javaagent:/otel/opentelemetry-javaagent.jar -jar /app/app.jar
Out of the box the agent makes exactly two spans per request: the Tomcat instrumentation makes the SERVER span and the Lettuce one makes the CLIENT span.
Results
Each shaded area on the charts is a 4-minute measurement in one mode (the second of the two passes; the tables average both). The CPU spikes in between are JVM startups: the JIT compiler is busy during the 90-second warm-up, which isn't measured.
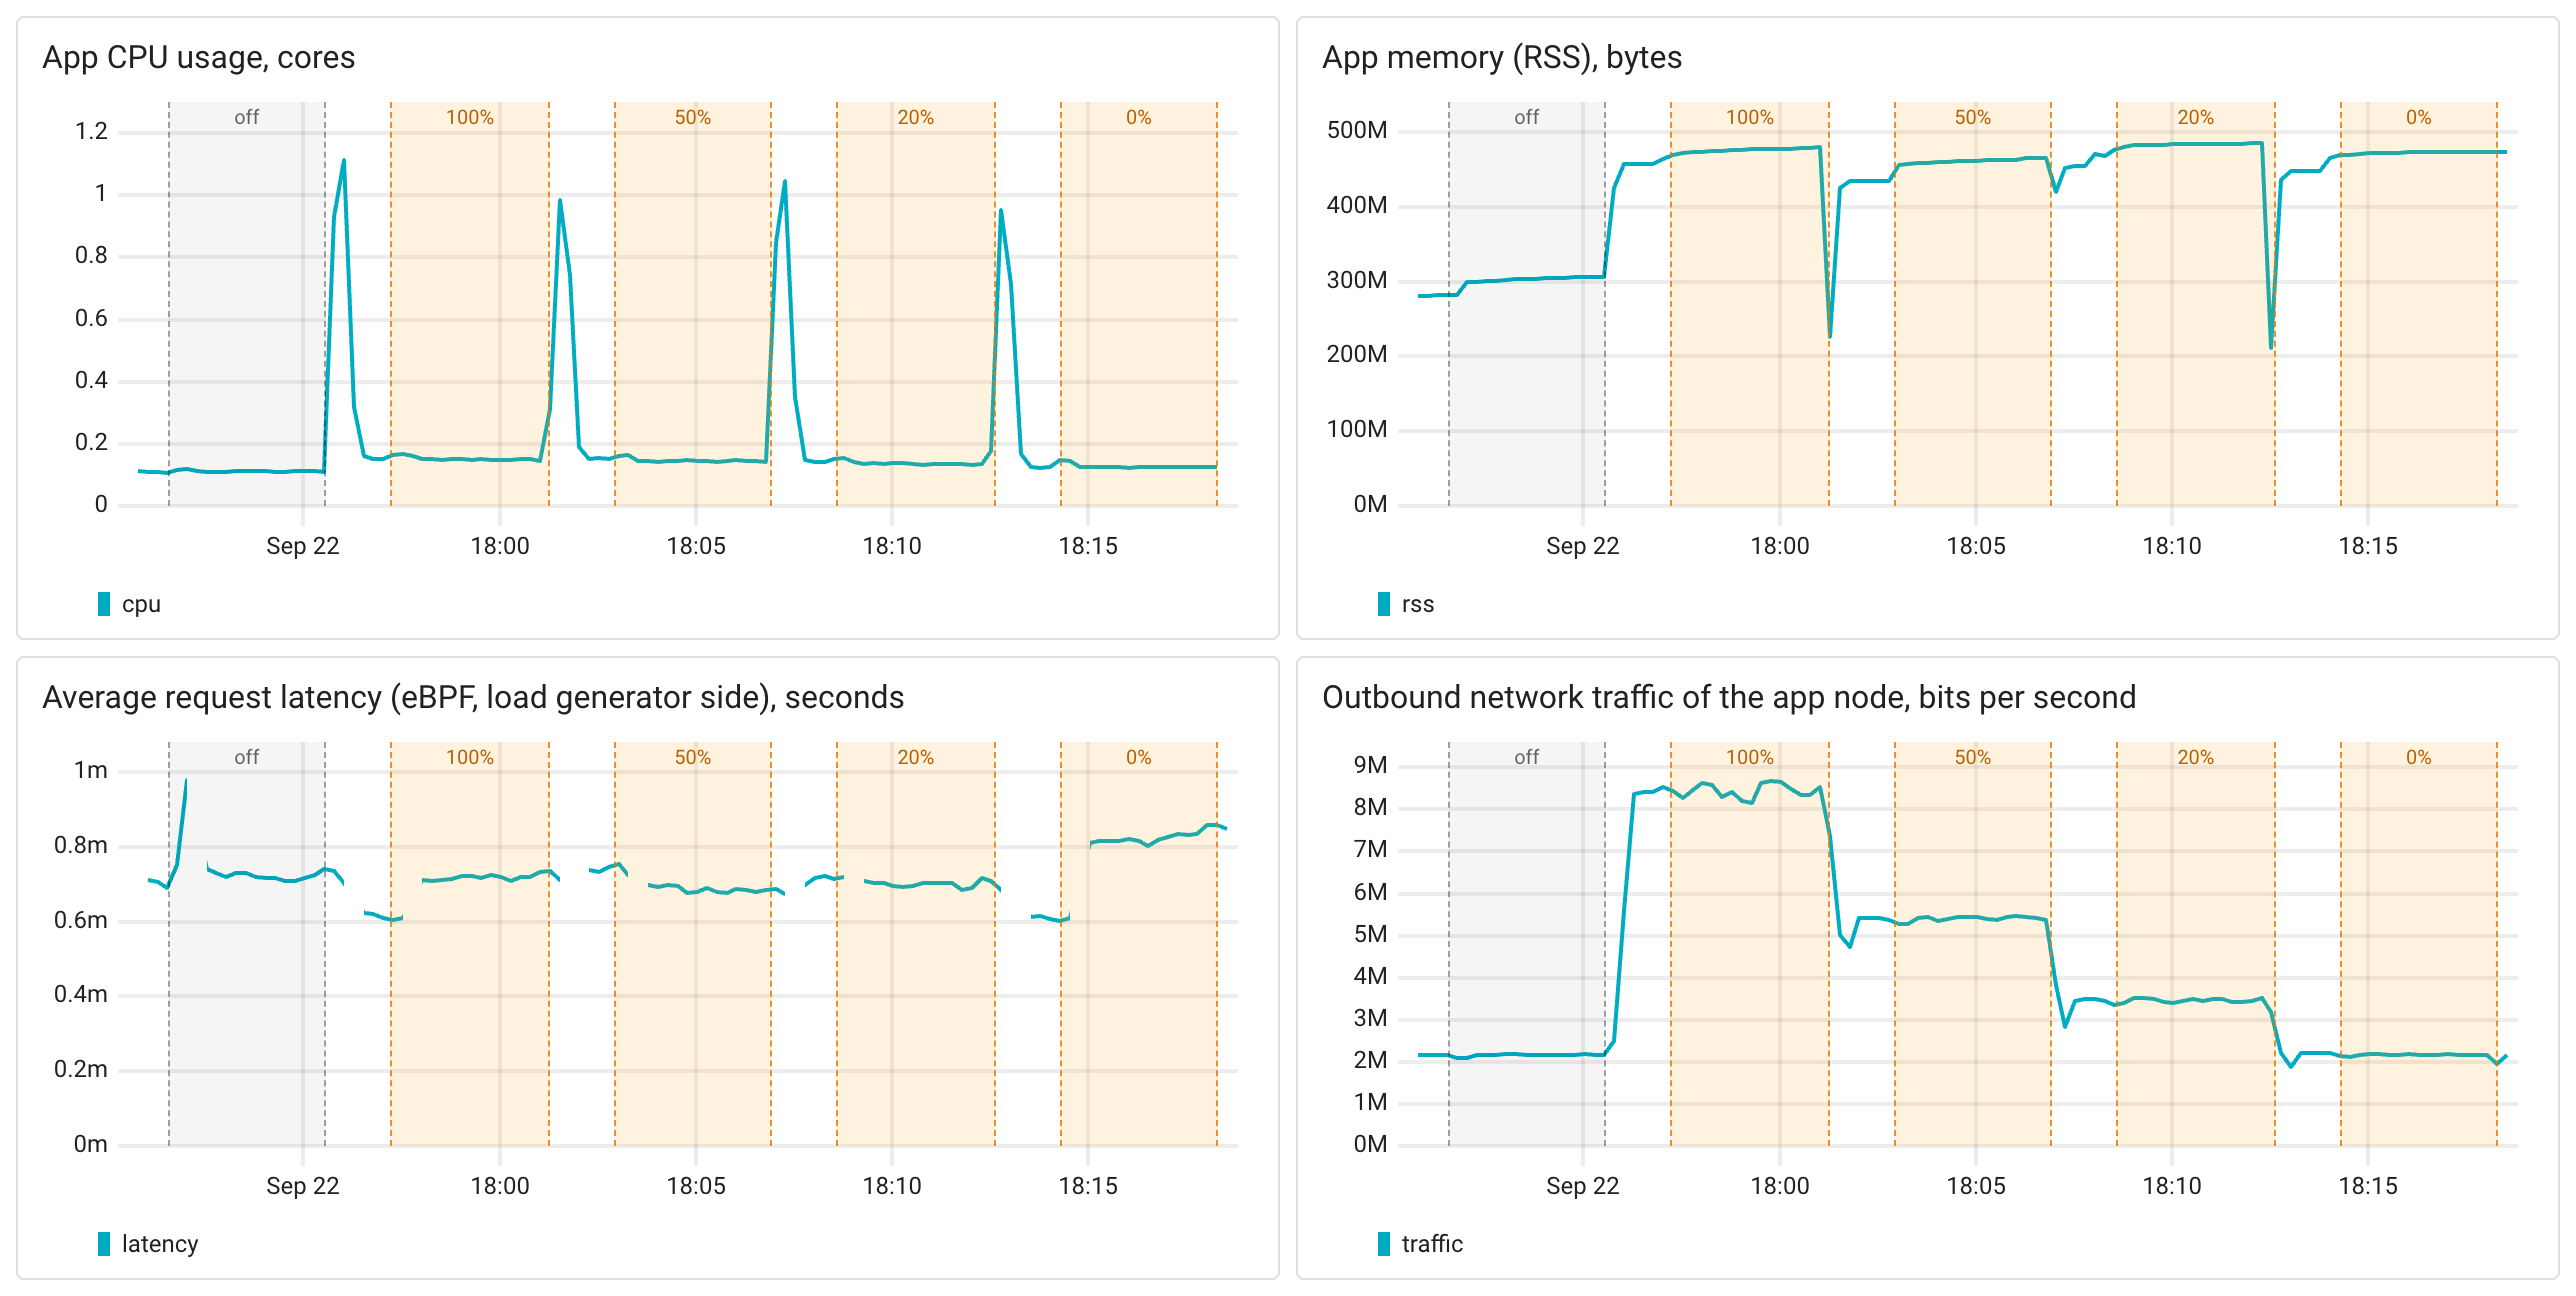
| Mode | off | 100% | 50% | 20% | 0% |
|---|---|---|---|---|---|
| Spans received by Coroot, per second | 0 | 1,940 | 998 | 398 | 0 |
| CPU usage, cores | 0.113 | 0.147 (+30%) | 0.141 (+25%) | 0.134 (+19%) | 0.125 (+11%) |
| Memory (RSS), MB | 310 | 459 (+48%) | 466 (+50%) | 482 (+56%) | 466 (+50%) |
| Trace export traffic, Mbit/s | - | 6.3 | 3.3 | 1.3 | 0 |
| Latency, p50, ms | 0.63 | 0.64 | 0.61 | 0.61 | 0.65 |
| Latency, p99, ms | 1.6 | 1.8 | 1.6 | 1.6 | 1.7 |
- CPU: tracing every request costs 0.03 CPU cores per 1,000 requests per second, +30% for this app. At 0% sampling it's still +11%.
- Memory: the agent adds about 150MB, and the sampling rate makes no difference. That's the agent itself: its classes, the instrumented bytecode and the SDK.
- Network: about 400 bytes per span, 6.3 Mbit/s for 2,000 spans per second.
- Latency: no change.
- At 100% sampling Coroot received 1,940 spans per second instead of 2,000: about 3% of the spans didn't make it. At 50% and below the count was exact.
Where the CPU goes
The eBPF profiler can't name JIT-compiled Java frames by itself, so for this flame graph coroot-node-agent was started with --enable-java-async-profiler,
which attaches async-profiler to the JVM. It comes from a separate off → 100% run, so the numbers in the table above are not affected by it.
Red frames take a bigger share of CPU time with the agent on, green frames a smaller one.
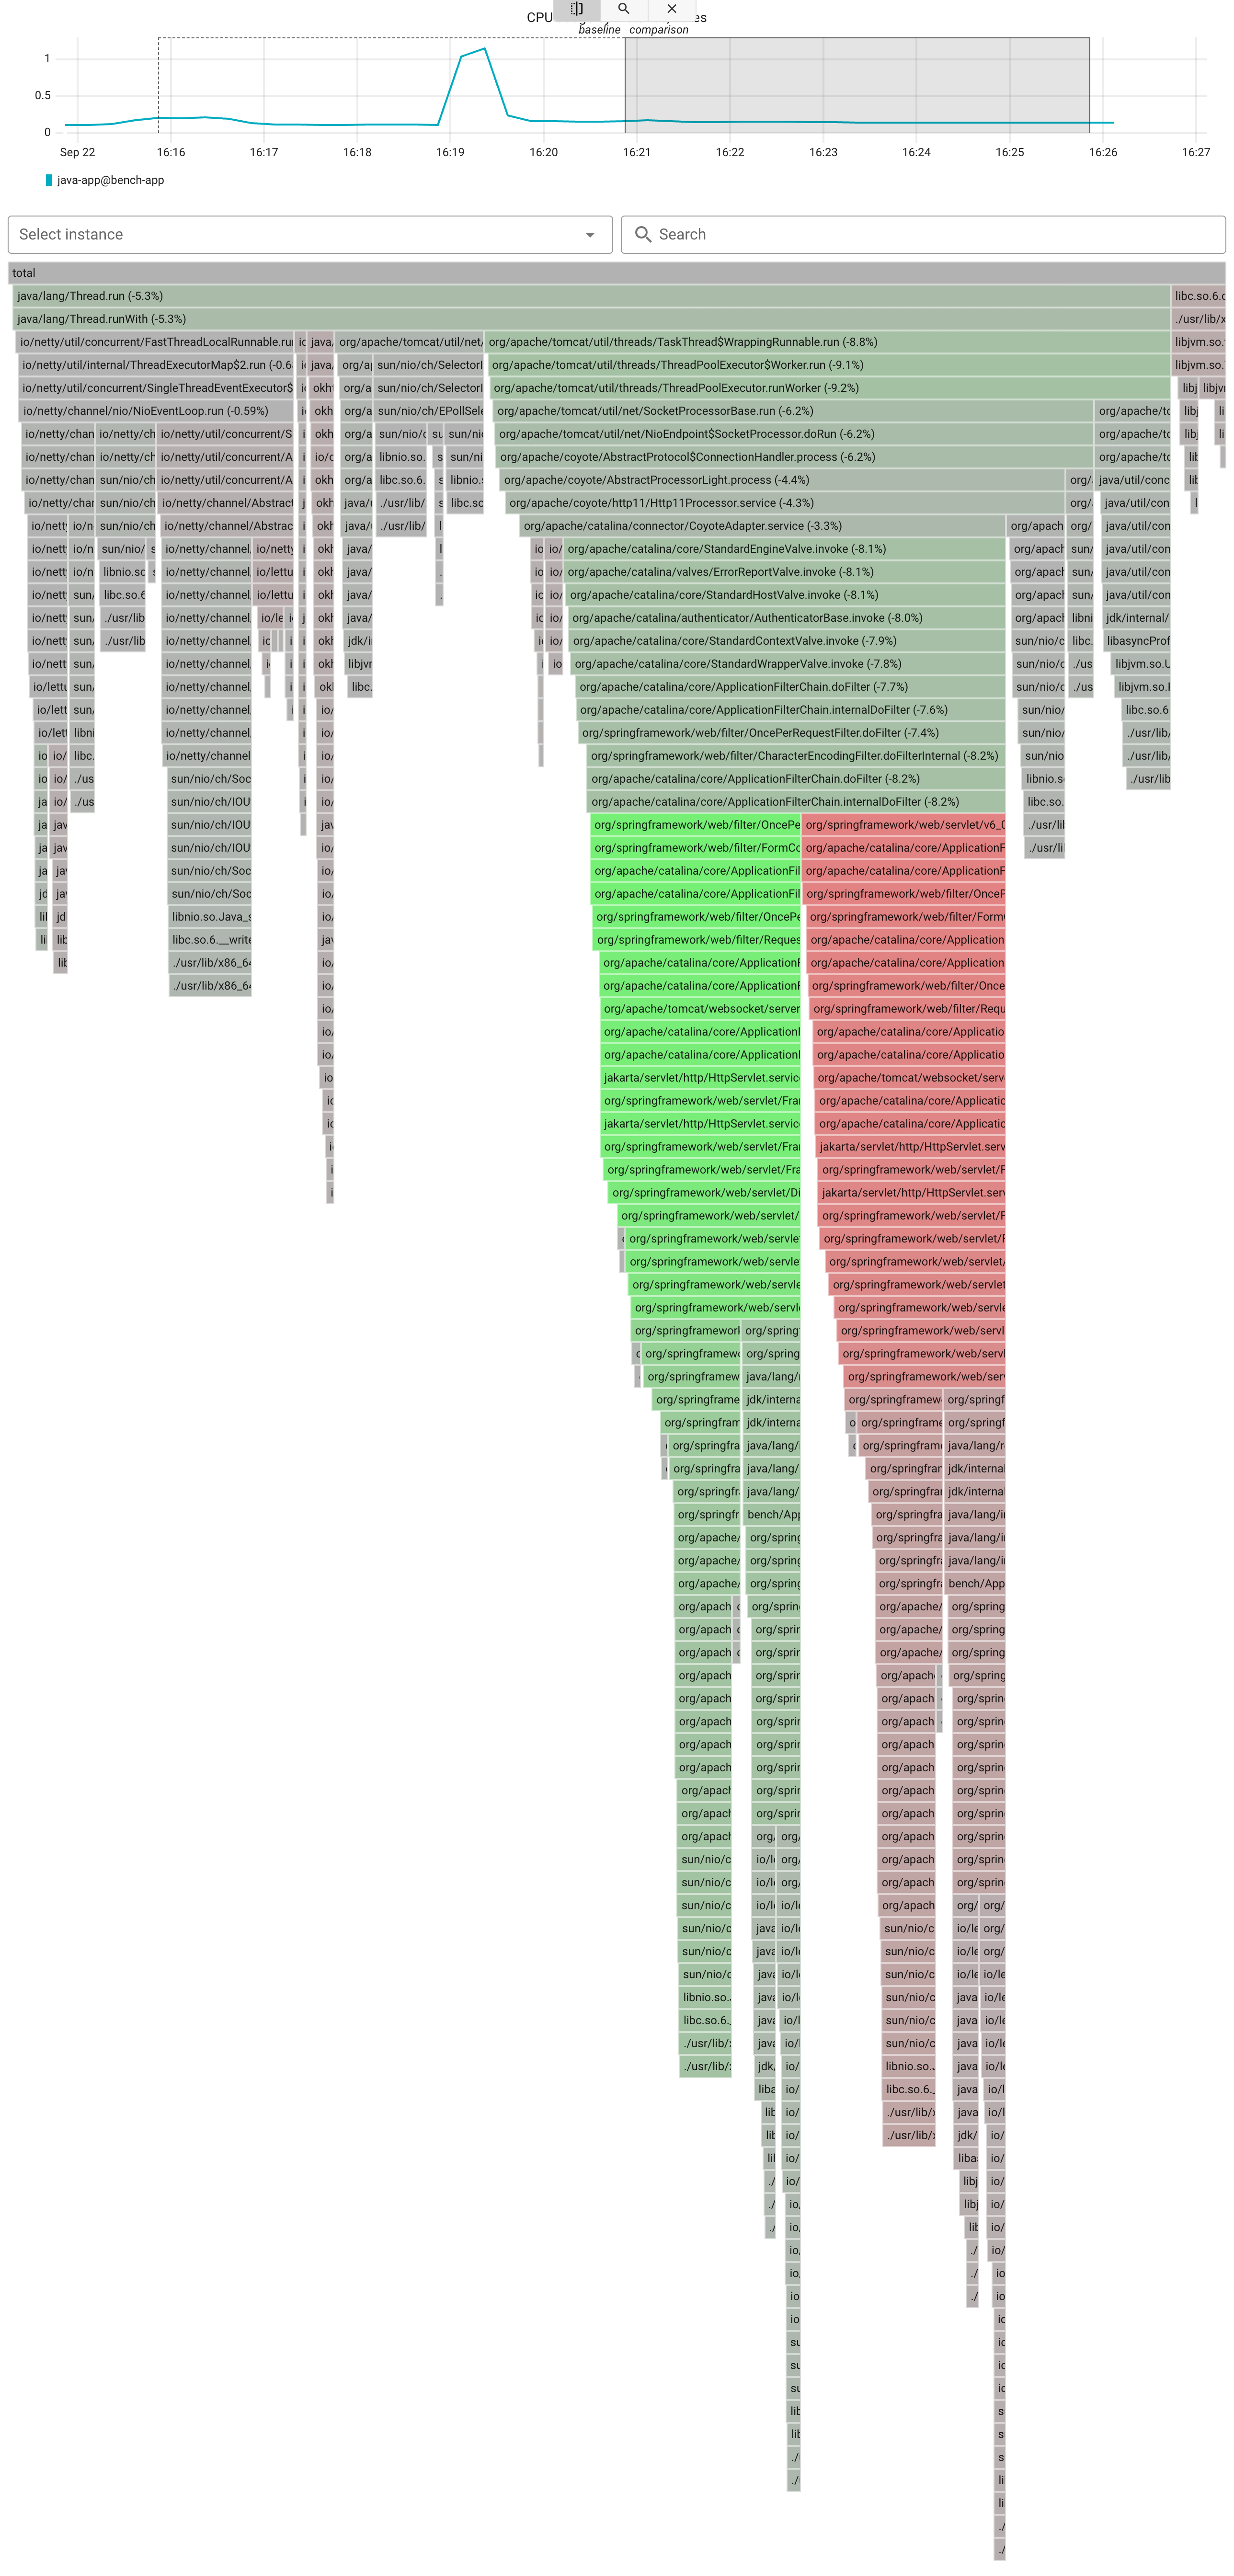
The two tall columns in the middle are the same Spring MVC request path. Without the agent it's the green one. With the agent, Tomcat's filter chain gets
OpenTelemetry's filters (OpenTelemetryHandlerMappingFilter and friends), which start and end the server span around the request, so the same frames show up
as a new, red column. The Lettuce instrumentation adds its span on the Netty event loop threads on the left.
Takeaways
- Tracing a Spring Boot service with the Java agent costs about 0.03 CPU cores per 1,000 requests per second, about 150MB of memory and about 400 bytes of traffic per span.
- Sampling lowers the cost but doesn't remove it. Even at 0%, the agent adds 11% CPU and the same 150MB of memory. The instrumented code, the context propagation and the sampling decision run on every request. Sampling only skips recording, serializing and sending the spans.