 Ruby
Ruby
How we measured explains the setup. This page is about Ruby.
The app
- Ruby 3.4 with YJIT, Sinatra 4.2 on Puma 8 in cluster mode: 4 worker processes with 8 threads each, redis-rb 6 with a connection pool per worker
- OpenTelemetry Ruby SDK 1.13 with
opentelemetry-exporter-otlp0.36 and therack,sinatraandredisinstrumentation gems. Ruby has no zero-code agent, so the SDK is set up in code, in a file that is only required whenENABLE_OTELis set
require_relative "otel" unless ENV["ENABLE_OTEL"].to_s.empty?

class App < Sinatra::Base
  get "/" do
    content_type "text/plain"
    RedisPool.pool.with { |redis| redis.call("INCR", "counter") }.to_s
  end
end
# otel.rb: exporter, sampler and propagators come from the standard OTEL_* environment variables
OpenTelemetry::SDK.configure do |c|
  c.use "OpenTelemetry::Instrumentation::Rack"
  c.use "OpenTelemetry::Instrumentation::Sinatra"
  # don't trace the connection handshakes that happen outside of requests
  c.use "OpenTelemetry::Instrumentation::Redis", { trace_root_spans: false }
end
The SDK handles Puma's forking by itself: each worker starts its own export thread when it finishes its first span.
Results
Each shaded area on the charts is a 4-minute measurement in one mode (the second of the two passes; the tables average both).
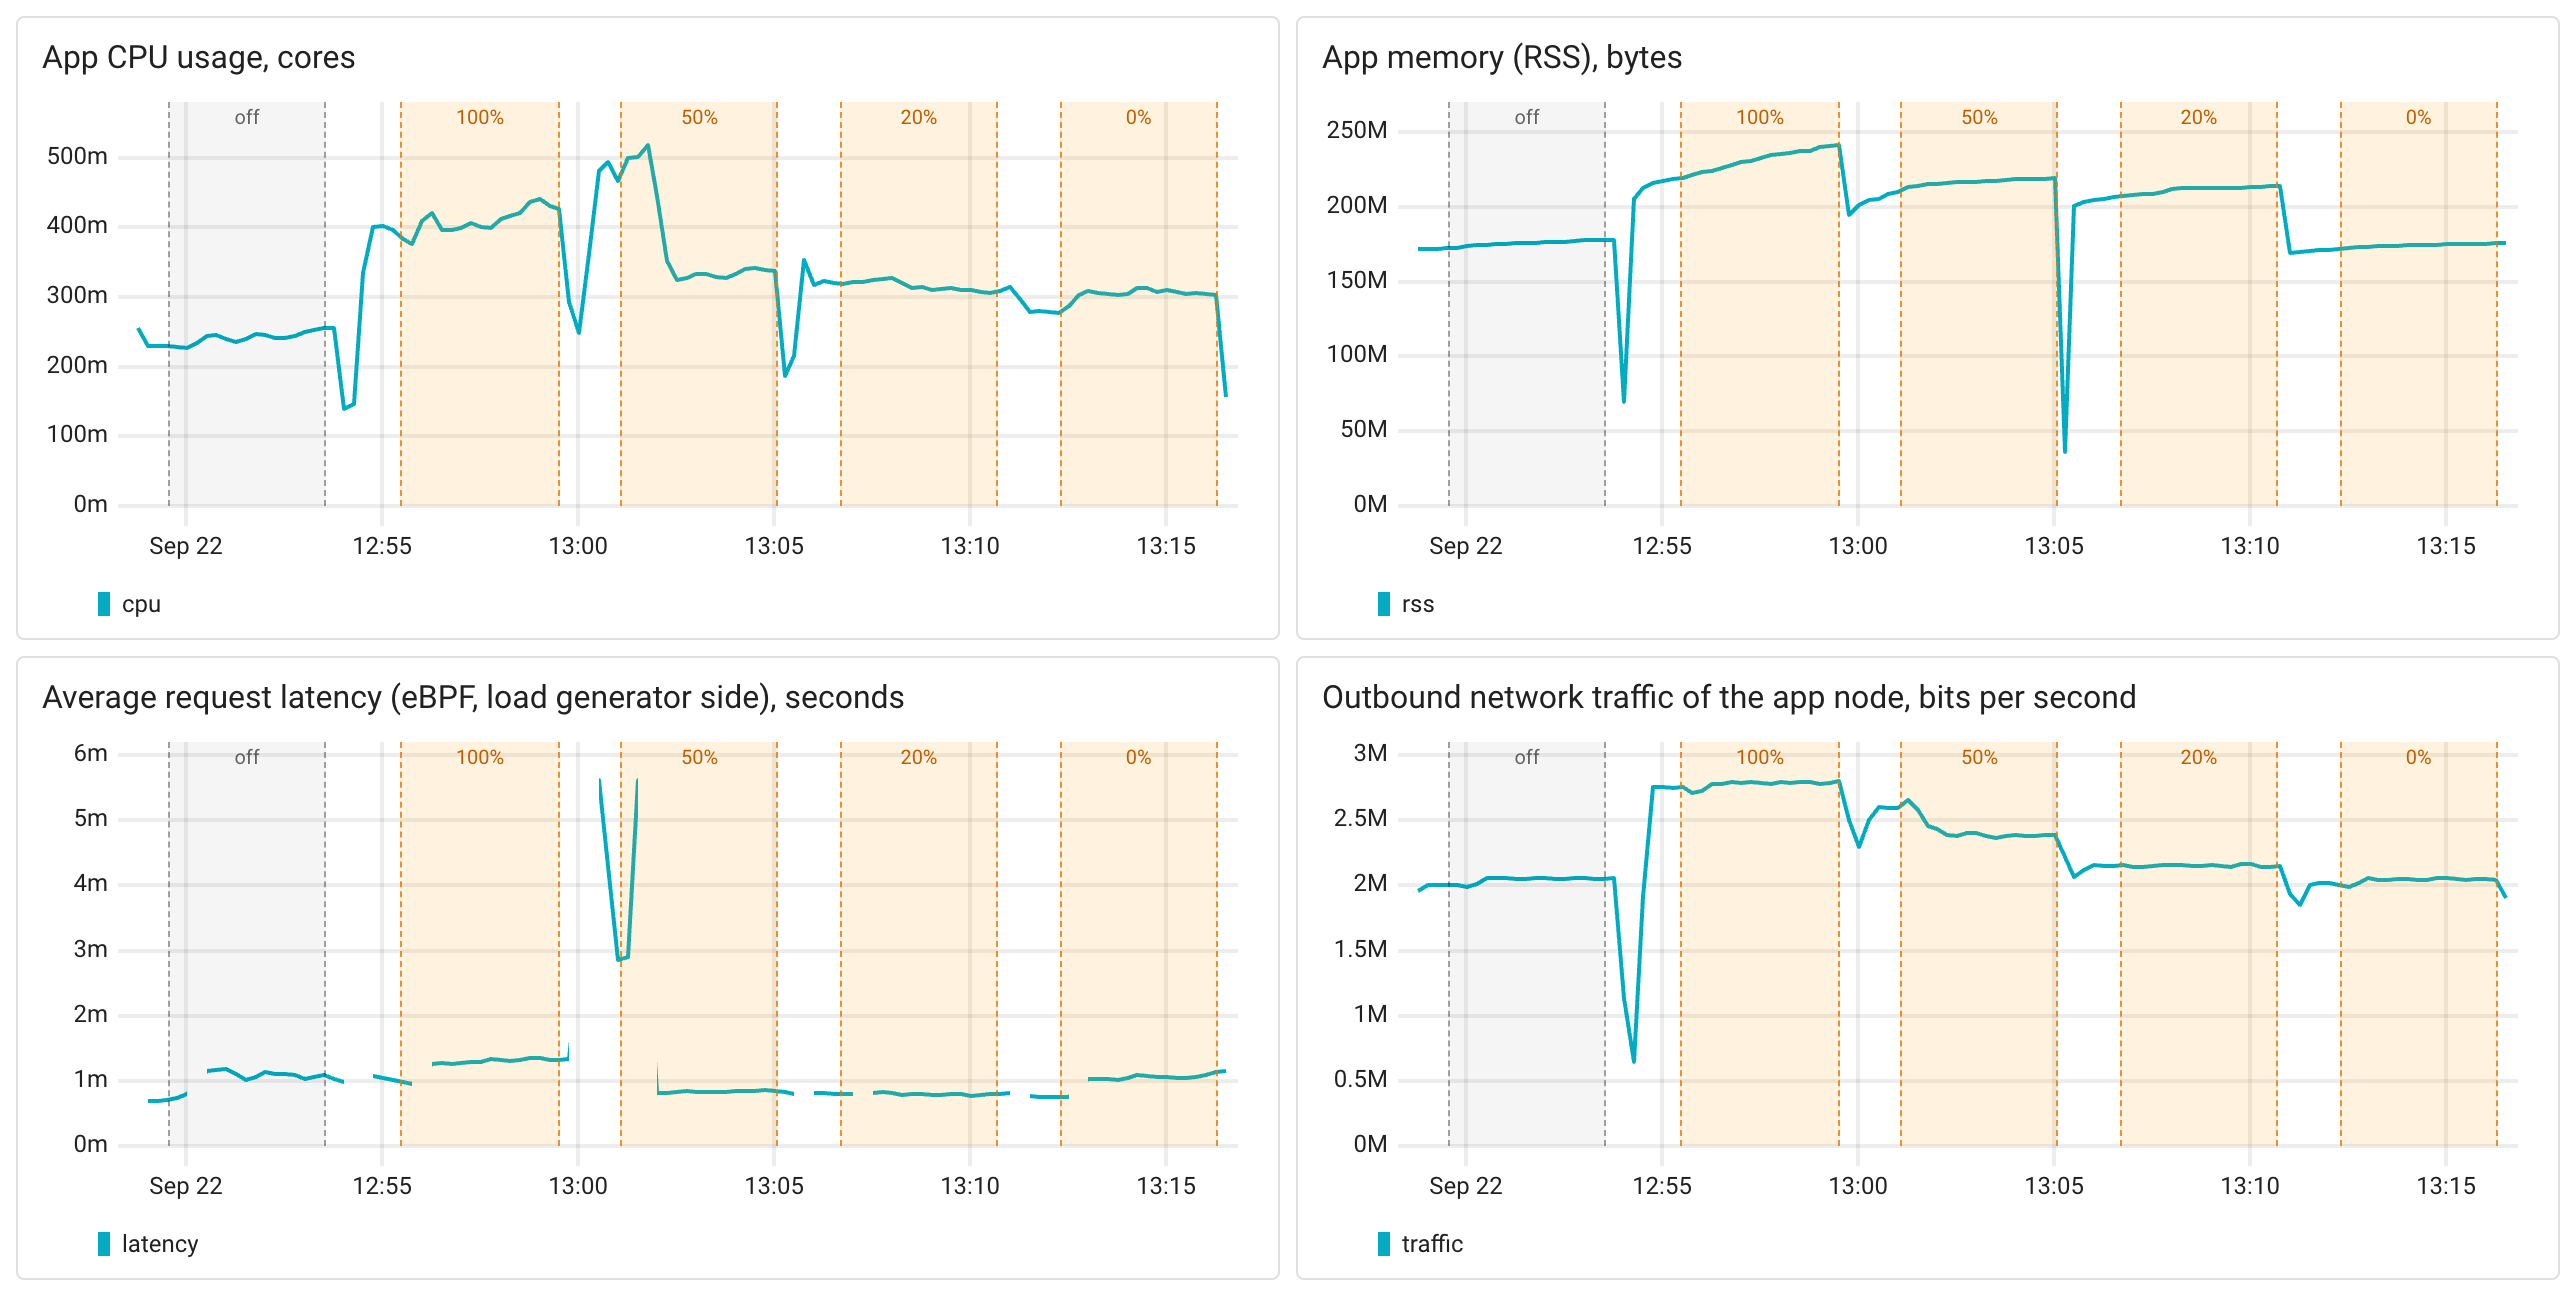
| Mode | off | 100% | 50% | 20% | 0% |
|---|---|---|---|---|---|
| Spans received by Coroot, per second | 0 | 1,993 | 996 | 399 | 0 |
| CPU usage, cores | 0.24 | 0.40 (+67%) | 0.35 (+45%) | 0.31 (+28%) | 0.29 (+21%) |
| Memory (RSS), MB | 170 | 231 (+36%) | 216 (+27%) | 210 (+24%) | 177 (+4%) |
| Trace export traffic, Mbit/s | - | 0.7 | 0.35 | 0.1 | 0 |
| Latency, p50, ms | 0.76 | 0.79 | 0.78 | 0.73 | 0.77 |
| Latency, p99, ms | 2.7 | 10.9 | 5.6 | 2.4 | 2.5 |
- CPU: tracing every request costs 0.16 CPU cores per 1,000 requests per second, +67% for this app. At 0% sampling it's still +21%. Surprisingly, the Ruby app was the second cheapest one in absolute numbers: with YJIT and a tiny handler, the baseline itself is only 0.24 cores, and the SDK adds about as much per request as the Go SDK does.
- Memory: the SDK adds about 15MB per worker process. At 0% sampling almost nothing: no span objects are created.
- Network: about 45 bytes per span, by far the smallest in the benchmark: the Ruby exporter compresses payloads with gzip by default.
- Latency: the median doesn't change, but the 99th percentile goes from 2.7 ms to 10.9 ms with every request traced, and it scales with the sampling rate. That's garbage collection: every span is a few Ruby objects, and the worker pauses more often to collect them.
- Nothing was dropped.
Takeaways
- Tracing a Ruby service costs about 0.16 CPU cores per 1,000 requests per second, 15MB of memory per worker, and a higher tail latency from garbage collection. Network traffic is negligible thanks to gzip.
- Sampling lowers the cost but doesn't remove it. Even at 0%, the instrumentation adds 21% CPU: the Rack middleware, the context propagation and the sampling decision run on every request.
Looking for 24/7 support from the Coroot team? Subscribe to Coroot Enterprise:Start free trial