 Python
How we measured explains the setup. This page is about Python.
The app
- Python 3.13, FastAPI 0.141 on uvicorn 0.53 (uvloop, httptools) with 4 worker processes, redis-py 8.1 (asyncio)
- Zero-code instrumentation:
opentelemetry-distro0.65b0 / SDK 1.44 started withopentelemetry-instrument, plus thefastapiandredisinstrumentations
app = FastAPI(lifespan=lifespan)

@app.get("/", response_class=PlainTextResponse)
async def index():
    value = await app.state.rdb.execute_command("INCR", "counter")
    return PlainTextResponse(str(value))

if os.environ.get("ENABLE_OTEL"):
    # by default the ASGI instrumentation adds two more INTERNAL spans per request ("http send" and "http receive");
    # the only way to turn them off is the exclude_spans option, which has no environment variable
    from opentelemetry.instrumentation.fastapi import FastAPIInstrumentor
    FastAPIInstrumentor.instrument_app(app, exclude_spans=["receive", "send"])
export OTEL_TRACES_EXPORTER=otlp
export OTEL_METRICS_EXPORTER=none
export OTEL_LOGS_EXPORTER=none
export OTEL_EXPORTER_OTLP_PROTOCOL=http/protobuf
export OTEL_PYTHON_DISABLED_INSTRUMENTATIONS=fastapi  # done in the code instead, see above
opentelemetry-instrument uvicorn app:app --host 0.0.0.0 --port 8080 --workers 4 --no-access-log
Results
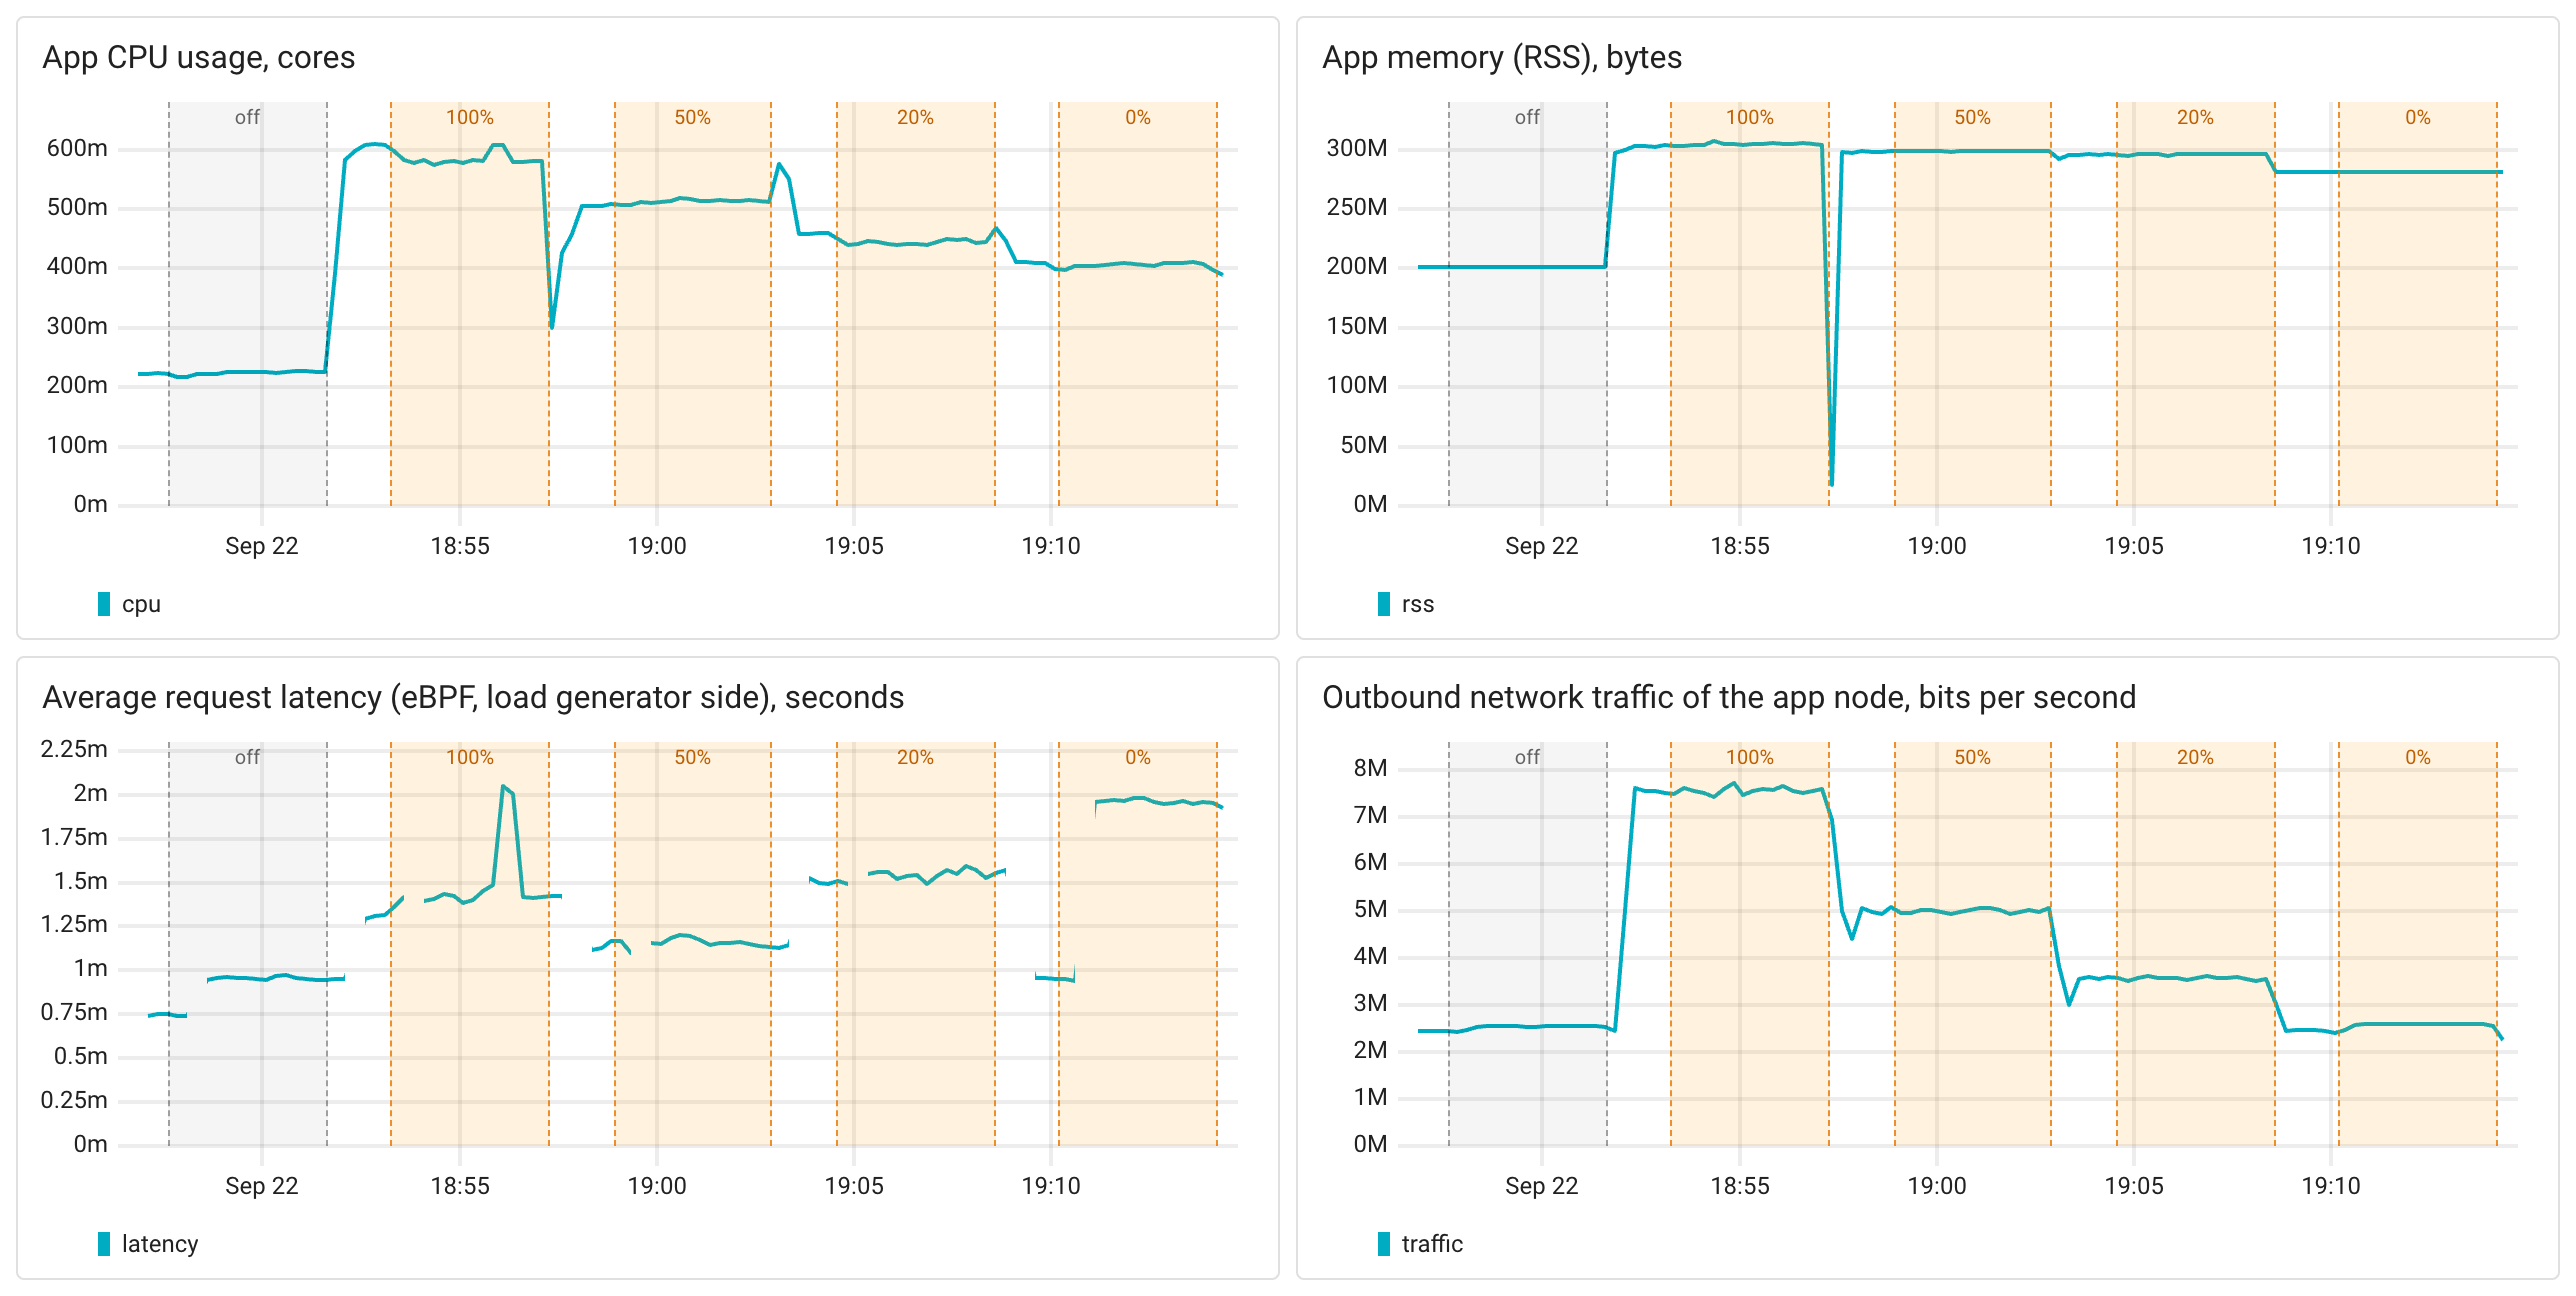
Each shaded area on the charts is a 4-minute measurement in one mode (the second of the two passes; the tables average both).
| Mode | off | 100% | 50% | 20% | 0% |
|---|---|---|---|---|---|
| Spans received by Coroot, per second | 0 | 1,994 | 996 | 400 | 0 |
| CPU usage, cores | 0.23 | 0.59 (+160%) | 0.50 (+121%) | 0.44 (+92%) | 0.40 (+74%) |
| Memory (RSS), MB | 201 | 304 (+51%) | 299 (+49%) | 296 (+47%) | 281 (+40%) |
| Trace export traffic, Mbit/s | - | 5.1 | 2.6 | 1.1 | 0 |
| Latency, p50, ms | 0.75 | 1.04 | 1.02 | 1.00 | 1.05 |
| Latency, p99, ms | 2.0 | 13.3 | 8.5 | 5.2 | 3.7 |
- CPU: with every request traced, the app needs 2.6 times the CPU: +0.36 cores per 1,000 requests per second. At 0% sampling the overhead is still +74%, the biggest of all the languages: the instrumentation itself is interpreted Python code that runs on every request.
- Memory: about 25MB per worker process, 100MB in total.
- Network: about 320 bytes per span.
- Latency: the median goes up by 0.3 ms in every traced mode, sampled or not. The 99th percentile grows from 2 ms to 13 ms with every request traced, and it scales with the sampling rate: the more spans a worker creates and exports, the more often it pauses for garbage collection and for the export thread.
- Nothing was dropped.
Where the CPU goes
The flame graph compares the app without the SDK (baseline) with the app tracing every request (comparison). Red frames take a bigger share of CPU time with tracing on.
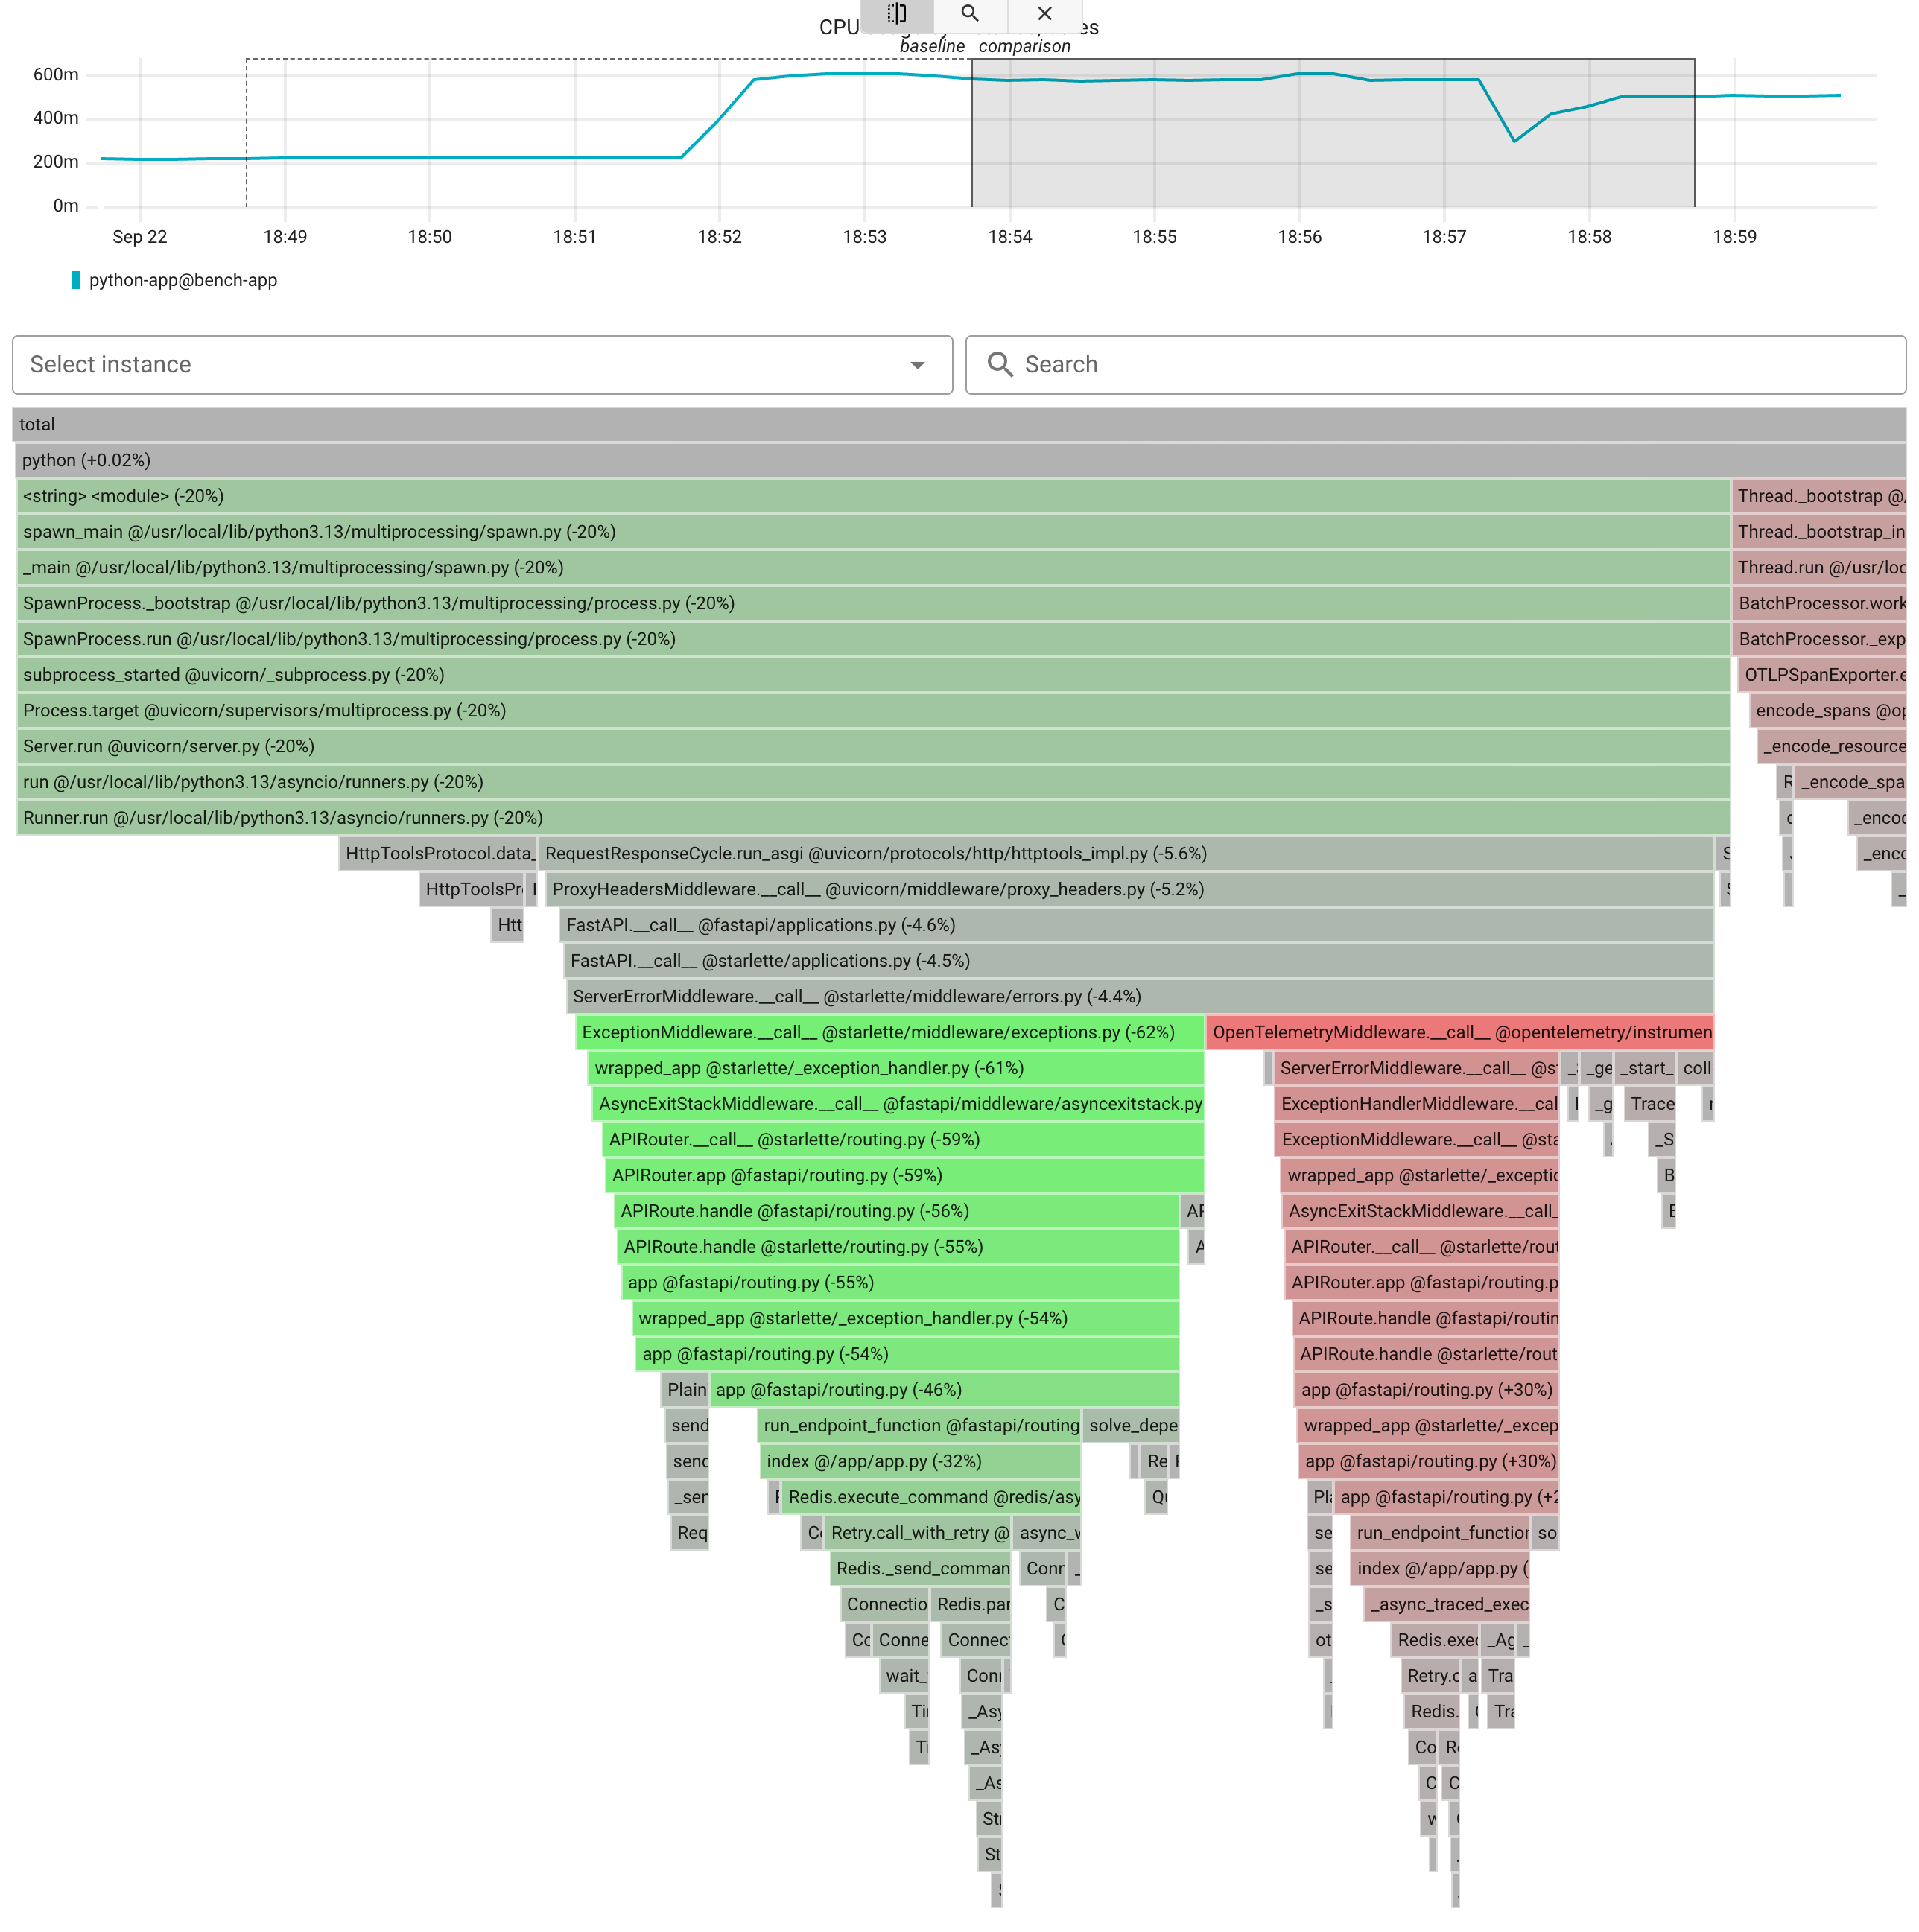
The whole request now runs inside OpenTelemetryMiddleware, and every Valkey command goes through _async_traced_execute_command.
Unlike in compiled languages, the instrumentation is interpreted Python code: creating a span with its attributes and context costs about as much as the request itself did before.
The batch processor thread on the right serializes and exports the spans, and because of the interpreter lock it competes with request handling for the same CPU time.
Takeaways
- Tracing a Python service costs about 0.36 CPU cores per 1,000 requests per second (2.6 times the CPU of this app), 25MB of memory per worker process, and a higher tail latency. A real application does more per request than one Valkey call, so the relative cost will be lower, but it stays the highest of all the languages we tested.
- Sampling lowers the cost but doesn't remove it. Even at 0%, the instrumentation adds 74% CPU and 0.3 ms to every request. The instrumented middleware, the context propagation and the sampling decision run on every request, sampled or not.
- Leave CPU headroom before turning on tracing in Python. On a smaller machine, the same app ran out of CPU with tracing on and stopped keeping up with the load.