 Go
Go
How we measured explains the setup. This page is about Go.
Two ways to instrument Go
Go can be instrumented in two ways, and we measured both:
- the SDK, wired by hand: you add the OpenTelemetry packages to your code and wrap the handlers and clients yourself. This is how most Go services are instrumented today;
- compile-time instrumentation: the
otelctool rewrites the code while building it (otelc go build), so the source stays free of OpenTelemetry code. It reached 1.0 in 2026.
Manual SDK
The app
- Go 1.27, the standard
net/httpserver, go-redis v9.22 - OpenTelemetry Go SDK v1.46, set up in code:
otelhttpv0.71 makes theSERVERspan,redisotelv9.22 makes theCLIENTspan, and the OTLP/HTTP exporter sends them
The handler is a few lines. Tracing is wrapped around it only when ENABLE_OTEL is set:
var handler http.Handler = http.HandlerFunc(func(w http.ResponseWriter, r *http.Request) {
    v, err := rdb.Incr(r.Context(), "counter").Result()
    if err != nil {
        http.Error(w, err.Error(), http.StatusInternalServerError)
        return
    }
    _, _ = w.Write(strconv.AppendInt(nil, v, 10))
})

if os.Getenv("ENABLE_OTEL") != "" {
    handler, shutdownTracing, err = setupTracing(rdb, handler)
}
func setupTracing(rdb *redis.Client, next http.Handler) (http.Handler, func(context.Context) error, error) {
    exp, err := otlptracehttp.New(context.Background())
    if err != nil {
        return nil, nil, err
    }
    tp := sdktrace.NewTracerProvider(sdktrace.WithBatcher(exp))
    otel.SetTracerProvider(tp)
    otel.SetTextMapPropagator(propagation.NewCompositeTextMapPropagator(propagation.TraceContext{}, propagation.Baggage{}))

    // without these filters redisotel also traces every connection dial and handshake command
    err = redisotel.InstrumentTracing(rdb, redisotel.WithDialFilter(true), redisotel.WithCommandFilter(isHandshake))
    if err != nil {
        return nil, nil, err
    }
    return otelhttp.NewHandler(next, "http.server"), tp.Shutdown, nil
}
Results
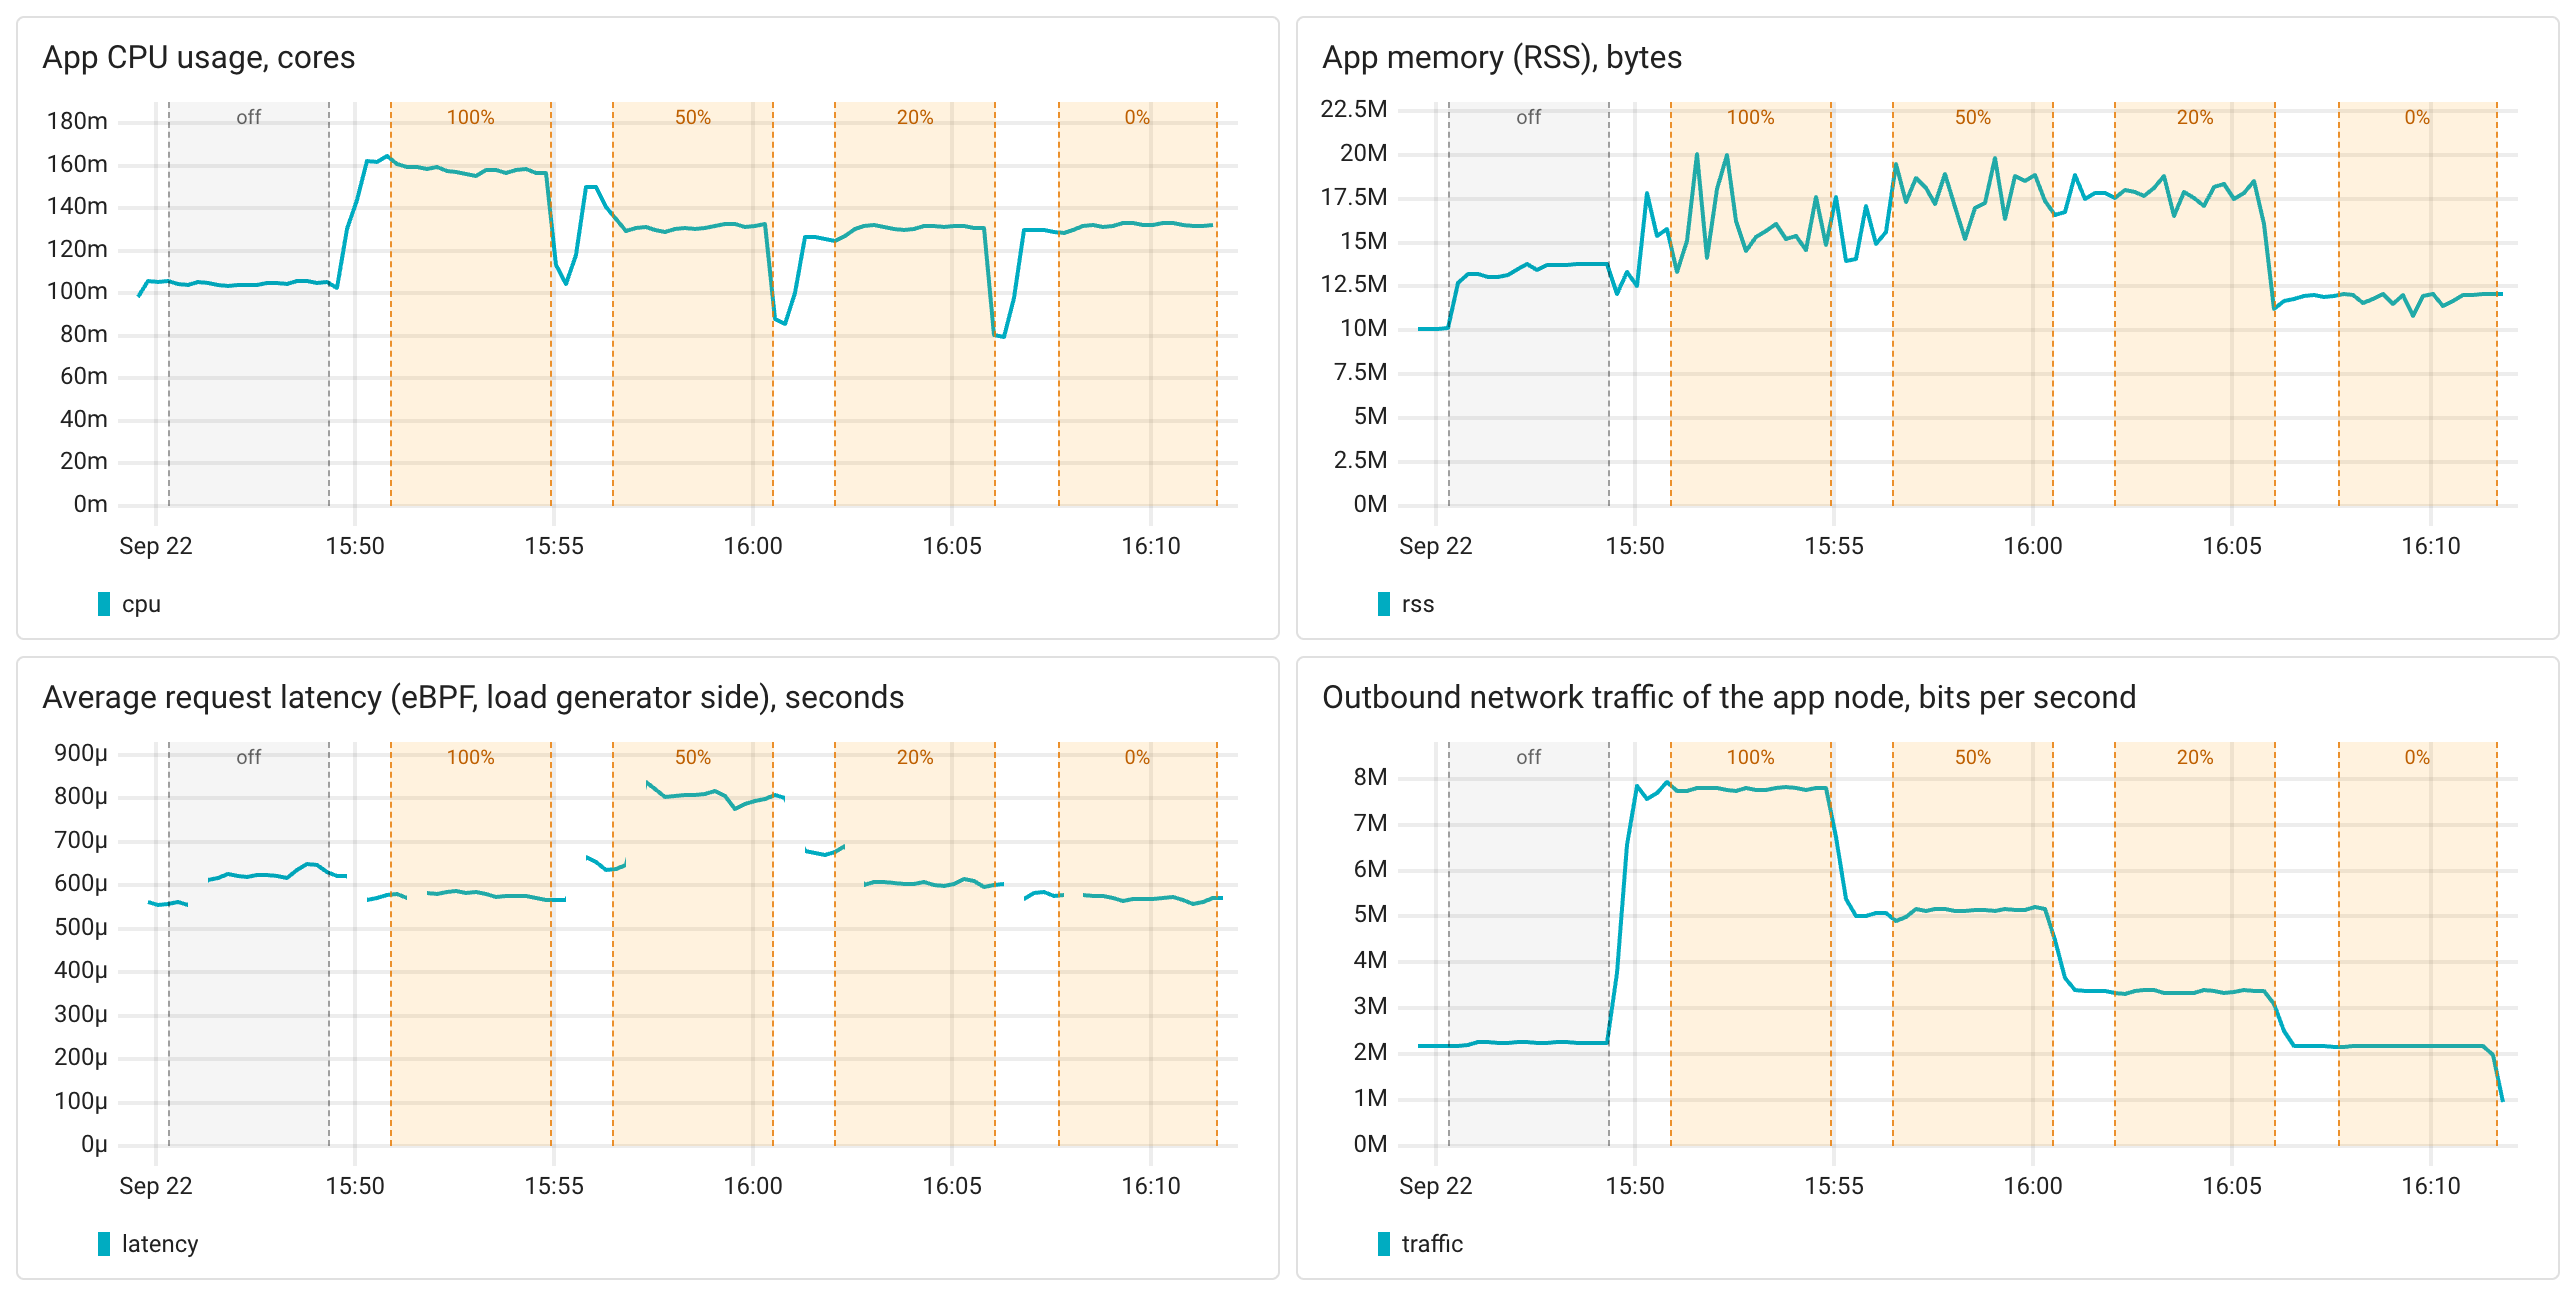
Each shaded area on the charts is a 4-minute measurement in one mode (the second of the two passes; the tables average both).
| Mode | off | 100% | 50% | 20% | 0% |
|---|---|---|---|---|---|
| Spans received by Coroot, per second | 0 | 1,993 | 997 | 399 | 0 |
| CPU usage, cores | 0.106 | 0.159 (+50%) | 0.136 (+29%) | 0.132 (+24%) | 0.128 (+20%) |
| Memory (RSS), MB | 13.1 | 15.3 | 16.4 | 16.5 | 13.5 |
| Trace export traffic, Mbit/s | - | 5.6 | 2.9 | 1.2 | 0 |
| Latency, p50, ms | 0.56 | 0.56 | 0.62 | 0.58 | 0.57 |
| Latency, p99, ms | 1.3 | 1.0 | 1.9 | 1.3 | 1.3 |
- CPU: tracing every request costs 0.05 CPU cores per 1,000 requests per second. For this app that's +50%, but remember it does nothing except one Valkey call. Sampling helps less than you'd think: at 20% the overhead is still 24%, and at 0% it's 20%.
- Memory: 1-3MB more. Nothing to worry about.
- Network: about 350 bytes per span. The Go exporter doesn't compress by default, so 2,000 spans per second cost 5.6 Mbit/s.
- Latency: no visible change.
- Coroot received exactly two spans per sampled request. Nothing was dropped.
Where the CPU goes
Coroot's eBPF profiler shows what the extra CPU time is spent on. The flame graph compares the app without the SDK (baseline) with the app tracing every request (comparison). Red frames take a bigger share of CPU time with tracing on, green frames a smaller one.
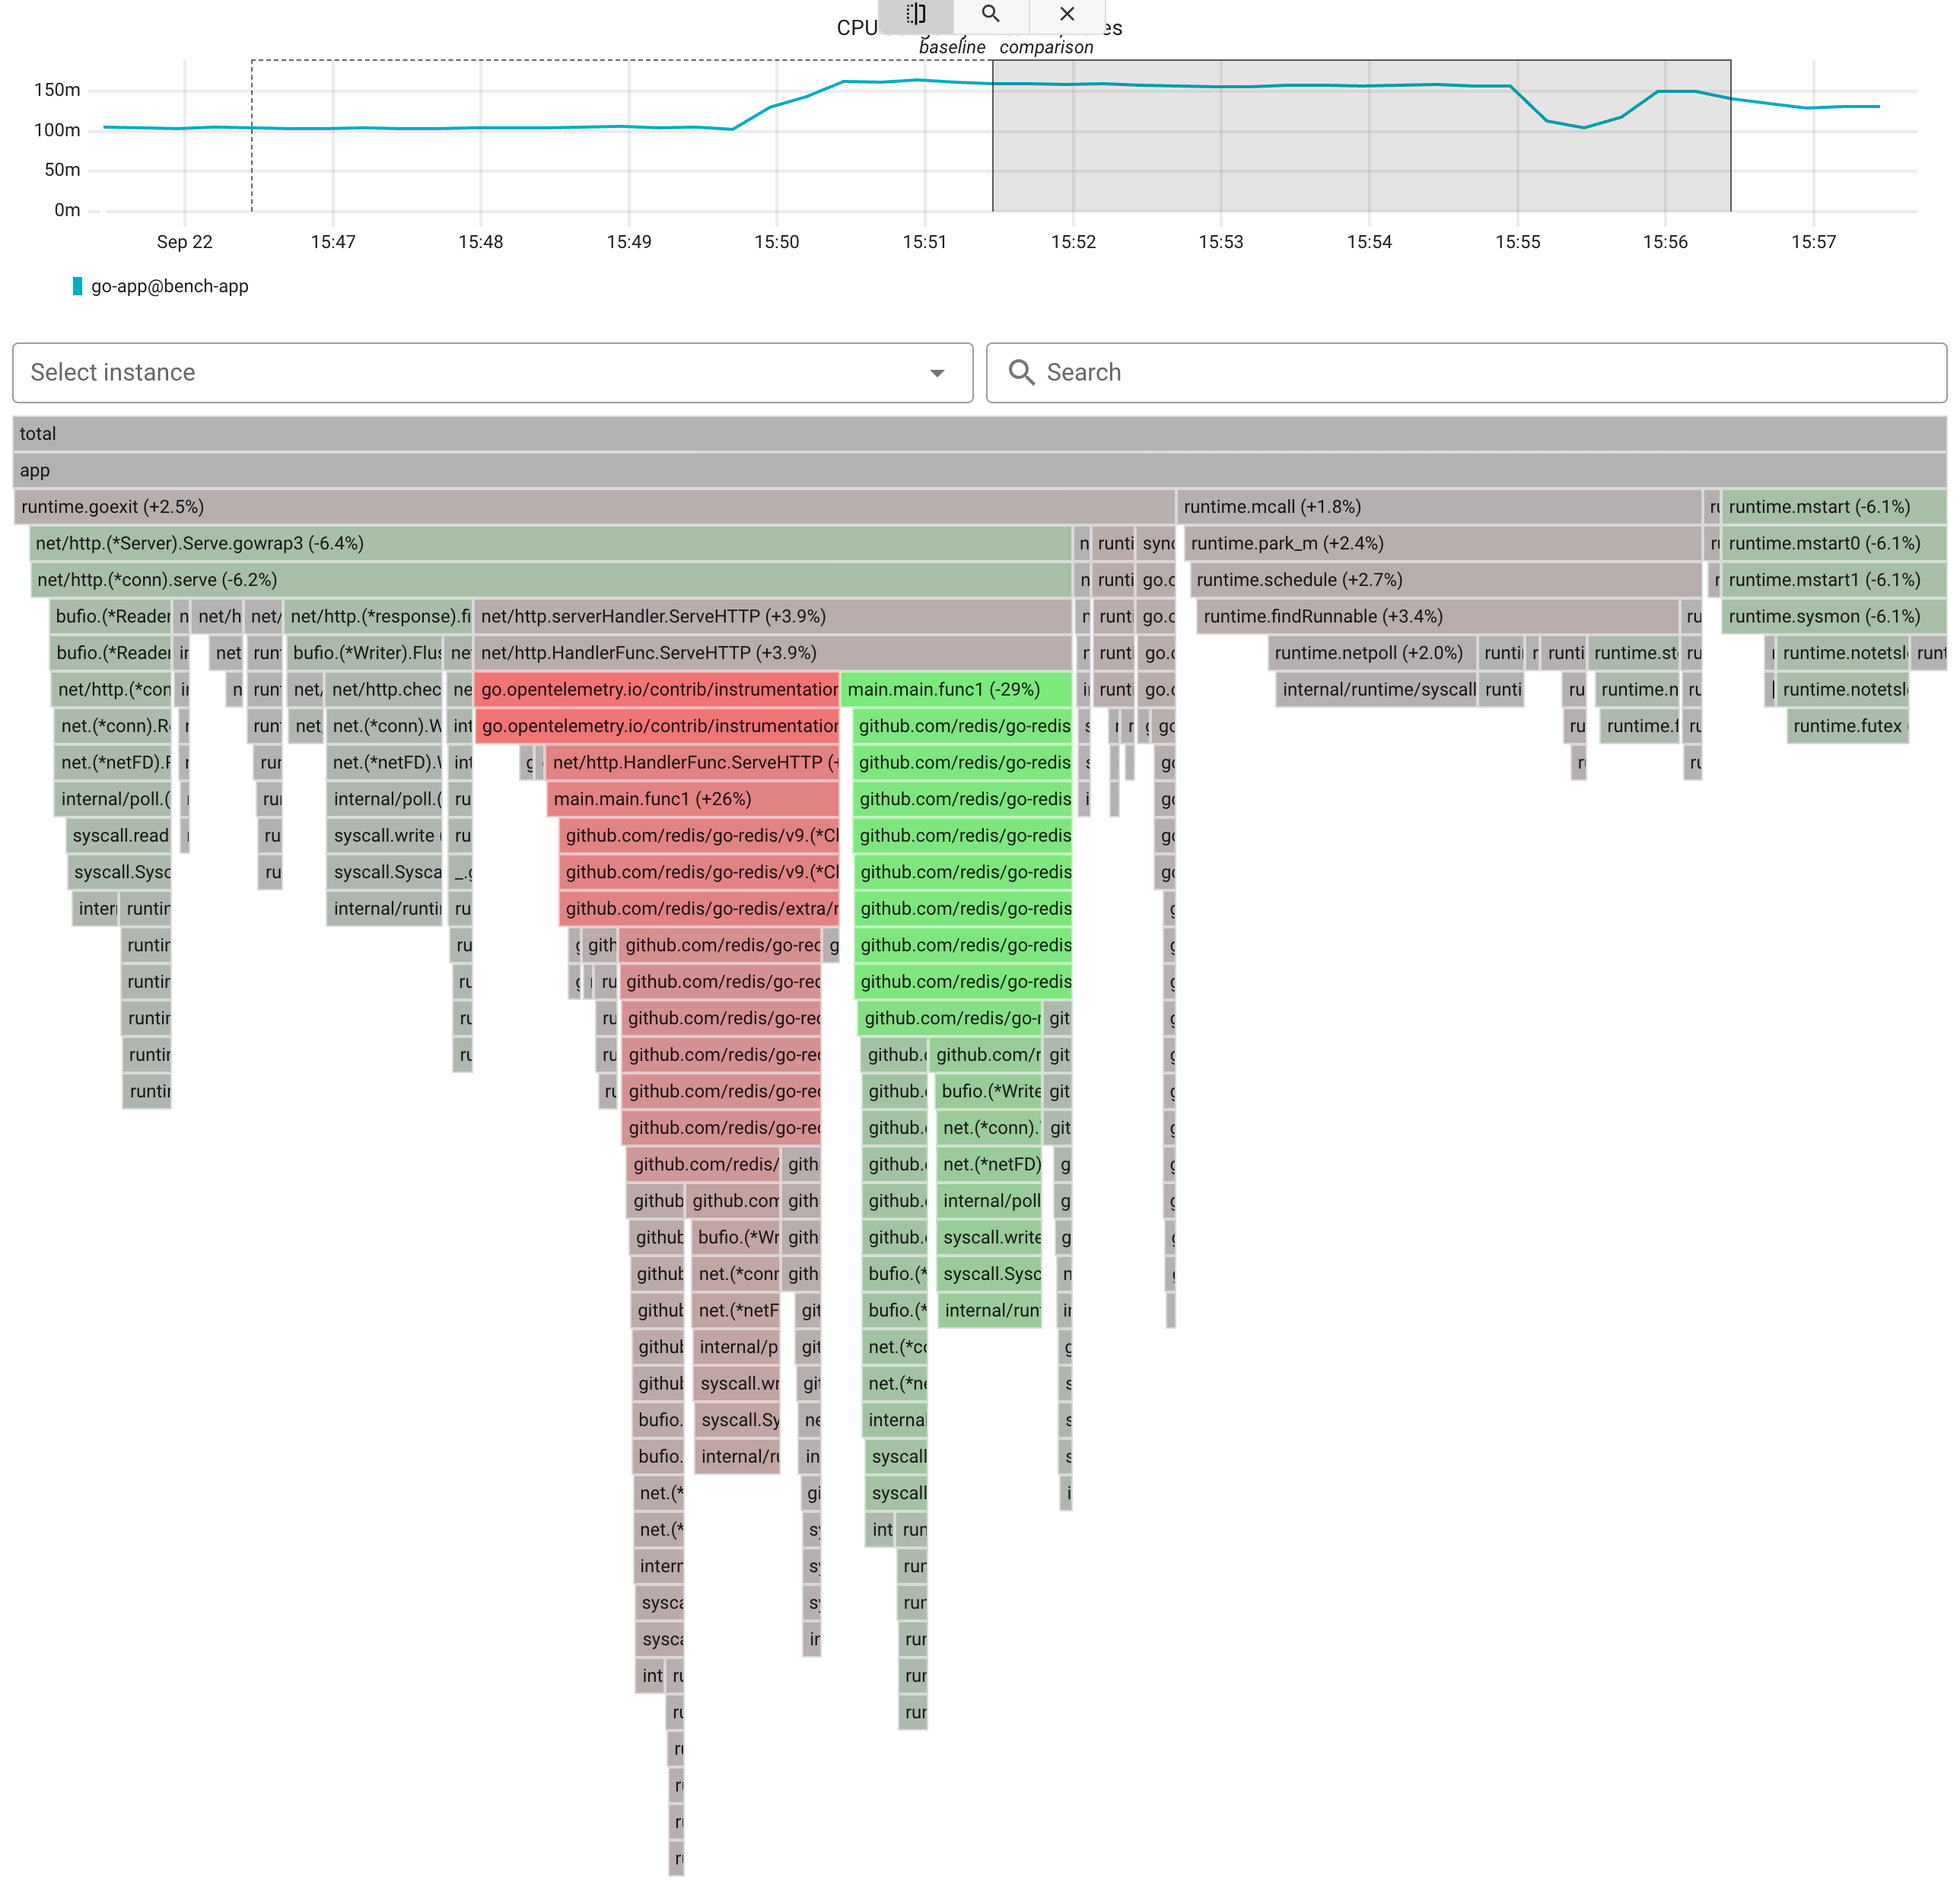
The handler now runs inside the otelhttp middleware, and every Valkey call goes through the redisotel hook. Both create spans and attributes,
hand them to the batch processor, which serializes and exports them, and all of that leaves more garbage for the collector.
The share of overhead depends on the load and the hardware: at 10,000 requests per second on another machine a similar app paid 35%.
Compile-time instrumentation
The app
The very same handler, with no OpenTelemetry imports at all. The instrumentation is added by otelc v1.1.0 at build time:
RUN go build -o /app .                 # the plain binary, used when tracing is off
RUN otelc pin && otelc go build -o /app-otel .   # the instrumented one
A small launcher runs /app-otel when ENABLE_OTEL is set and /app otherwise. The instrumented binary reads the standard OTEL_* variables for the exporter, the sampler and the service name.
Two things had to be done to get exactly two spans per request:
otelcexports metrics and logs by default and instruments the HTTP client too, which would trace the exporter's own requests. We setOTEL_METRICS_EXPORTER=none,OTEL_LOGS_EXPORTER=noneand left the HTTP client instrumentation out of the build.- The go-redis instrumentation traces the connection handshake (
HELLO,CLIENT SETINFO) of every new pool connection. With 100 connections that's 250 extra spans for the first 500 requests. A smallotelcrule drops the hooks from the handshake connection:
redis_no_handshake_spans:
  target: github.com/redis/go-redis/v9
  where: { func: newConn }
  do: [ { inject_code: { raw: "parentHooks = nil" } } ]
The instrumented binary is 3 times bigger than the plain one (25MB vs. 8MB): otelc links in every exporter and propagator so that they can be chosen at runtime.
Results
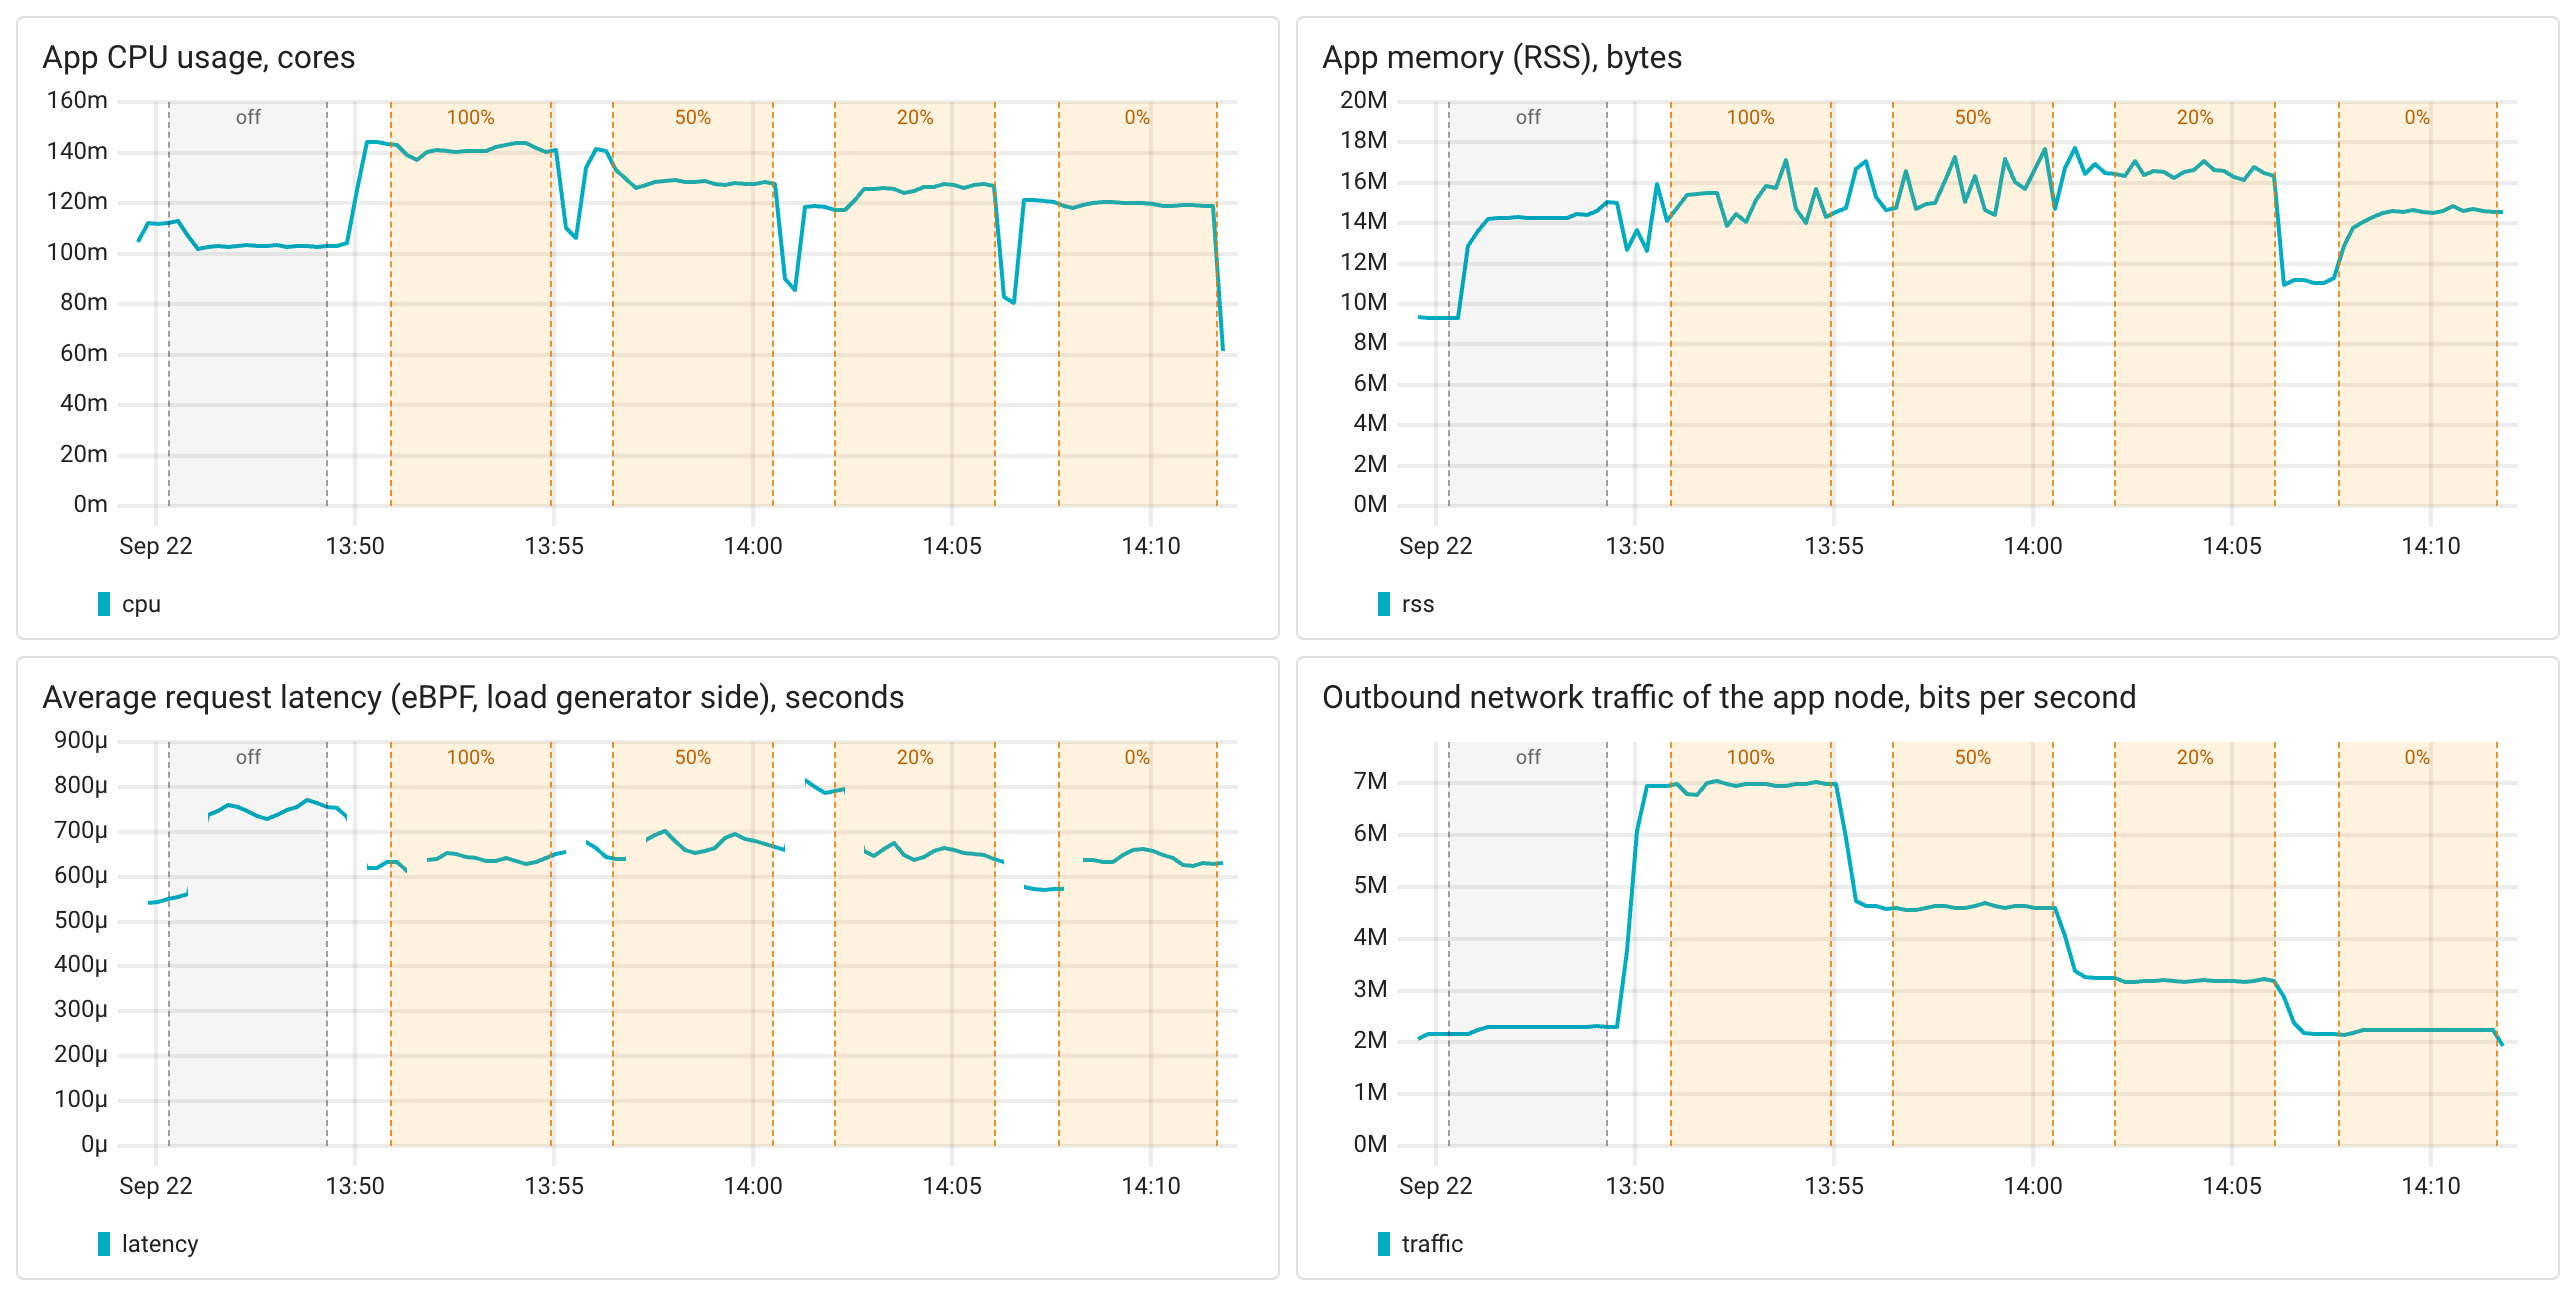
Each shaded area on the charts is a 4-minute measurement in one mode (the second of the two passes; the tables average both).
| Mode | off | 100% | 50% | 20% | 0% |
|---|---|---|---|---|---|
| Spans received by Coroot, per second | 0 | 1,992 | 996 | 398 | 0 |
| CPU usage, cores | 0.11 | 0.14 (+35%) | 0.13 (+22%) | 0.13 (+24%) | 0.12 (+13%) |
| Memory (RSS), MB | 12.7 | 15.5 | 15.9 | 15.7 | 14.7 |
| Trace export traffic, Mbit/s | - | 4.7 | 2.4 | 1.0 | 0 |
| Latency, p50, ms | 0.58 | 0.58 | 0.59 | 0.60 | 0.56 |
| Latency, p99, ms | 1.8 | 1.3 | 1.6 | 2.6 | 1.3 |
- CPU: tracing every request costs 0.04 CPU cores per 1,000 requests per second, +35% for this app, against +50% with the SDK wired by hand.
The compile-time hooks are a bit leaner than
otelhttpandredisotel: for example,redisotellooks up the caller of every command to addcode.*attributes, which the compile-time variant doesn't do. At 0% sampling it's +13%. - Memory: about 3MB.
- Network: about 300 bytes per span.
- Latency: no change.
- Nothing was dropped.
Takeaways
- Tracing a Go service costs about 0.05 CPU cores per 1,000 requests per second, a few megabytes of memory and about 350 bytes of traffic per span. Latency doesn't change.
- Compile-time instrumentation produces the same two spans with no code changes, and it's a little cheaper (+35% vs. +50% here). It needs some setup to keep the extra spans and signals it enables by default in check, and it triples the binary size.
- Sampling lowers the cost but doesn't remove it. Even at 0%, when not a single span is sent, the instrumentation adds 13-20% CPU. Wrapping the handlers, creating and propagating the context, and deciding whether to sample happen on every request. Sampling only skips recording, serializing and sending the spans.