OpenTelemetry for Python
Instrumenting a Python application with OpenTelemetry can provide valuable insights into the application's performance and behavior. OpenTelemetry is an open-source observability framework that enables the collection and exporting of telemetry data. This document covers the steps required to instrument a Python application with OpenTelemetry.
Auto-instrumentation
OpenTelemetry provides a Python agent that automatically detects and instruments the most popular application servers, clients, and frameworks. This means we don't even need to change the code of our app to instrument it.
Let's start with a simple web application.
- Django
- FastAPI
- Flask
A simple Django view handler:
def hello(request, name):
  return HttpResponse("Hello, {}!".format(name))
Install OpenTelemetry dependencies:
pip install opentelemetry-distro opentelemetry-exporter-otlp
opentelemetry-bootstrap -a install
Then, run the application with the instrumentation:
export DJANGO_SETTINGS_MODULE=otel_django.settings \
  OTEL_RESOURCE_ATTRIBUTES="service.name=django-app" \
  OTEL_EXPORTER_OTLP_TRACES_ENDPOINT="http://coroot.coroot:8080/v1/traces" \
  OTEL_EXPORTER_OTLP_TRACES_PROTOCOL="http/protobuf" \
&& opentelemetry-instrument --traces_exporter otlp --metrics_exporter none ./manage.py runserver --noreload 8000
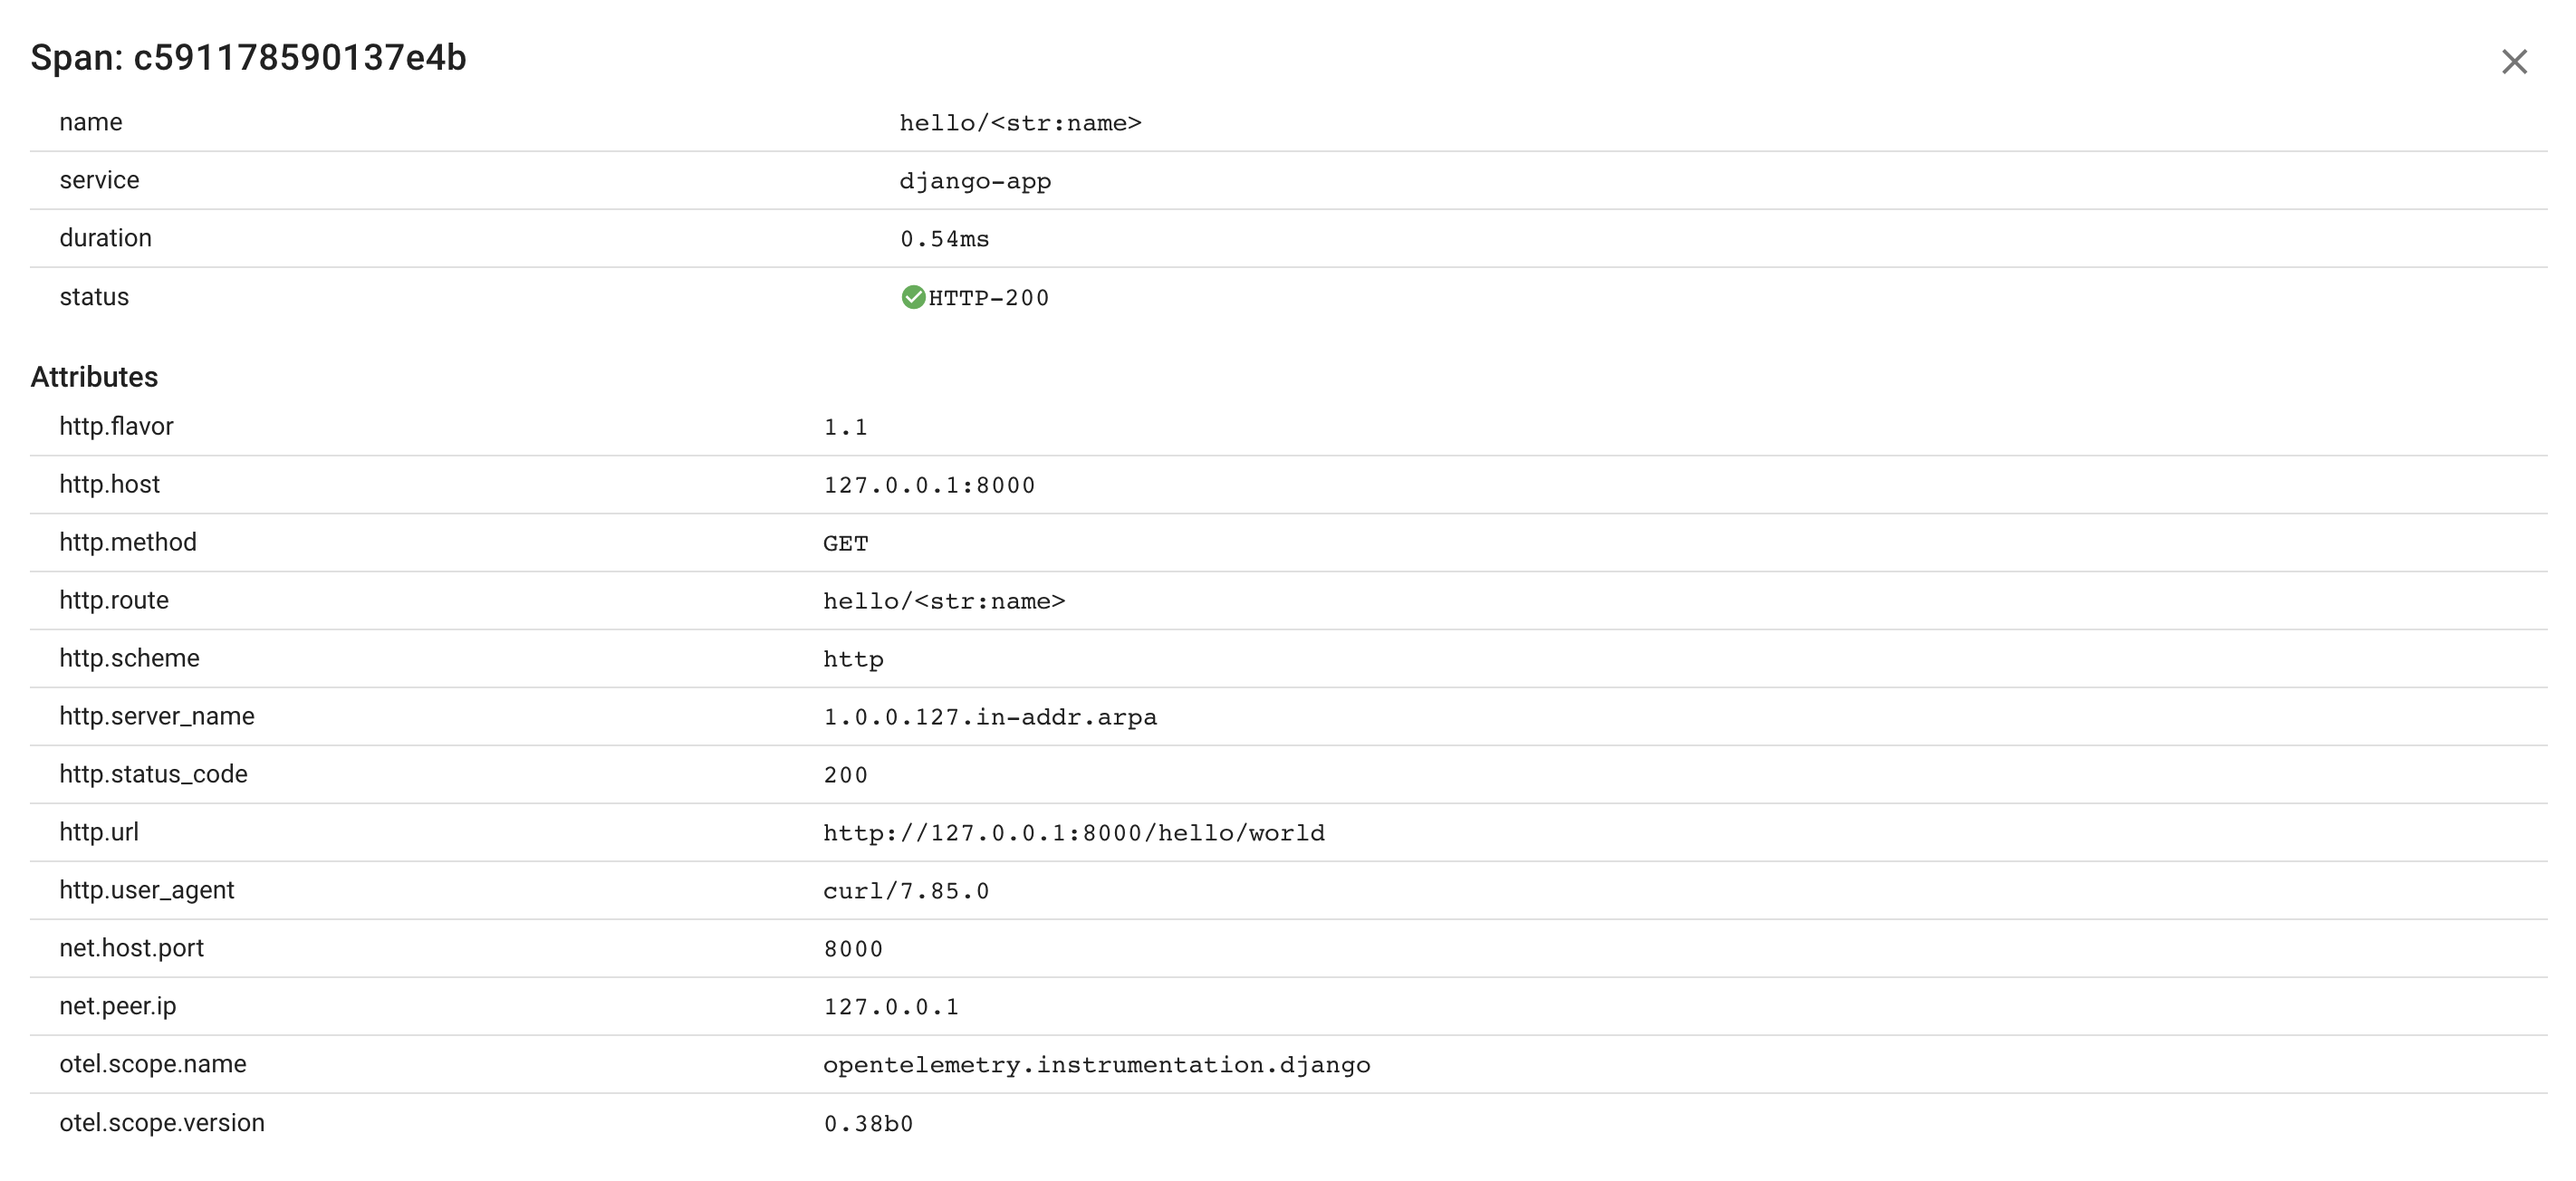
As a result, our app reports traces to the configured OpenTelemetry collector:

Span attributes:
A simple FastAPI app:
from fastapi import FastAPI

app = FastAPI()

@app.get("/hello/{name}")
async def say_hello(name: str):
  return {"message": f"Hello, {name}!"}
Install OpenTelemetry dependencies:
pip install opentelemetry-distro opentelemetry-exporter-otlp
opentelemetry-bootstrap -a install
Then, run the application with the instrumentation:
export DJANGO_SETTINGS_MODULE=otel_django.settings \
  OTEL_RESOURCE_ATTRIBUTES="service.name=django-app" \
  OTEL_EXPORTER_OTLP_TRACES_ENDPOINT="http://coroot.coroot:8080/v1/traces" \
  OTEL_EXPORTER_OTLP_TRACES_PROTOCOL="http/protobuf" \
&& opentelemetry-instrument --traces_exporter otlp --metrics_exporter none uvicorn main:app
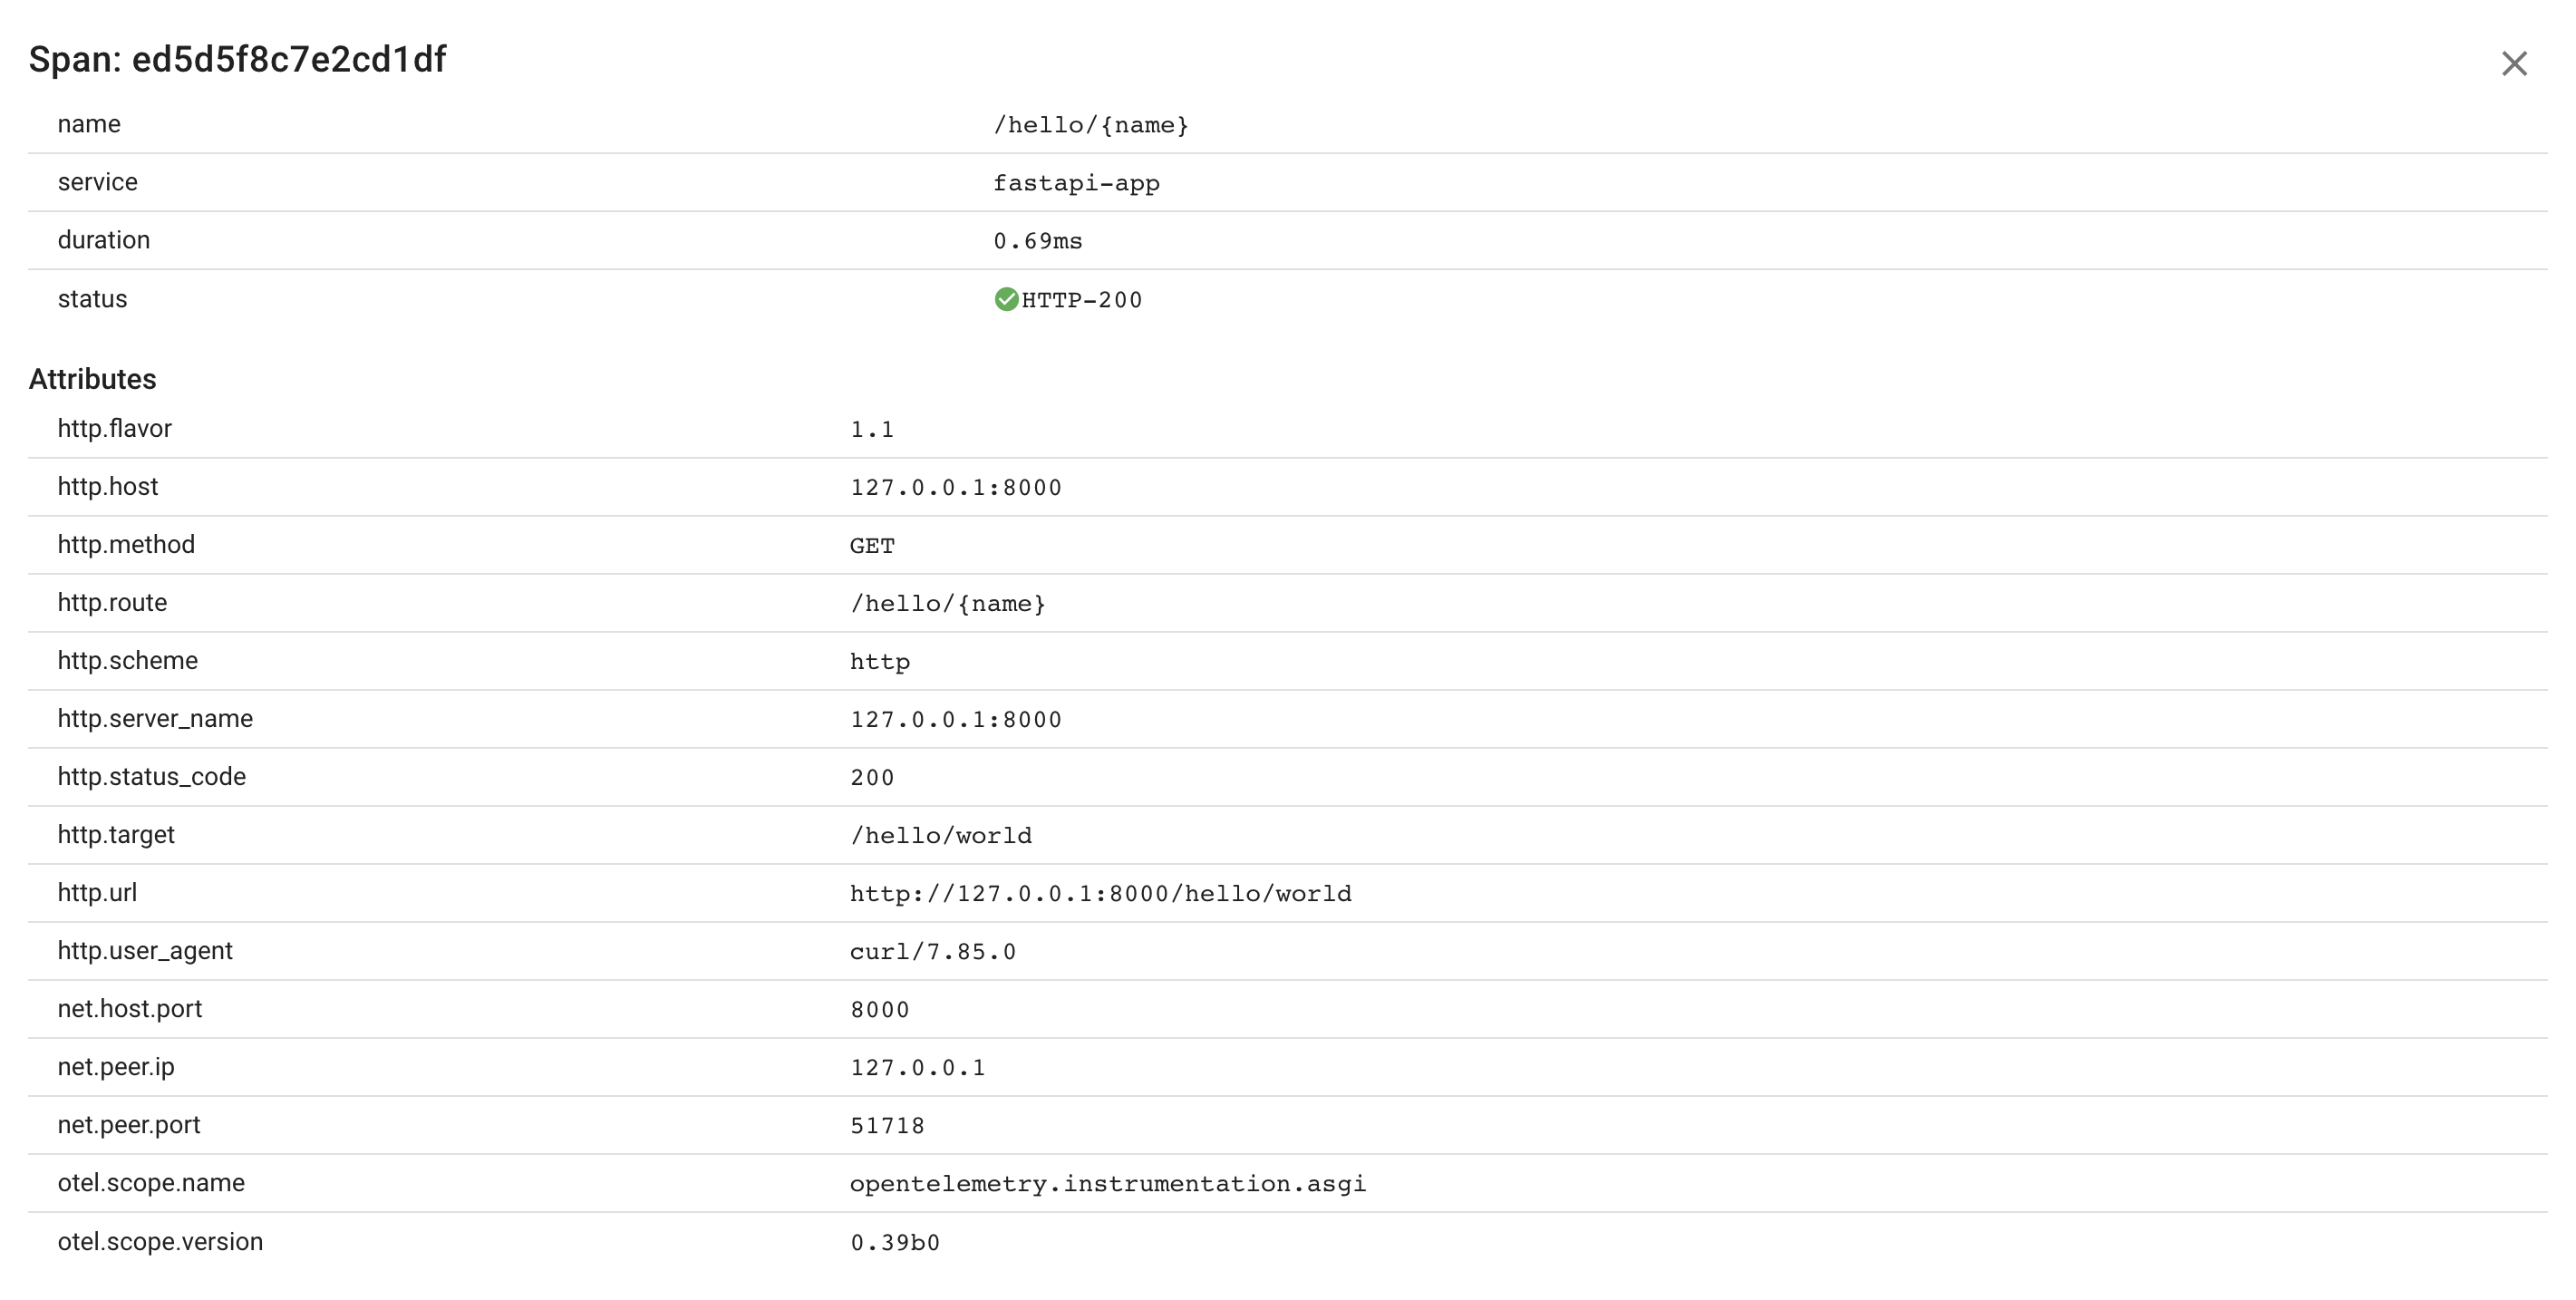
As a result, our app reports traces to the configured OpenTelemetry collector:

Span attributes:
A simple Flask app:
from flask import Flask

app = Flask(__name__)

@app.route('/hello/<name>')
def hello(name):
  return 'Hello, {}!'.format(name)

if __name__ == '__main__':
  app.run()
Install OpenTelemetry dependencies:
pip install opentelemetry-distro opentelemetry-exporter-otlp
opentelemetry-bootstrap -a install
Then, run the application with the instrumentation:
export DJANGO_SETTINGS_MODULE=otel_django.settings \
  OTEL_RESOURCE_ATTRIBUTES="service.name=django-app" \
  OTEL_EXPORTER_OTLP_TRACES_ENDPOINT="http://coroot.coroot:8080/v1/traces" \
  OTEL_EXPORTER_OTLP_TRACES_PROTOCOL="http/protobuf" \
&& opentelemetry-instrument --traces_exporter otlp --metrics_exporter none flask run
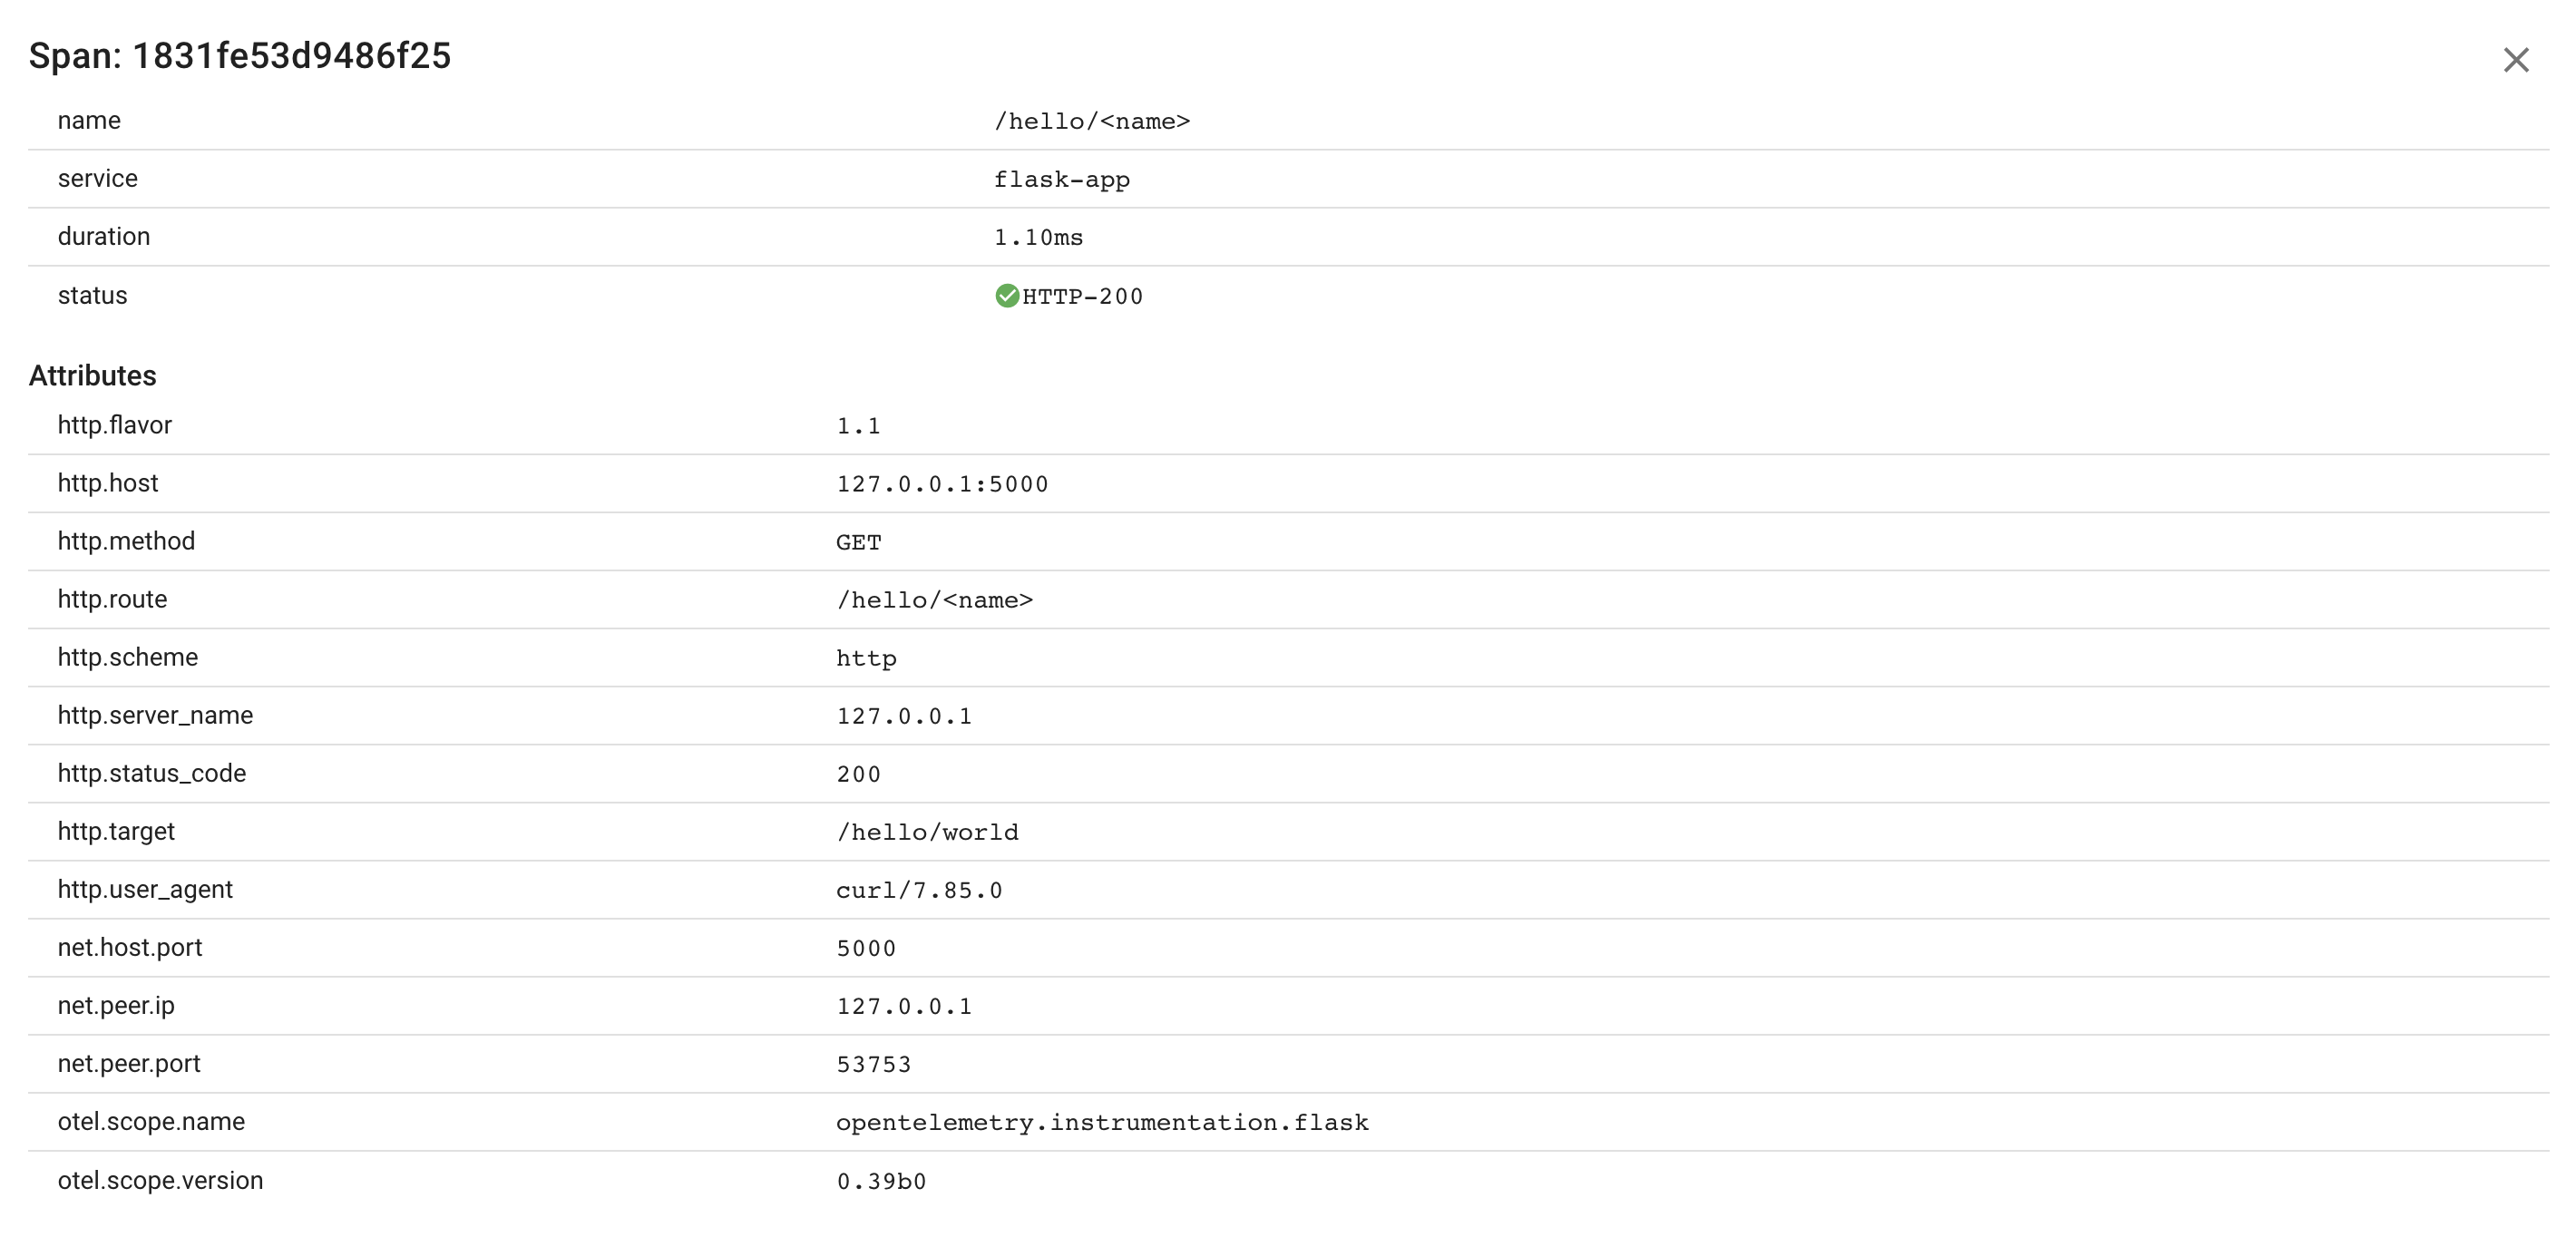
As a result, our app reports traces to the configured OpenTelemetry collector:

Span attributes:
Exceptions
Now, let's explore what happens when our app raises an exception.
def hello(request, name):
  raise Exception("Failure injection")
  return HttpResponse("Hello, {}!".format(name))

The server span captures the exception and includes the corresponding traceback for better analysis and debugging:
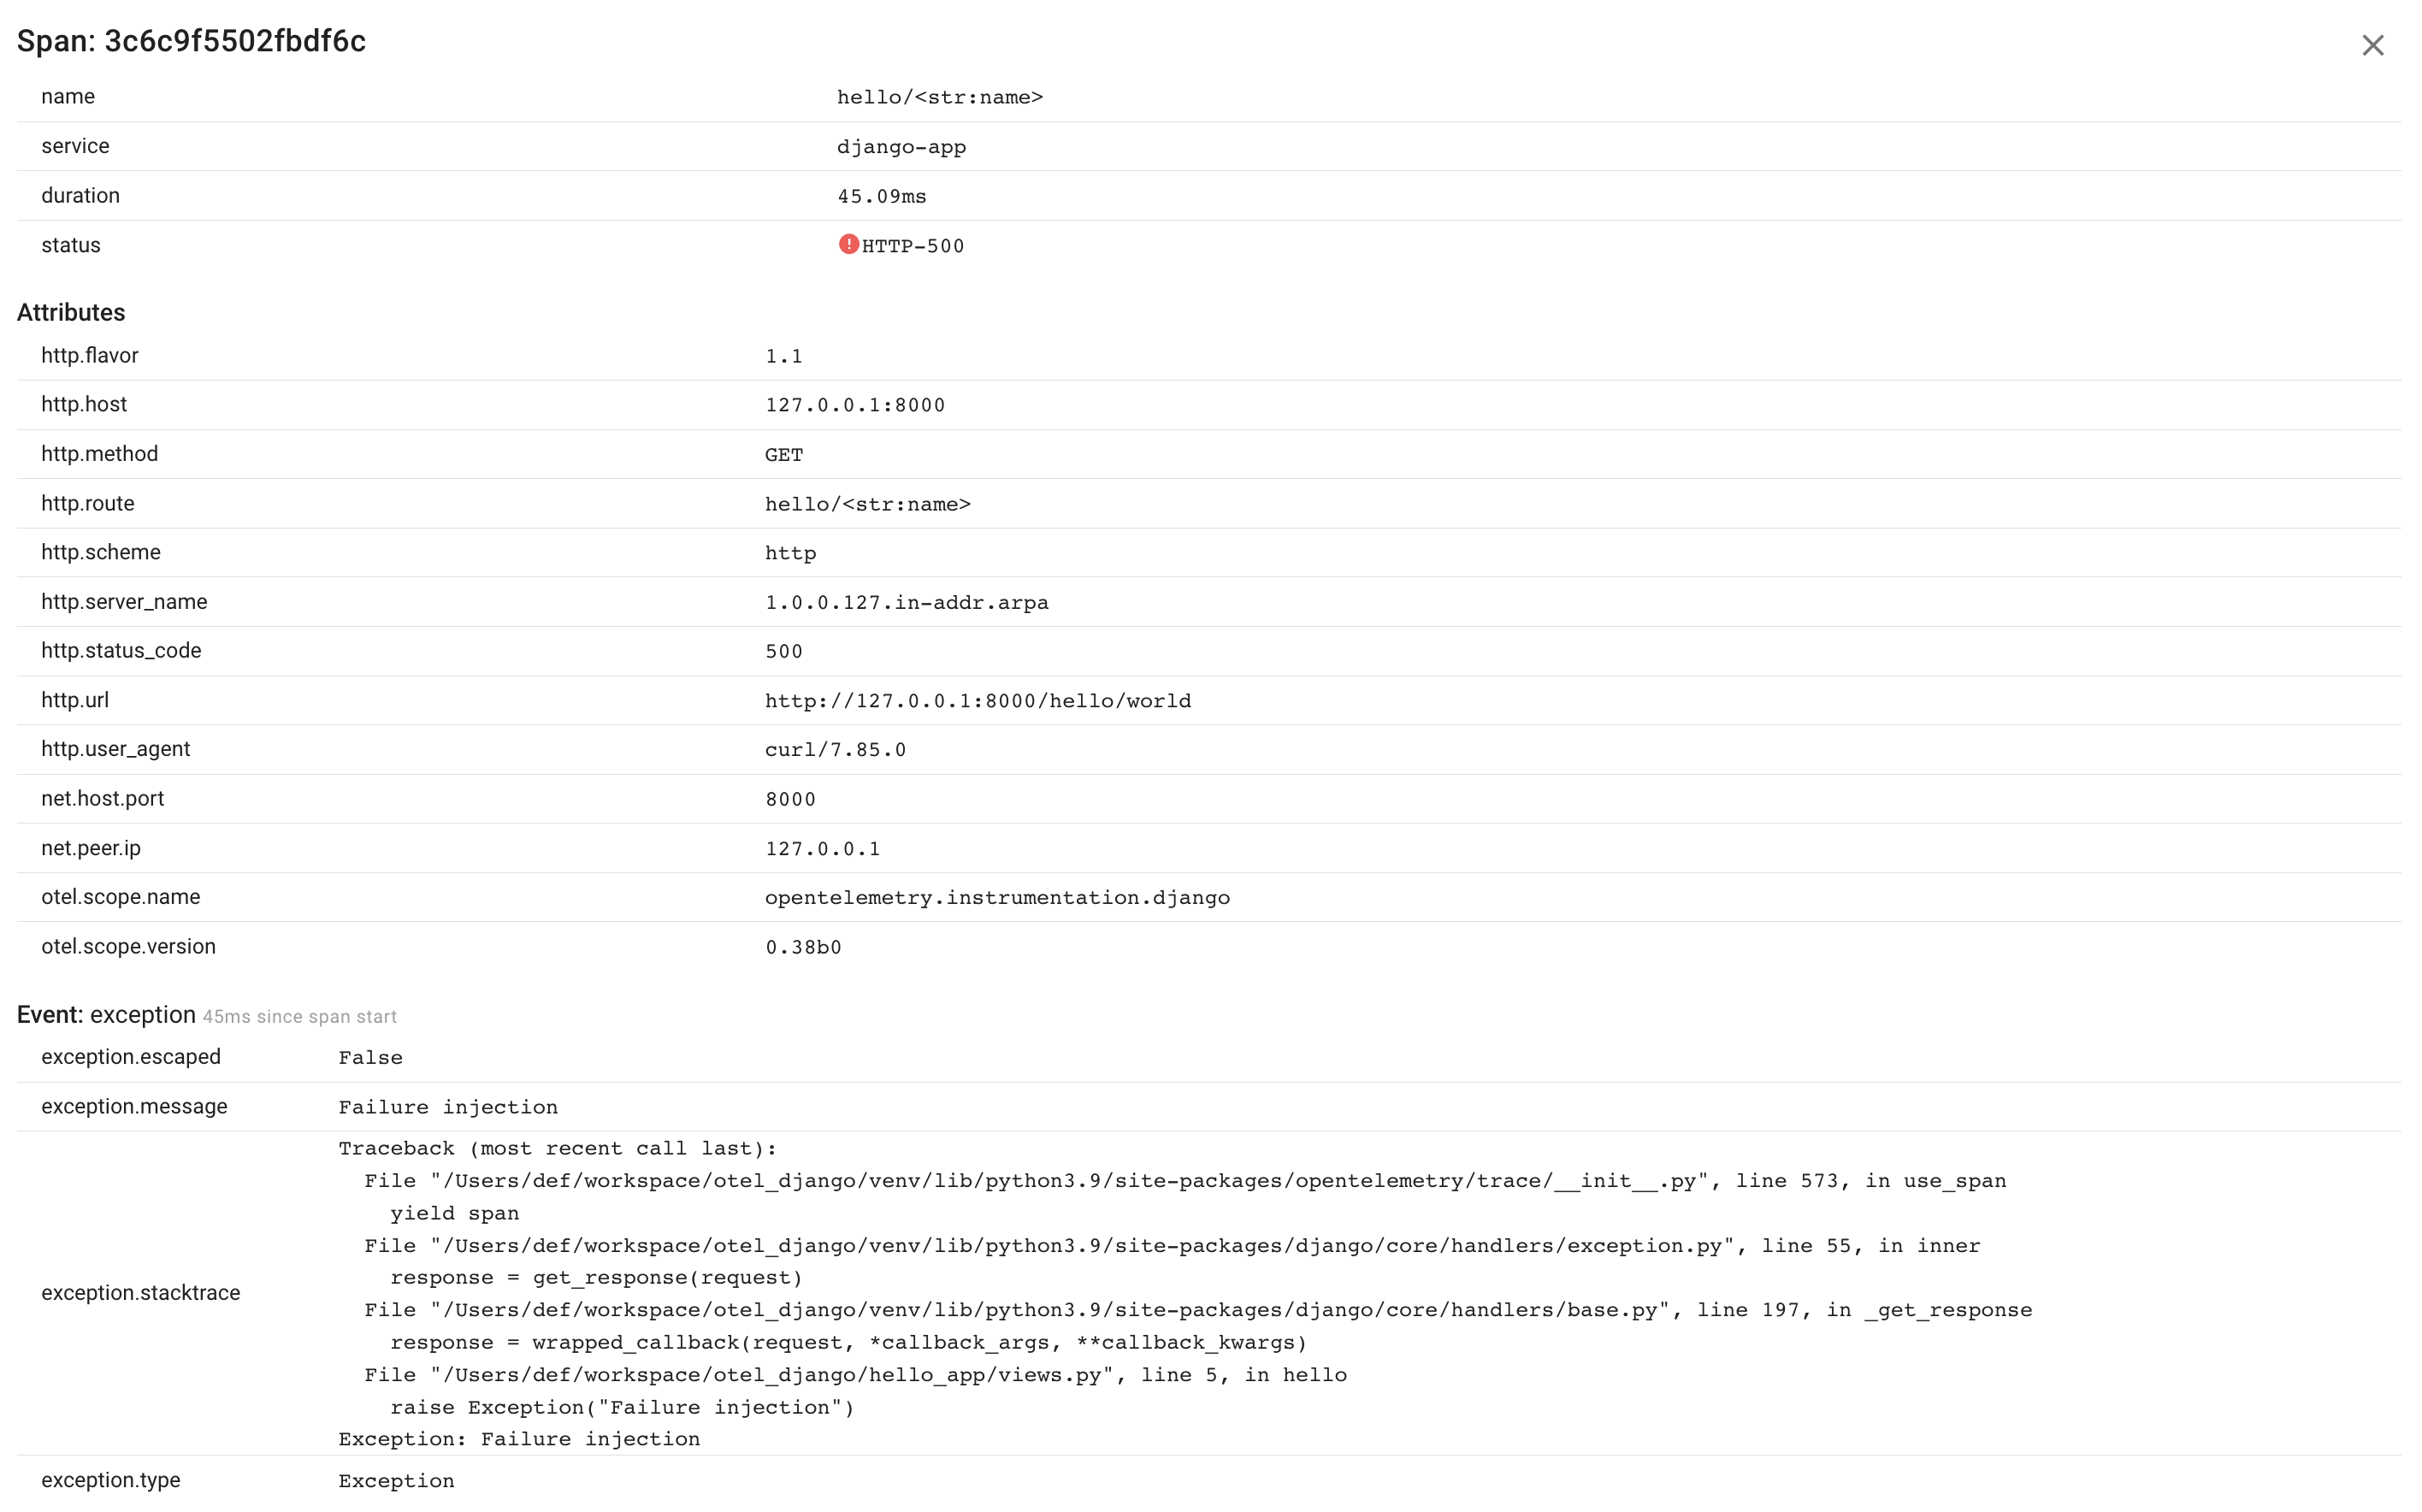
As you can see, we have easily identified the reason why this particular request resulted in an error.
Database calls
Now, let's add a database call to our app:
from django.http import HttpResponse
from hello_app.models import Person

def hello(request, id):
  p = Person.objects.get(id=id)
  return HttpResponse("Hello, {}!".format(p.name))
Once again, there is no need to add any additional instrumentation as the OTel Python agent automatically captures every database call.

Span attributes:

HTTP calls and context propagation
Next, instead of retrieving a user from the database, let's make an HTTP call to a service and retrieve a JSON response containing the desired information.
import requests
from django.http import HttpResponse

def hello(request, id):
  r = requests.get('http://127.0.0.1:8082/user/{}'.format(id))
  name = r.json()['name']
  return HttpResponse("Hello, {}!".format(name))

Client span attributes:

As you can see, the resulting trace includes a span reported by the user service. Both services are instrumented with OpenTelemetry. But how is the context of the current trace propagated between them? To gain a better understanding of context propagation, let's examine the request sent to the user service:
Host: 127.0.0.1
Connection: keep-alive
User-agent: python-requests/2.30.0
Accept: */*
Traceparent: 00-7d4ab2226954f6f712b8be0c067b21f6-b327da7466332edf-01
OpenTelemetry adds the Traceparent HTTP header on the client side, and dependency services read this header to propagate
the trace context. It has the following format:
Version-TraceID-ParentSpanID-TraceFlags
In our case, 7d4ab2226954f6f712b8be0c067b21f6 is the TraceID, and b327da7466332edf is the ParentSpanId.
Adding custom attributes and events to spans
If needed, you can retrieve the current span and set custom attributes or add events.
import requests
from django.http import HttpResponse
from opentelemetry import trace

def hello(request, id):
  span = trace.get_current_span()

  # set an attribute
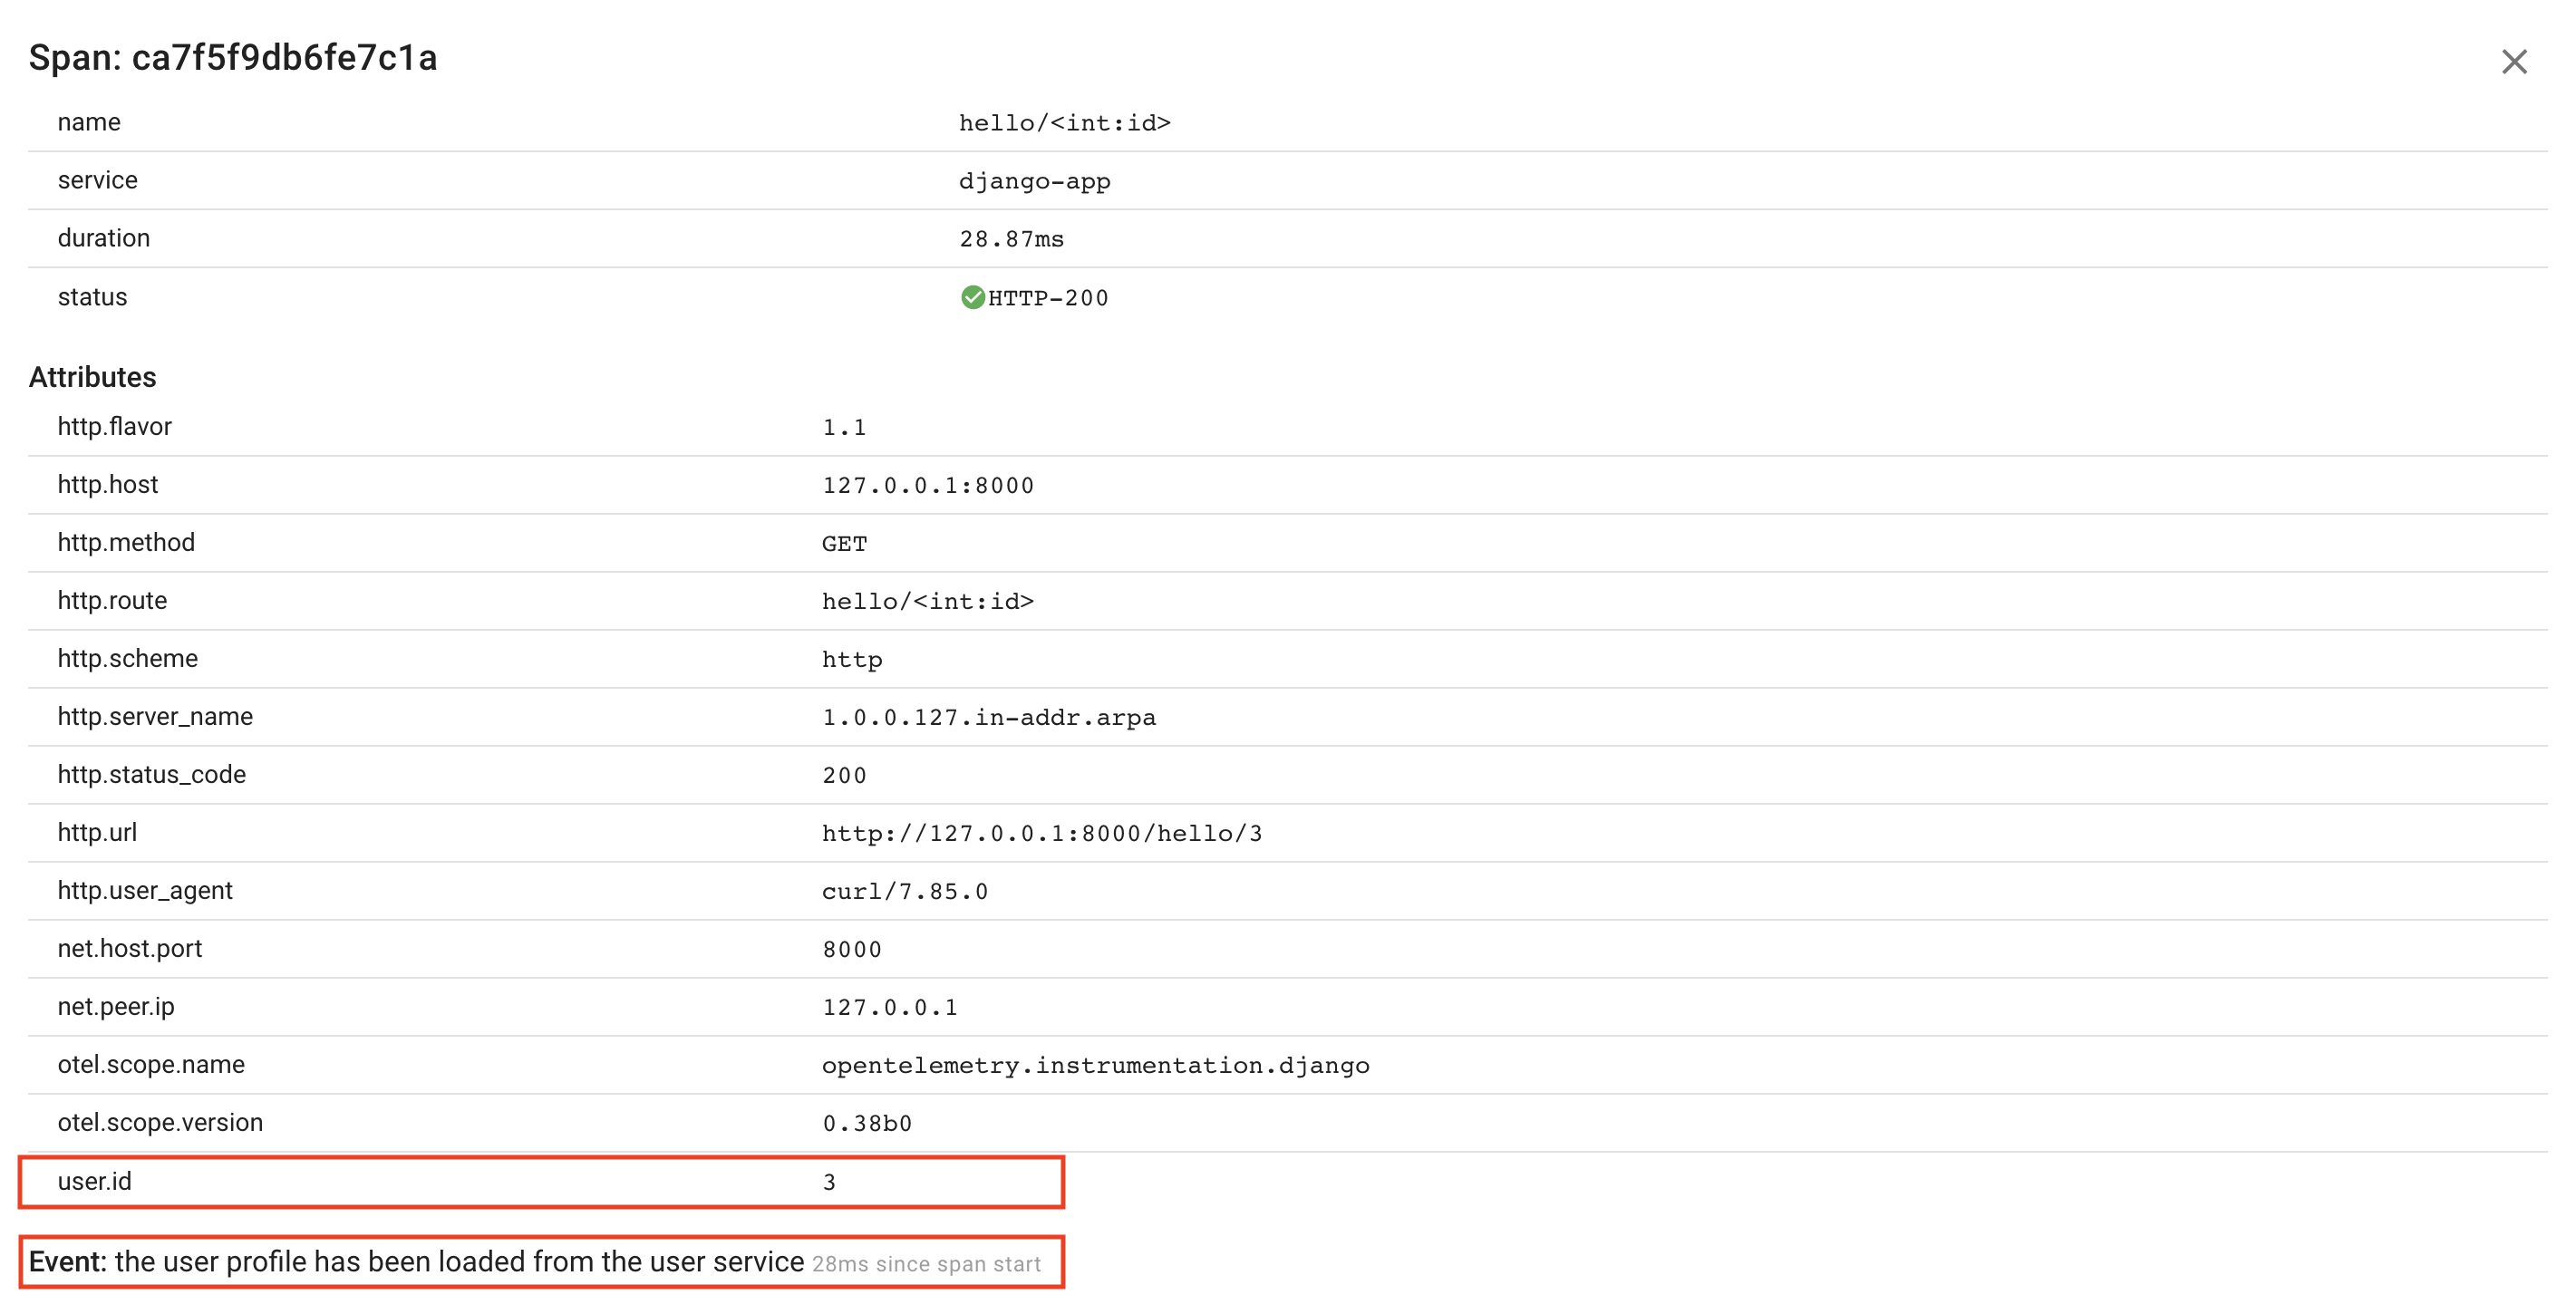
  span.set_attribute('user.id', id)

  r = requests.get('http://127.0.0.1:8082/user/{}'.format(id))

  # add an event
  span.add_event('the user profile has been loaded from the user service')

  name = r.json()['name']
  return HttpResponse("Hello, {}!".format(name))
The resulting span:
