 .NET
.NET
How we measured explains the setup. This page is about .NET.
The app
- .NET 10 (LTS), ASP.NET Core minimal API on Kestrel, StackExchange.Redis 3.3 with one multiplexed connection
- OpenTelemetry .NET SDK 1.19, set up in code:
OpenTelemetry.Instrumentation.AspNetCoremakes theSERVERspan,OpenTelemetry.Instrumentation.StackExchangeRedis(1.19.0-beta.1, there is no stable release yet) makes theCLIENTspan, and the OTLP exporter sends them
if (Environment.GetEnvironmentVariable("ENABLE_OTEL") is { Length: > 0 })
{
    builder.Services.AddOpenTelemetry().WithTracing(t => t
        .AddAspNetCoreInstrumentation()
        .AddRedisInstrumentation()
        .AddOtlpExporter());
}

var db = app.Services.GetRequiredService<IConnectionMultiplexer>().GetDatabase();
app.MapGet("/", async () => Results.Text((await db.StringIncrementAsync("counter")).ToString()));
Two things to know about this stack:
AddOtlpExporter()readsOTEL_EXPORTER_OTLP_ENDPOINTbut ignoresOTEL_EXPORTER_OTLP_TRACES_ENDPOINT, and it defaults to gRPC. We had to set the endpoint andOTEL_EXPORTER_OTLP_PROTOCOL=http/protobufexplicitly.- The Redis instrumentation doesn't make spans while the request runs. It collects StackExchange.Redis profiling sessions and turns them into
Activityobjects on a background thread every 10 seconds (FlushInterval). At 1,000 requests per second that's 10,000 spans landing on the batch processor at once, more than its default queue holds (2,048). So the SDK dropped most of the Redis spans ("dropped due to buffer full"): Coroot got 1,238 spans per second instead of 2,000. We kept the defaults on purpose, because that's what you get out of the box. In production you'd raiseOTEL_BSP_MAX_QUEUE_SIZEor shortenFlushInterval.
Results
Each shaded area on the charts is a 4-minute measurement in one mode (the second of the two passes; the tables average both).
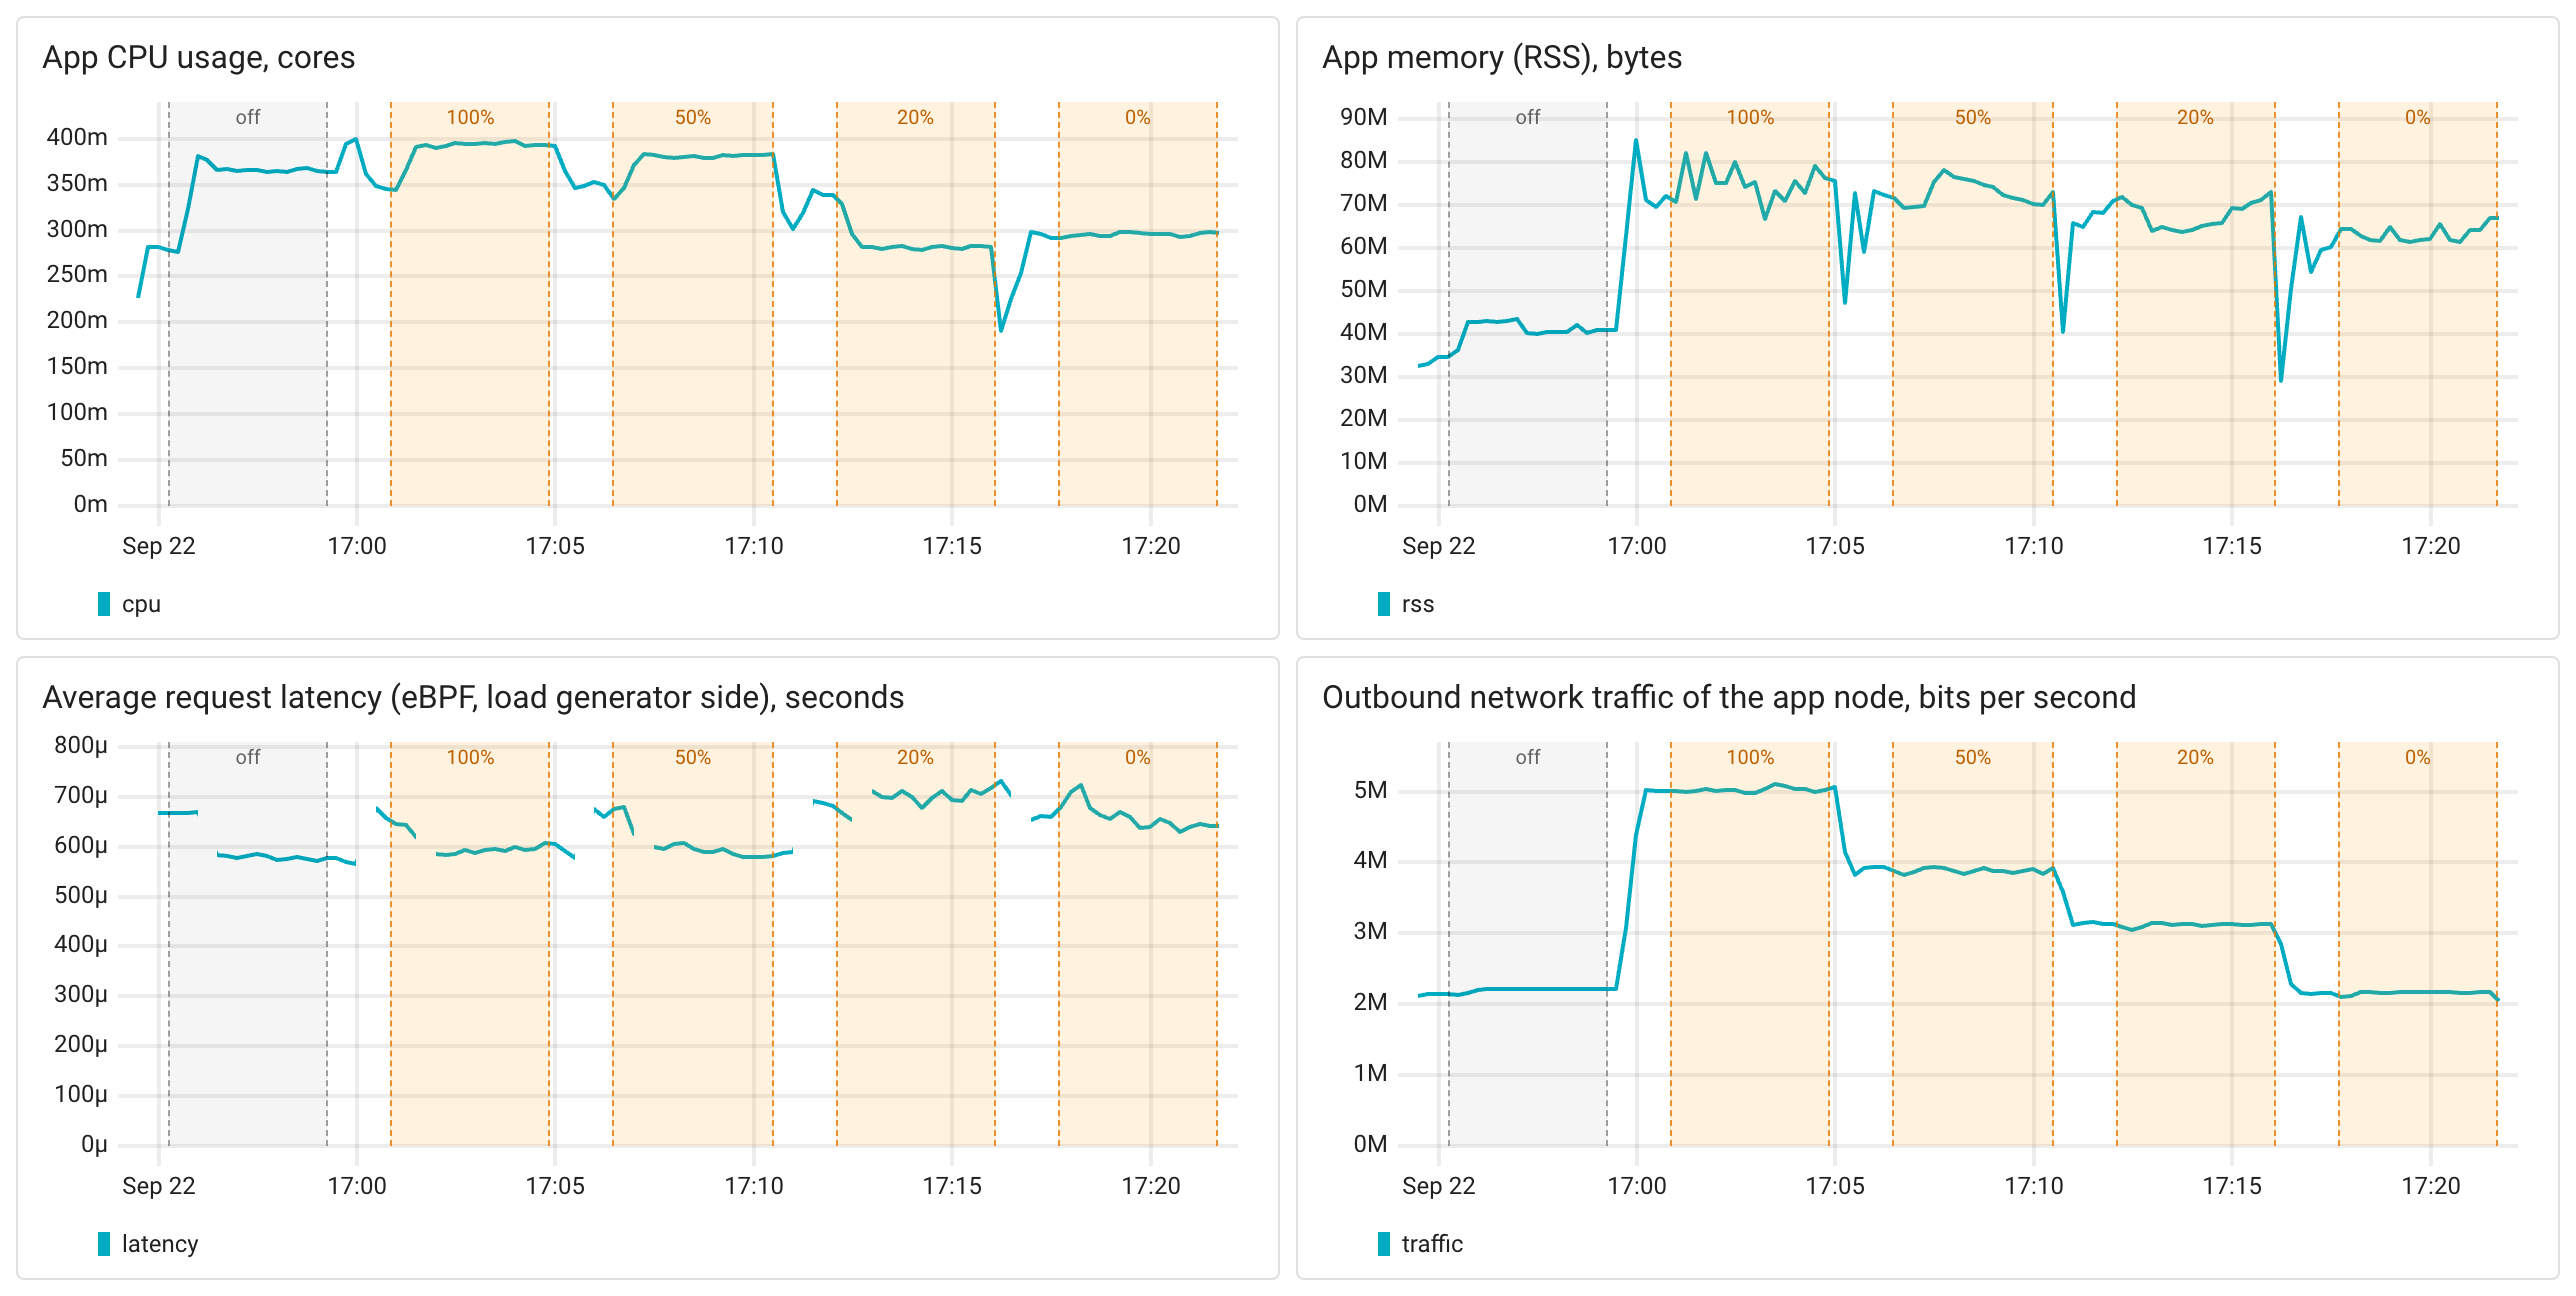
| Mode | off | 100% | 50% | 20% | 0% |
|---|---|---|---|---|---|
| Spans received by Coroot, per second | 0 | 1,238 | 727 | 396 | 0 |
| CPU usage, cores | 0.35 | 0.34 (-2%) | 0.38 (+11%) | 0.34 (-3%) | 0.29 (-17%) |
| Memory (RSS), MB | 41 | 75 (+86%) | 73 (+80%) | 67 (+65%) | 64 (+57%) |
| Trace export traffic, Mbit/s | - | 2.8 | 1.7 | 0.9 | 0 |
| Latency, p50, ms | 0.58 | 0.61 | 0.57 | 0.60 | 0.62 |
| Latency, p99, ms | 1.3 | 1.5 | 1.1 | 1.4 | 1.5 |
- CPU: we couldn't measure it. The differences between modes are smaller than the noise: two runs of the same mode differ by up to 0.1 cores, and the 0% run even came out below the baseline.
The reason is the baseline itself: a mostly idle .NET process spends most of its CPU time in
sched_yield, its thread pool spinning while it waits for work, and that spinning varies from run to run more than tracing costs. A tracing cost in the order of the Go one (0.05 cores) simply disappears in it. - Memory: the SDK adds 25-35MB.
- Network: about 280 bytes per span.
- Latency: no change.
- Dropped spans: Coroot received 1,238 spans per second instead of 2,000 with every request traced, and 727 instead of 1,000 at 50%. See above for why.
Takeaways
- At 1,000 requests per second, the CPU cost of tracing an ASP.NET Core service is too small to see next to the runtime's own background activity. The memory cost is 25-35MB.
- With the default settings, the Redis instrumentation delivers spans in 10-second bursts, and the batch processor silently drops some of them under load.
If you use it, watch the SDK's self-diagnostics for "dropped due to buffer full" and raise
OTEL_BSP_MAX_QUEUE_SIZE. - Sampling doesn't remove the instrumentation cost: at 0% the process still uses 57% more memory than without the SDK.
Looking for 24/7 support from the Coroot team? Subscribe to Coroot Enterprise:Start free trial