OpenTelemetry for Java
Instrumenting a Java application with OpenTelemetry can provide valuable insights into the application's performance and behavior. OpenTelemetry is an open-source observability framework that enables the collection and exporting of telemetry data. This document covers the steps required to instrument a Java application with OpenTelemetry.
Automatic instrumentation
Let's start with a simple Spring Boot web application.
@SpringBootApplication
@RestController
public class DemoApplication {
  public static void main(String[] args) {
    SpringApplication.run(DemoApplication.class, args);
  }

  @GetMapping("/hello/{name}")
  public String hello(@PathVariable(value = "name") String name) {
    return String.format("Hello, %s!", name);
  }
}
OpenTelemetry instrumentation generates detailed spans that describe the handling of inbound HTTP requests. These spans will provide insight into the entire lifecycle of each request, from the moment it arrives at the server to the moment it is sent back to the client.
OpenTelemetry provides a Java agent that automatically detects and instruments the most popular application servers, clients, and frameworks. This means we don't even need to change the code of our app to instrument it.
# download the latest version of the agent
wget https://github.com/open-telemetry/opentelemetry-java-instrumentation/releases/latest/download/opentelemetry-javaagent.jar
Then, run the application with the instrumentation:
export \
  OTEL_SERVICE_NAME="spring-demo" \
  OTEL_EXPORTER_OTLP_TRACES_ENDPOINT="http://coroot.coroot:8080/v1/traces" \
  OTEL_EXPORTER_OTLP_TRACES_PROTOCOL="http/protobuf" \
  OTEL_LOGS_EXPORTER="none" \
  OTEL_METRICS_EXPORTER="none" \
&& java -javaagent:./opentelemetry-javaagent.jar -jar build/libs/demo-0.0.1-SNAPSHOT.jar
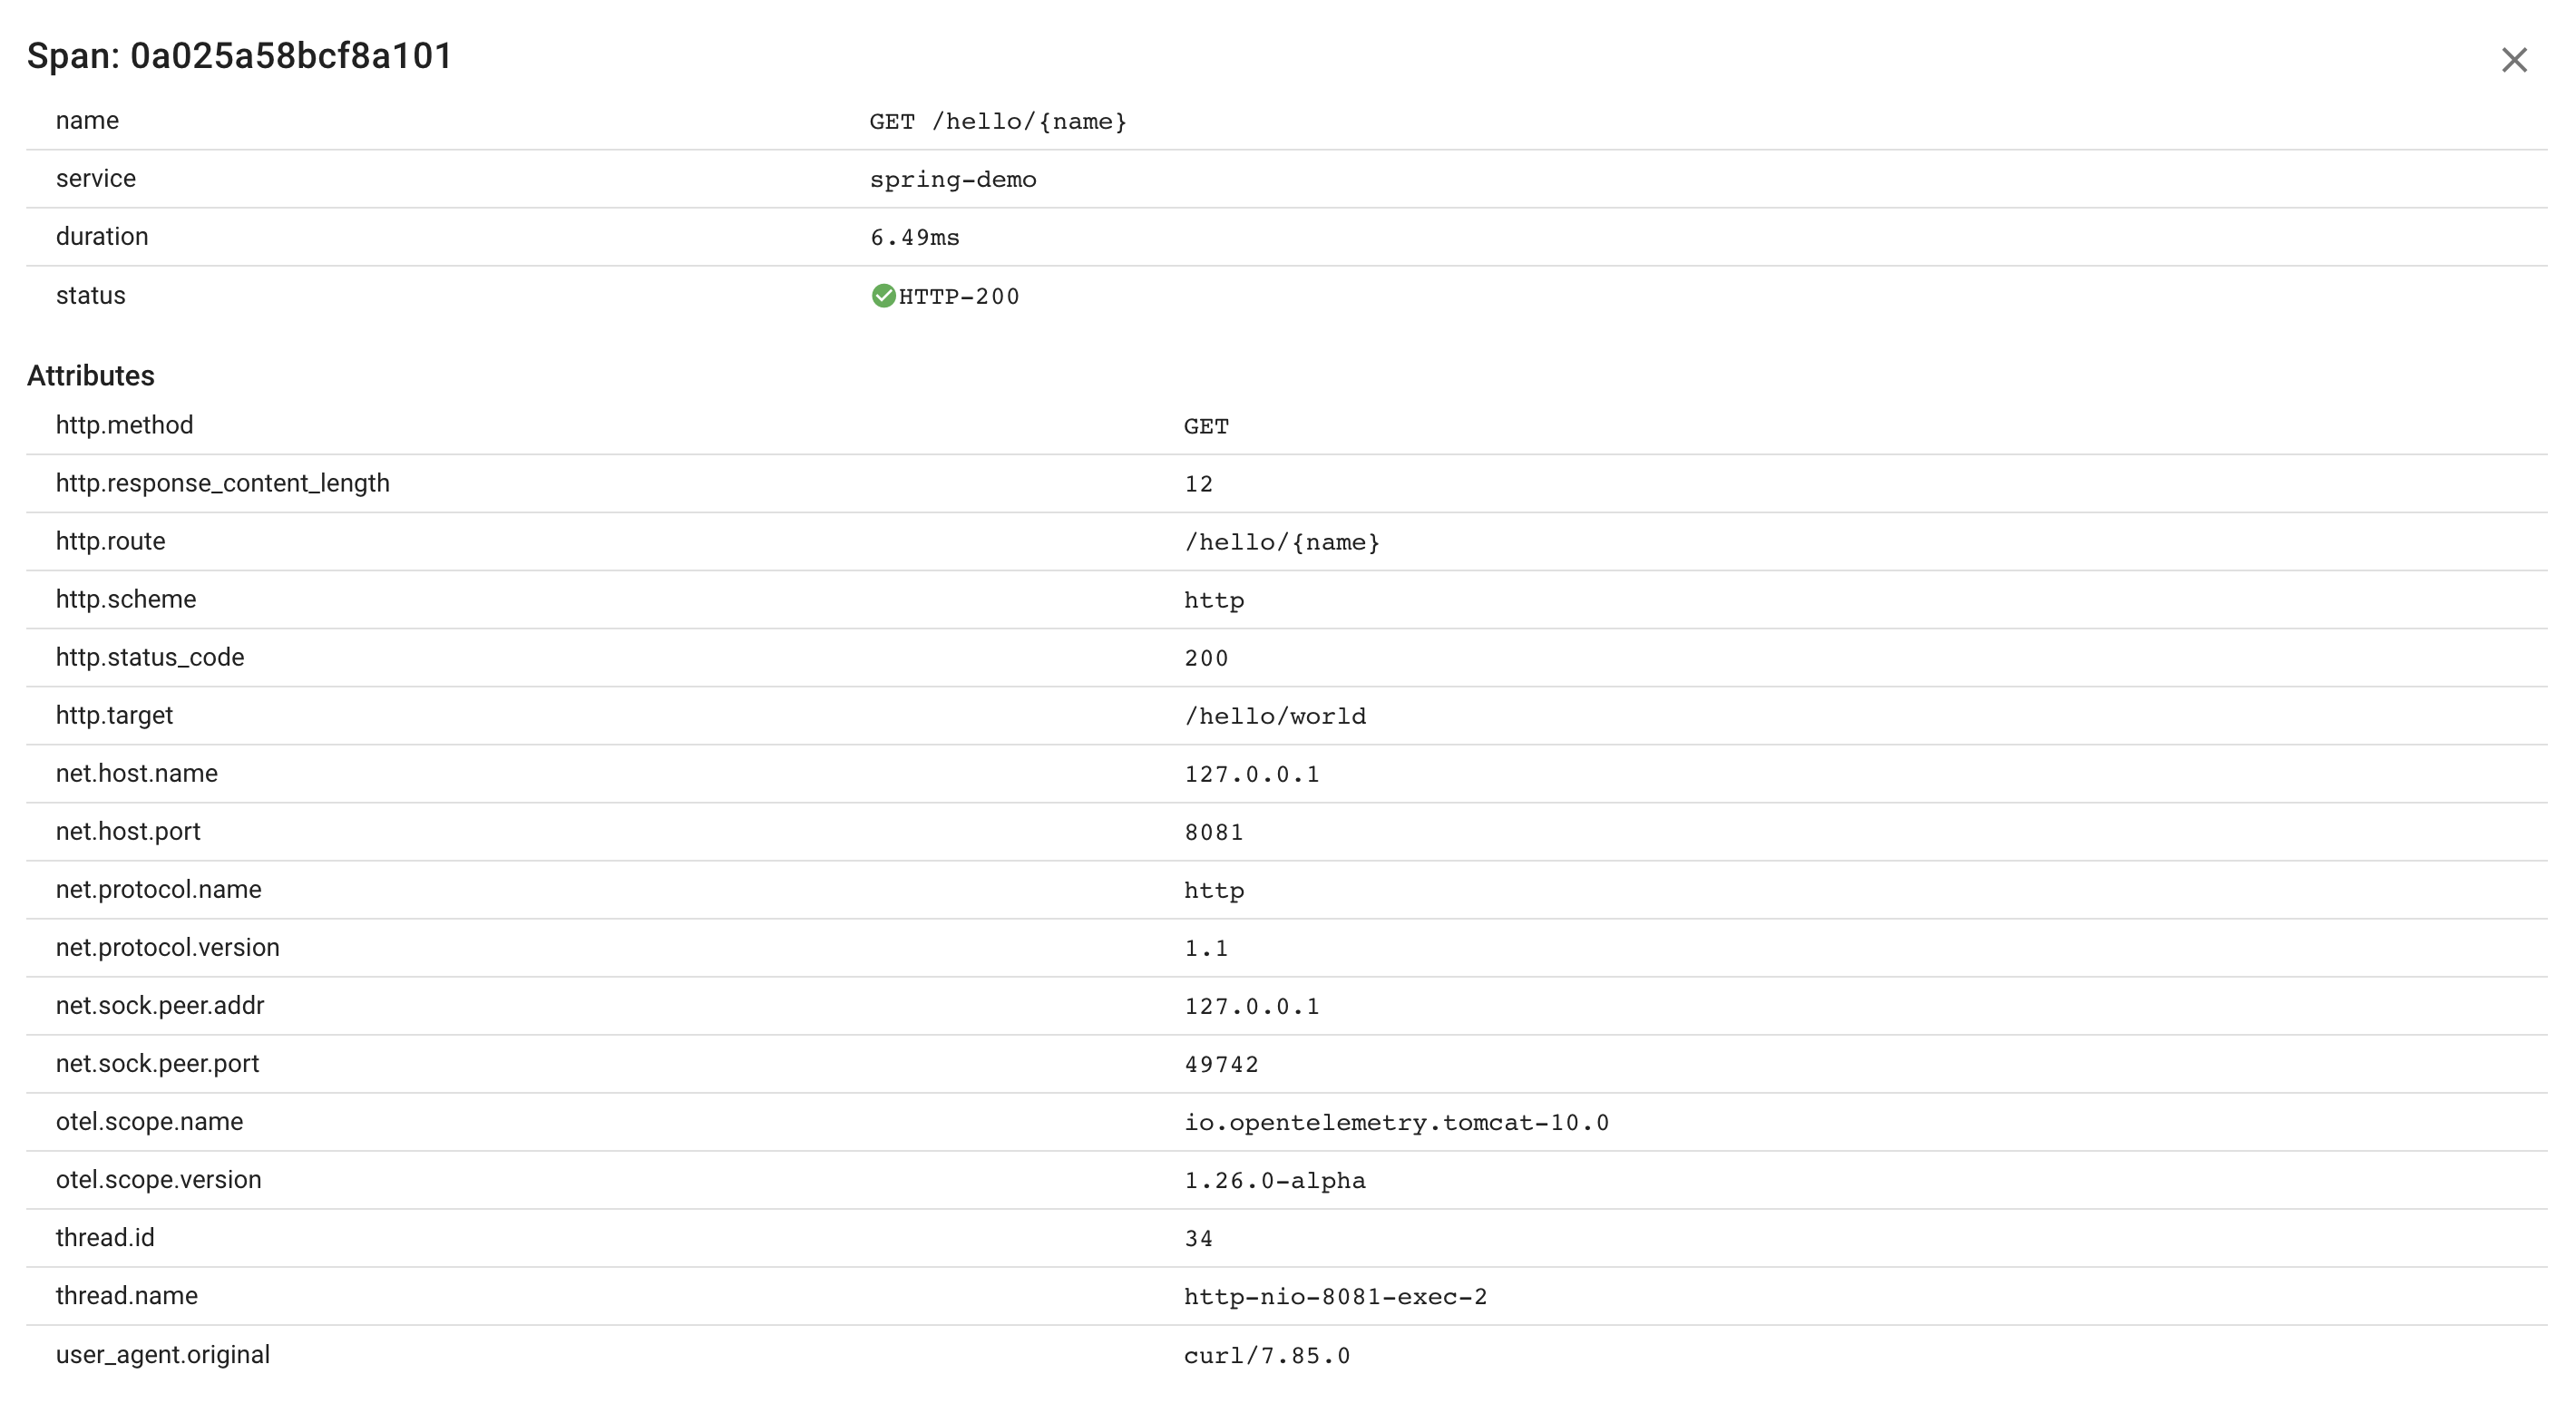
As a result, our app reports traces to the configured OpenTelemetry collector:

Each server span contains all the details related to a given request:

Exceptions
Now, let's explore what happens when our app throws an exception.
@SpringBootApplication
@RestController
public class DemoApplication {
  public static void main(String[] args) {
    SpringApplication.run(DemoApplication.class, args);
  }

  @GetMapping("/hello/{name}")
  public String hello(@PathVariable(value = "name") String name) {
    throw new ResponseStatusException(HttpStatus.INTERNAL_SERVER_ERROR, "Failure injection: HTTP-500");
  }
}
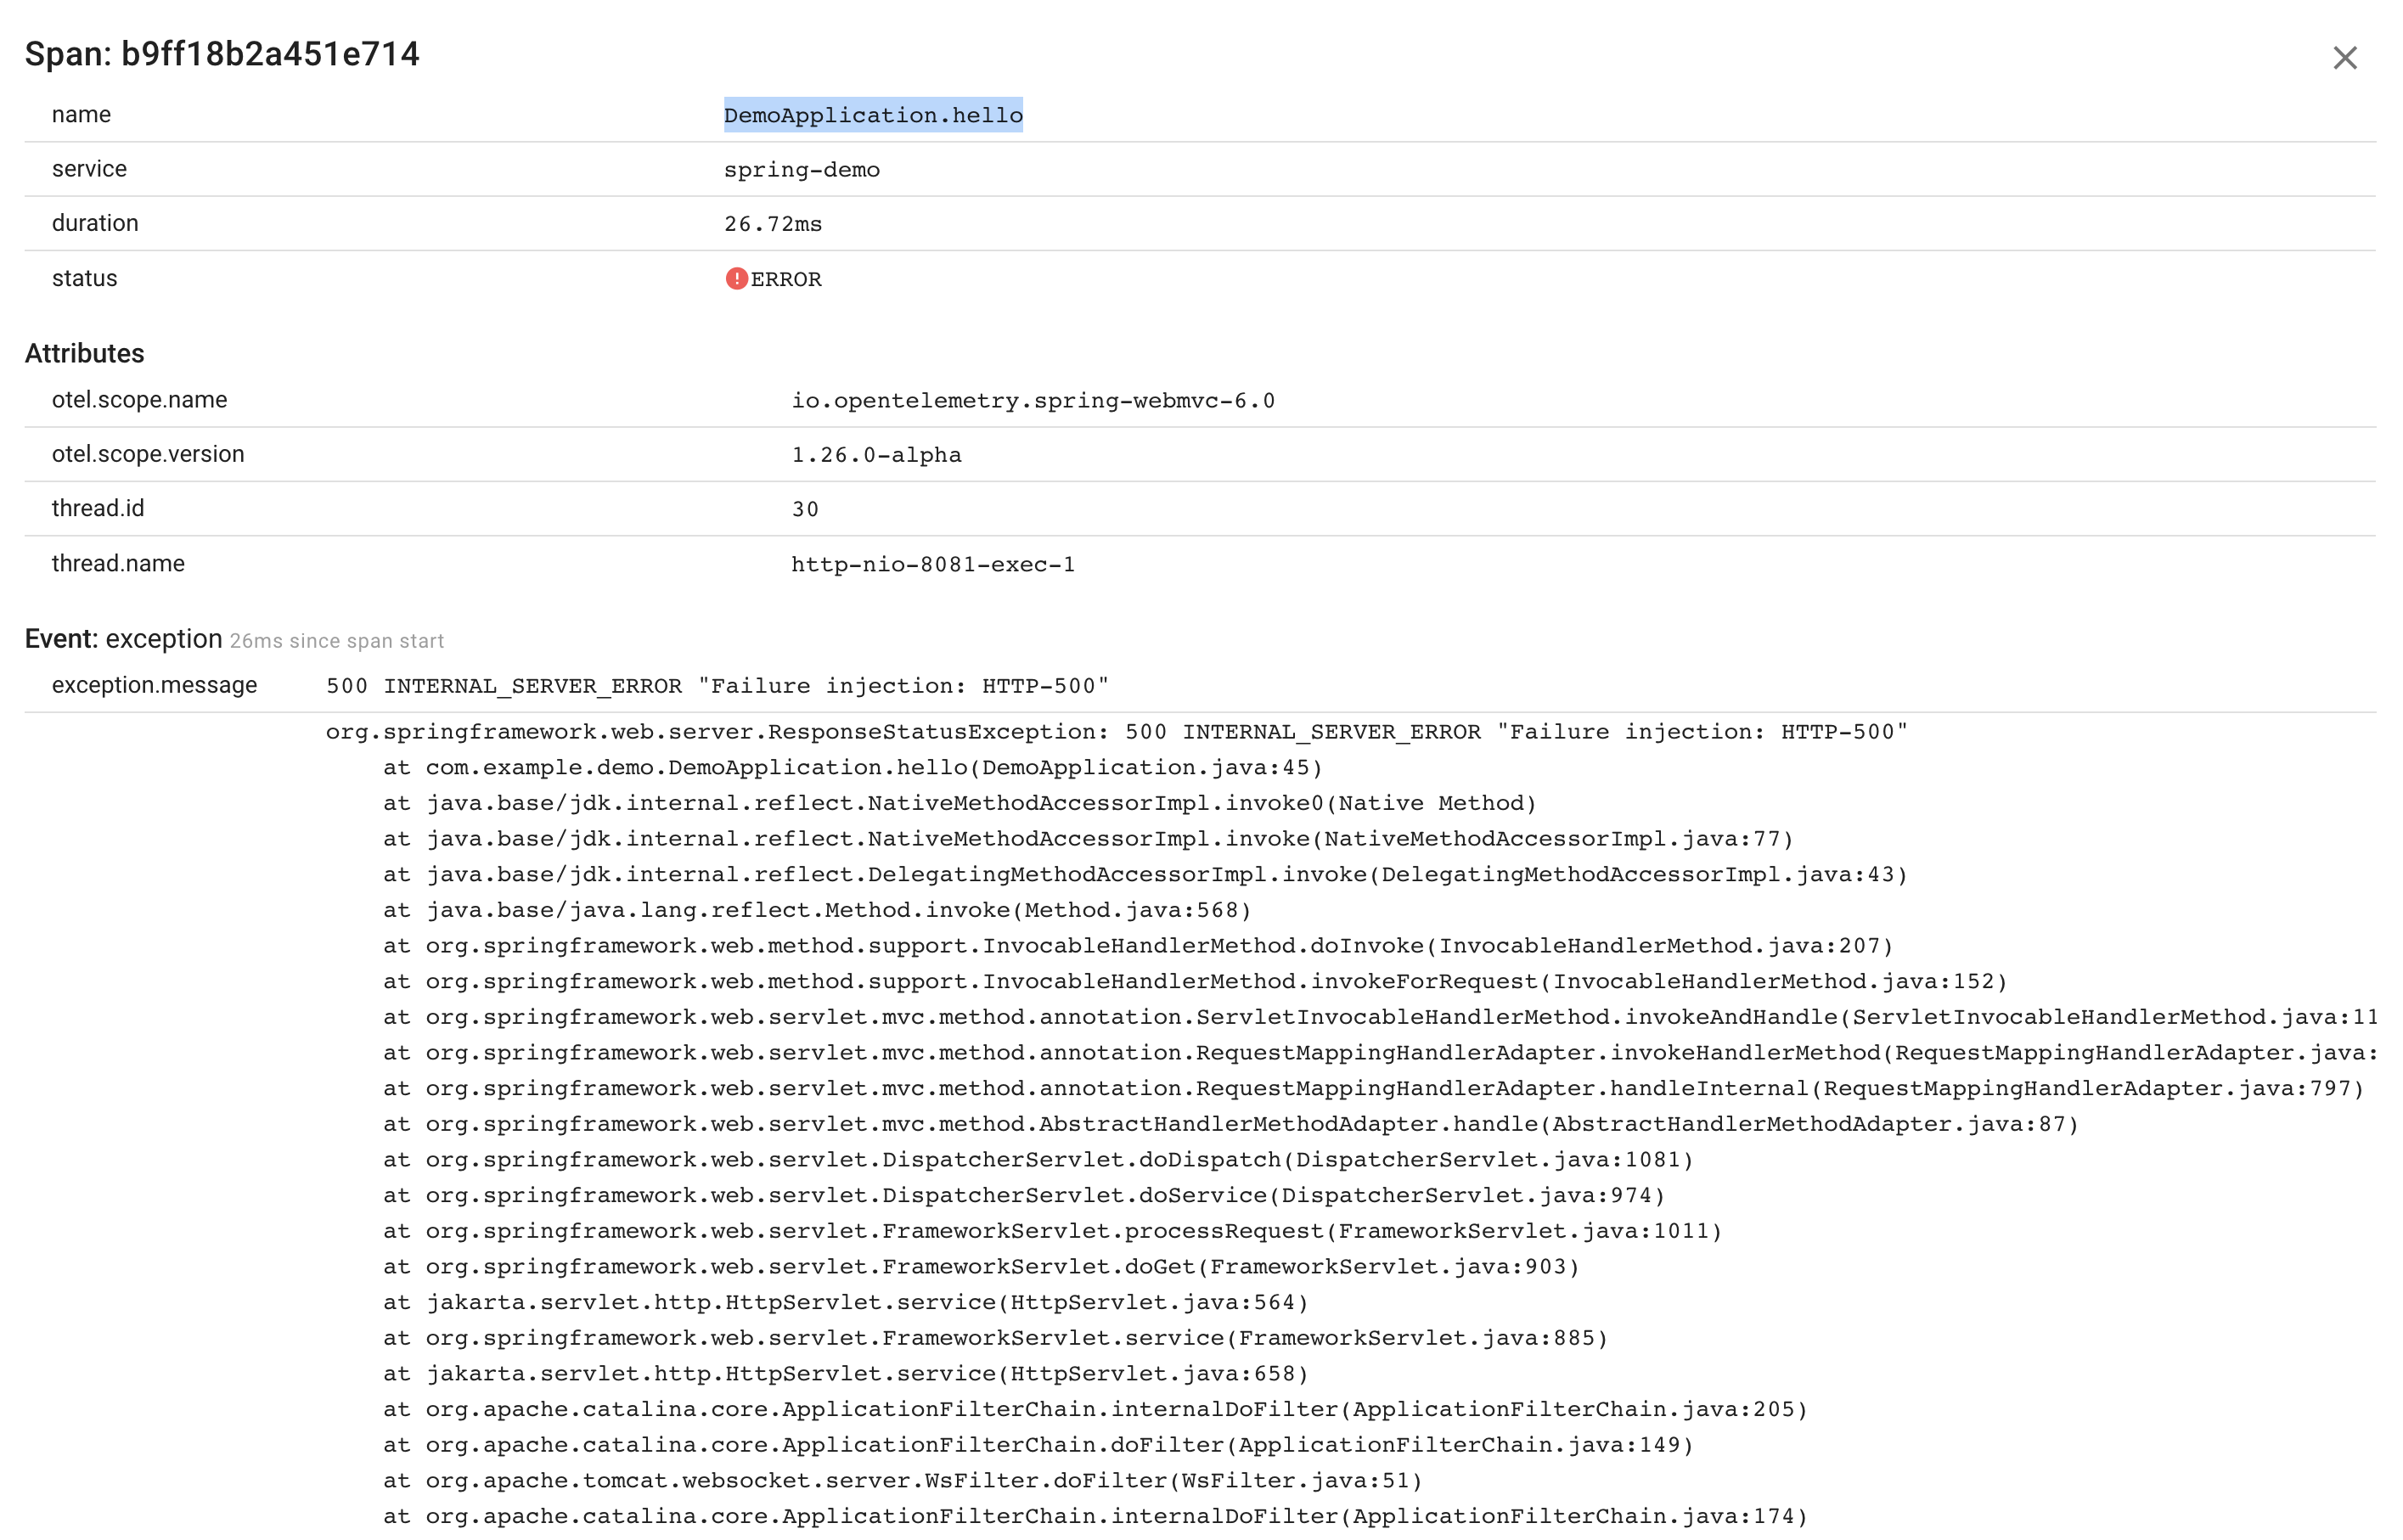
The resulting trace indicates two spans with errors.
Typically, the error is captured within the details of the deepest nested failing span. In this particular case, this is the DemoApplication.hello span.

As you can see, we have easily identified the reason why this particular request resulted in an error.
Database calls
Now, let's add a database call to our app:
@SpringBootApplication
@RestController
public class DemoApplication {
  @Autowired
  private UserRepository userRepository;

  public static void main(String[] args) {
    SpringApplication.run(DemoApplication.class, args);
  }

  @GetMapping("/hello/{id}")
  public String hello(@PathVariable(value = "id") Integer id) {
    Optional<User> user = userRepository.findById(id);
    if (user.isEmpty()) {
      throw new ResponseStatusException(HttpStatus.NOT_FOUND, "User not found");
    }

    return String.format("Hello, %s!", user.get().getName());
  }
}
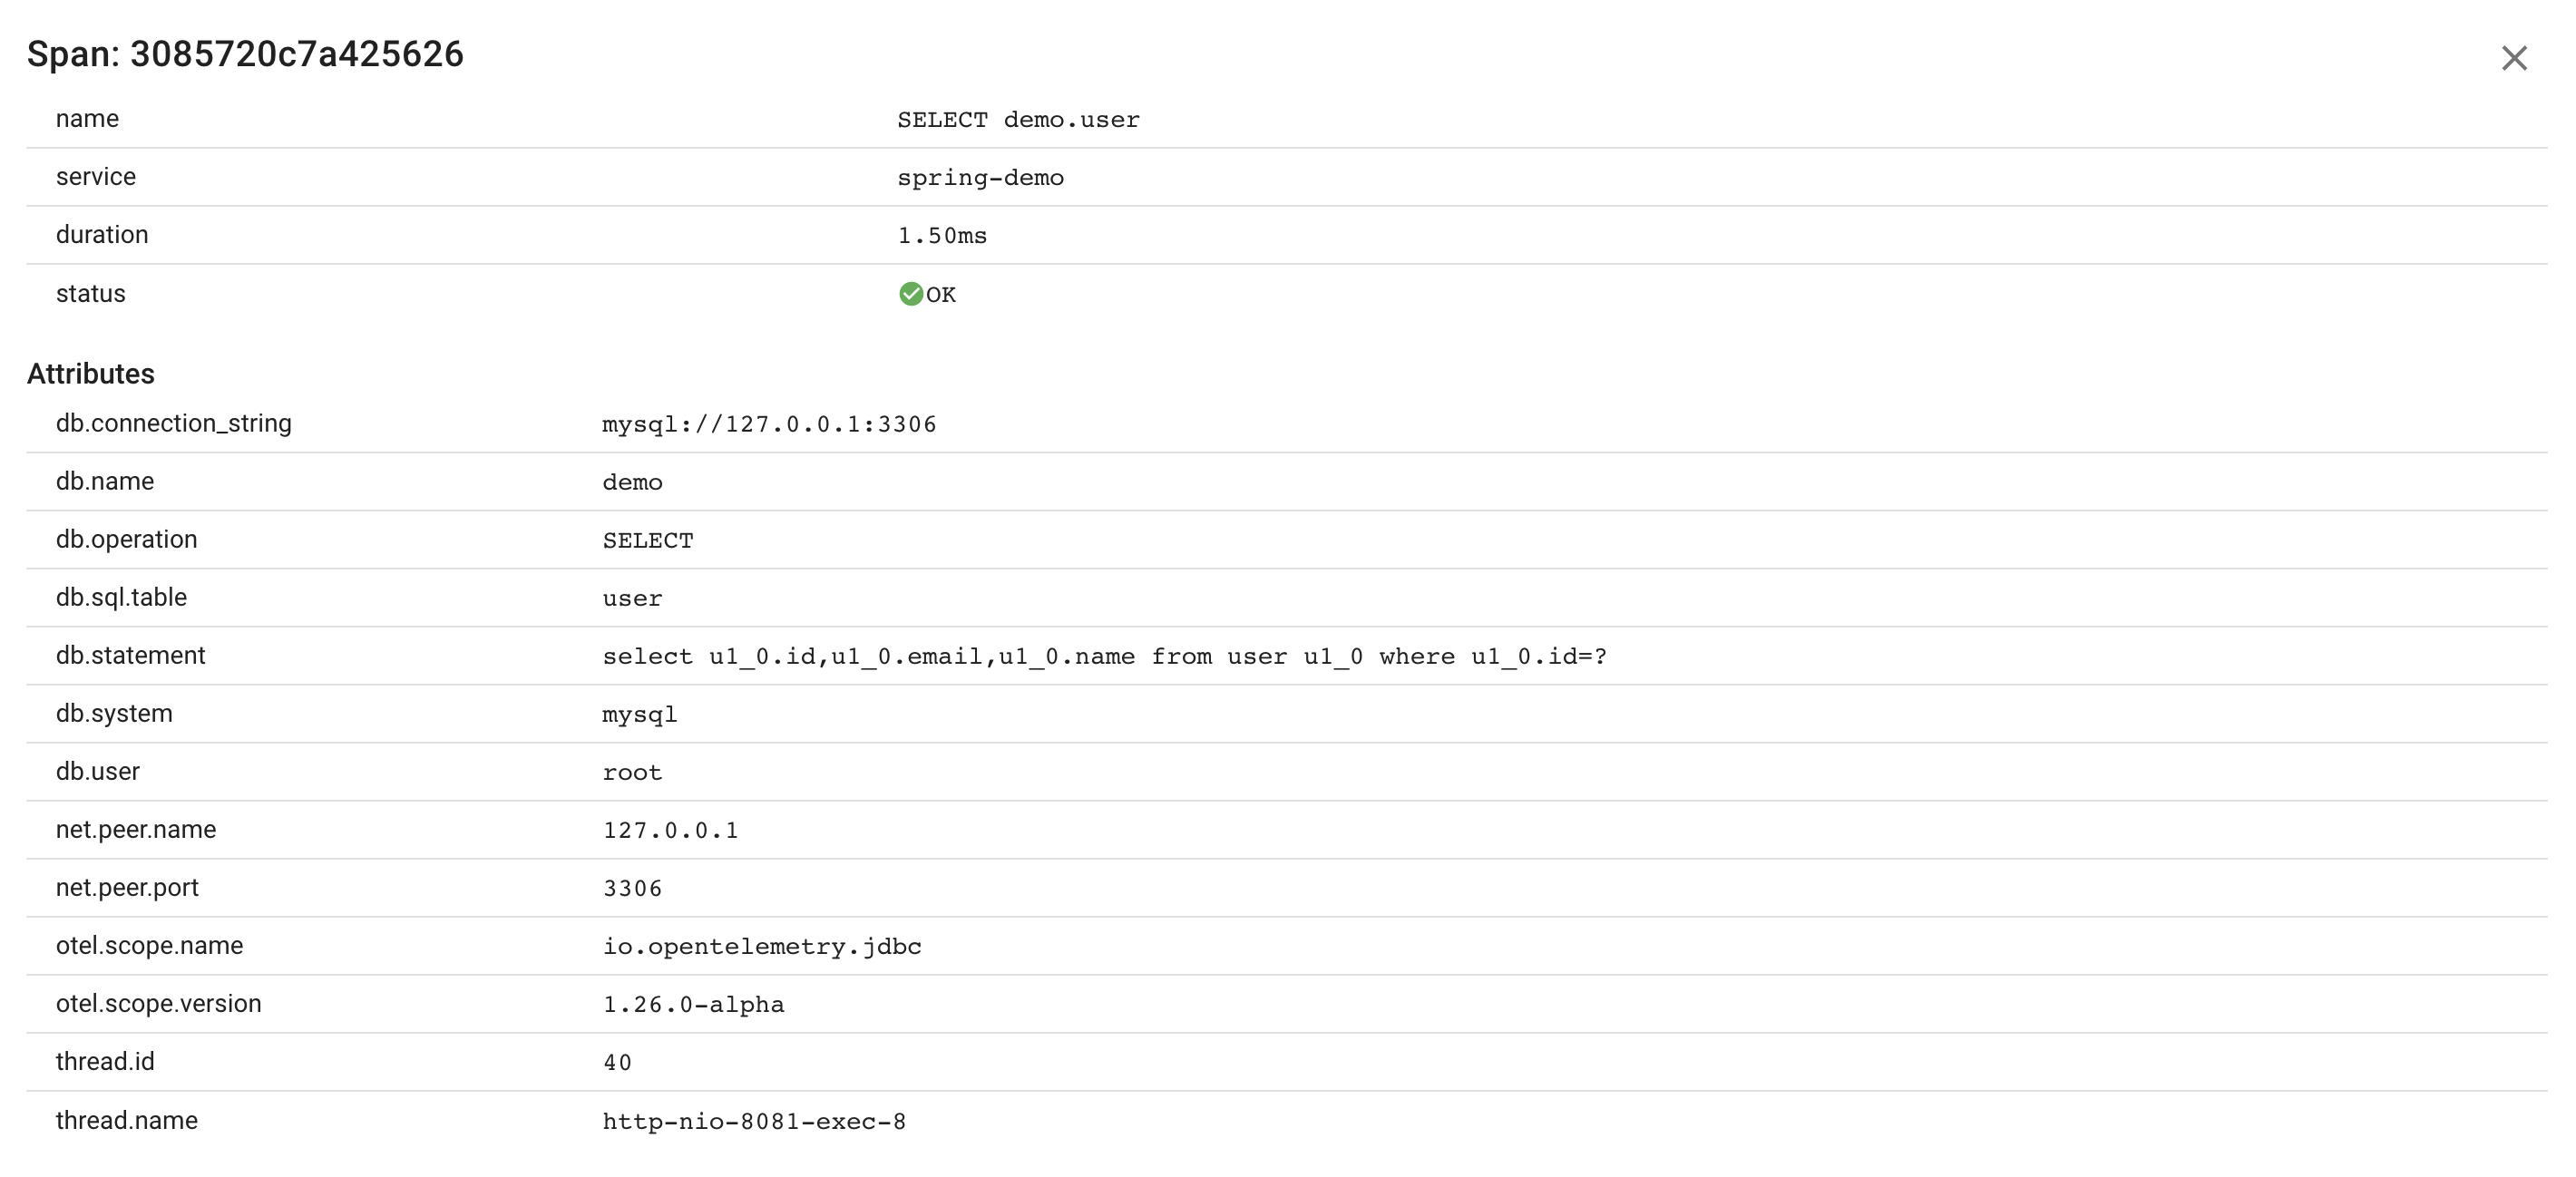
Once again, there is no need to add any additional instrumentation as the OTel Java agent automatically captures every database call.

Span attributes:

HTTP calls and context propagation
Next, instead of retrieving a user from the database, let's make an HTTP call to a service and retrieve a JSON response containing the desired information.
@SpringBootApplication
@RestController
public class DemoApplication {
  public static void main(String[] args) {
    SpringApplication.run(DemoApplication.class, args);
  }

  @GetMapping("/hello/{id}")
  public String hello(@PathVariable(value = "id") Integer id) {
    RestTemplate tpl = new RestTemplate();
    tpl.getMessageConverters().add(new MappingJackson2HttpMessageConverter());

    User user = tpl.getForObject(String.format("http://127.0.0.1:8082/user/%d", id), User.class);

    return String.format("Hello %s!", user.getName());
  }
}

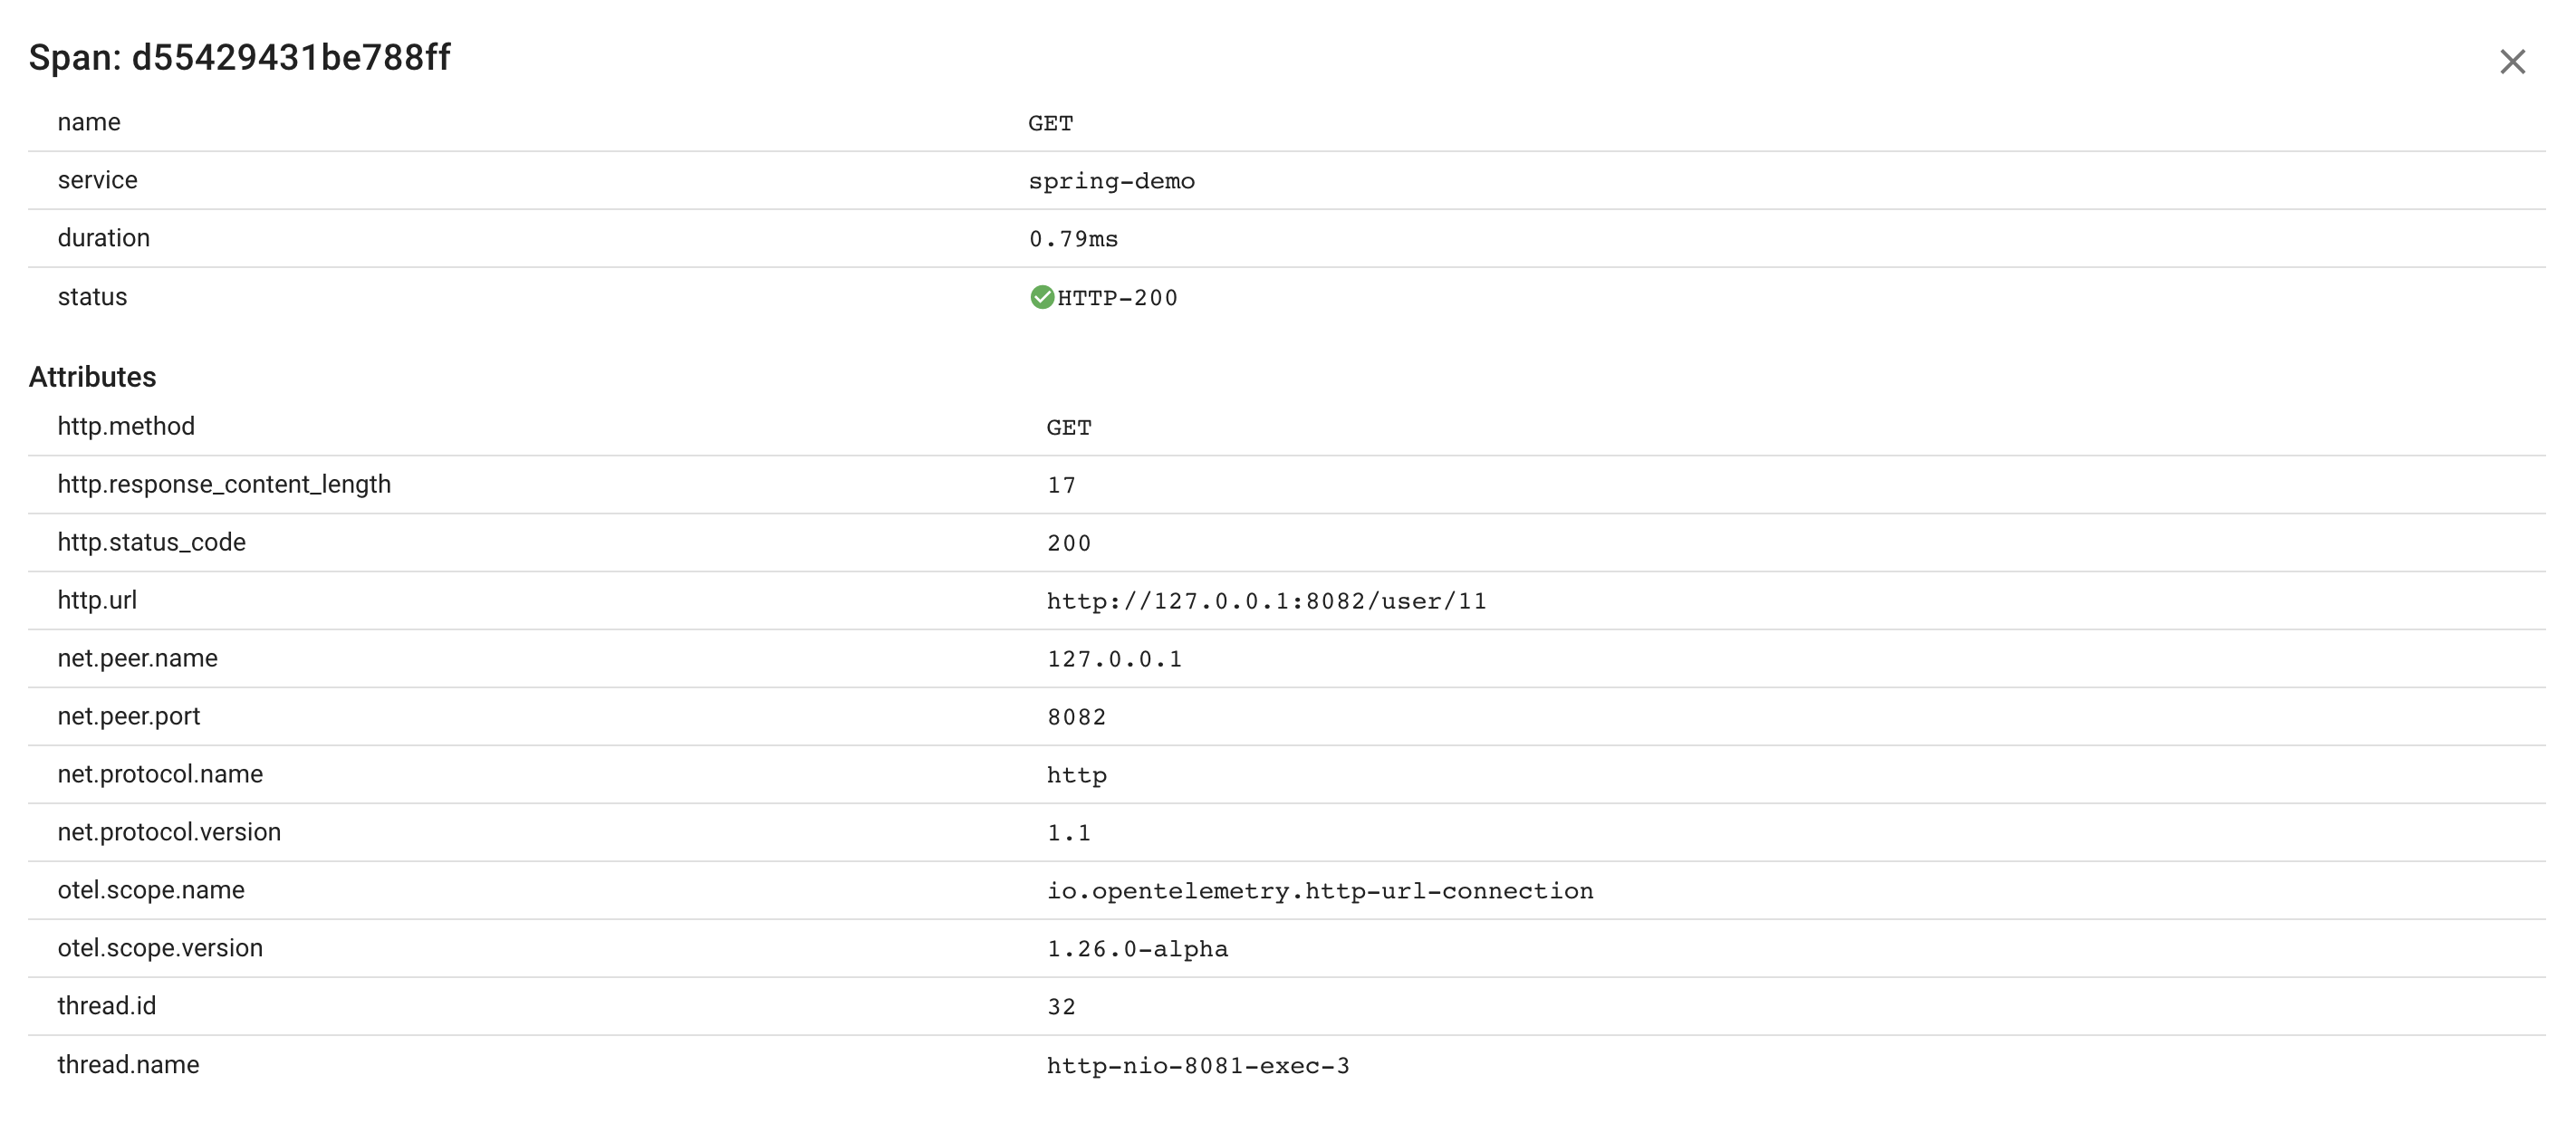
Client span attributes:

As you can see, the resulting trace includes a span reported by the user service.
Both services are instrumented with OpenTelemetry. But how is the context of the current trace propagated between them?
To gain a better understanding of context propagation, let's examine the request sent to the user service:
GET /user/1 HTTP/1.1
Host: 127.0.0.1
Connection: keep-alive
User-agent: Java/17.0.1
Accept: application/json
Traceparent: 00-d12946898a11d917a2fb6bd1ab054e0e-d55429431be788ff-01
OpenTelemetry adds the Traceparent HTTP header on the client side, and dependency services read this header to propagate the trace context. It has the following format:
Version-TraceID-ParentSpanID-TraceFlags
In our case, d12946898a11d917a2fb6bd1ab054e0e is the TraceID, and d55429431be788ff is the ParentSpanId.
Adding custom attributes and events to spans
To customize OpenTelemetry spans, you will need to add the OpenTelemetry dependency to your project:
- Gradle
- Maven
dependencies {
    implementation 'io.opentelemetry:opentelemetry-sdk:1.26.0'
}
<project>
    <dependencyManagement>
        <dependencies>
            <dependency>
                <groupId>io.opentelemetry</groupId>
                <artifactId>opentelemetry-bom</artifactId>
                <version>1.26.0</version>
                <type>pom</type>
                <scope>import</scope>
            </dependency>
        </dependencies>
    </dependencyManagement>

    <dependencies>
        <dependency>
            <groupId>io.opentelemetry</groupId>
            <artifactId>opentelemetry-sdk</artifactId>
        </dependency>
    </dependencies>
</project>
Then, you can retrieve the current span and set custom attributes or add events:
@SpringBootApplication
@RestController
public class DemoApplication {
  public static void main(String[] args) {
    SpringApplication.run(DemoApplication.class, args);
  }

  @GetMapping("/hello/{id}")
  public String hello(@PathVariable(value = "id") Integer id) {
    Span span = Span.current();

    // set an attribute
    span.setAttribute("user.id", id);

    //add an event
    span.addEvent("the user profile has been loaded from the database");

    ...
    return String.format("Hello %s!", user.getName());
  }
}
The resulting span:
