 Node.js
How we measured explains the setup. This page is about Node.js.
The app
- Node.js 24 (LTS), Express 5 in 4 worker processes (
node:cluster), ioredis 6 - Zero-code instrumentation:
@opentelemetry/auto-instrumentations-node0.80 (SDK 2.11), loaded with--require
const app = express();
app.get('/', async (req, res) => {
  res.type('text/plain').send(String(await redis.incr('counter')));
});
export OTEL_TRACES_EXPORTER=otlp
export OTEL_METRICS_EXPORTER=none
export OTEL_LOGS_EXPORTER=none
export OTEL_EXPORTER_OTLP_PROTOCOL=http/protobuf
# the express instrumentation adds middleware, router and handler spans, so only http and ioredis are on
export OTEL_NODE_ENABLED_INSTRUMENTATIONS=http,ioredis
export NODE_OPTIONS="--require @opentelemetry/auto-instrumentations-node/register"
node server.js
Results
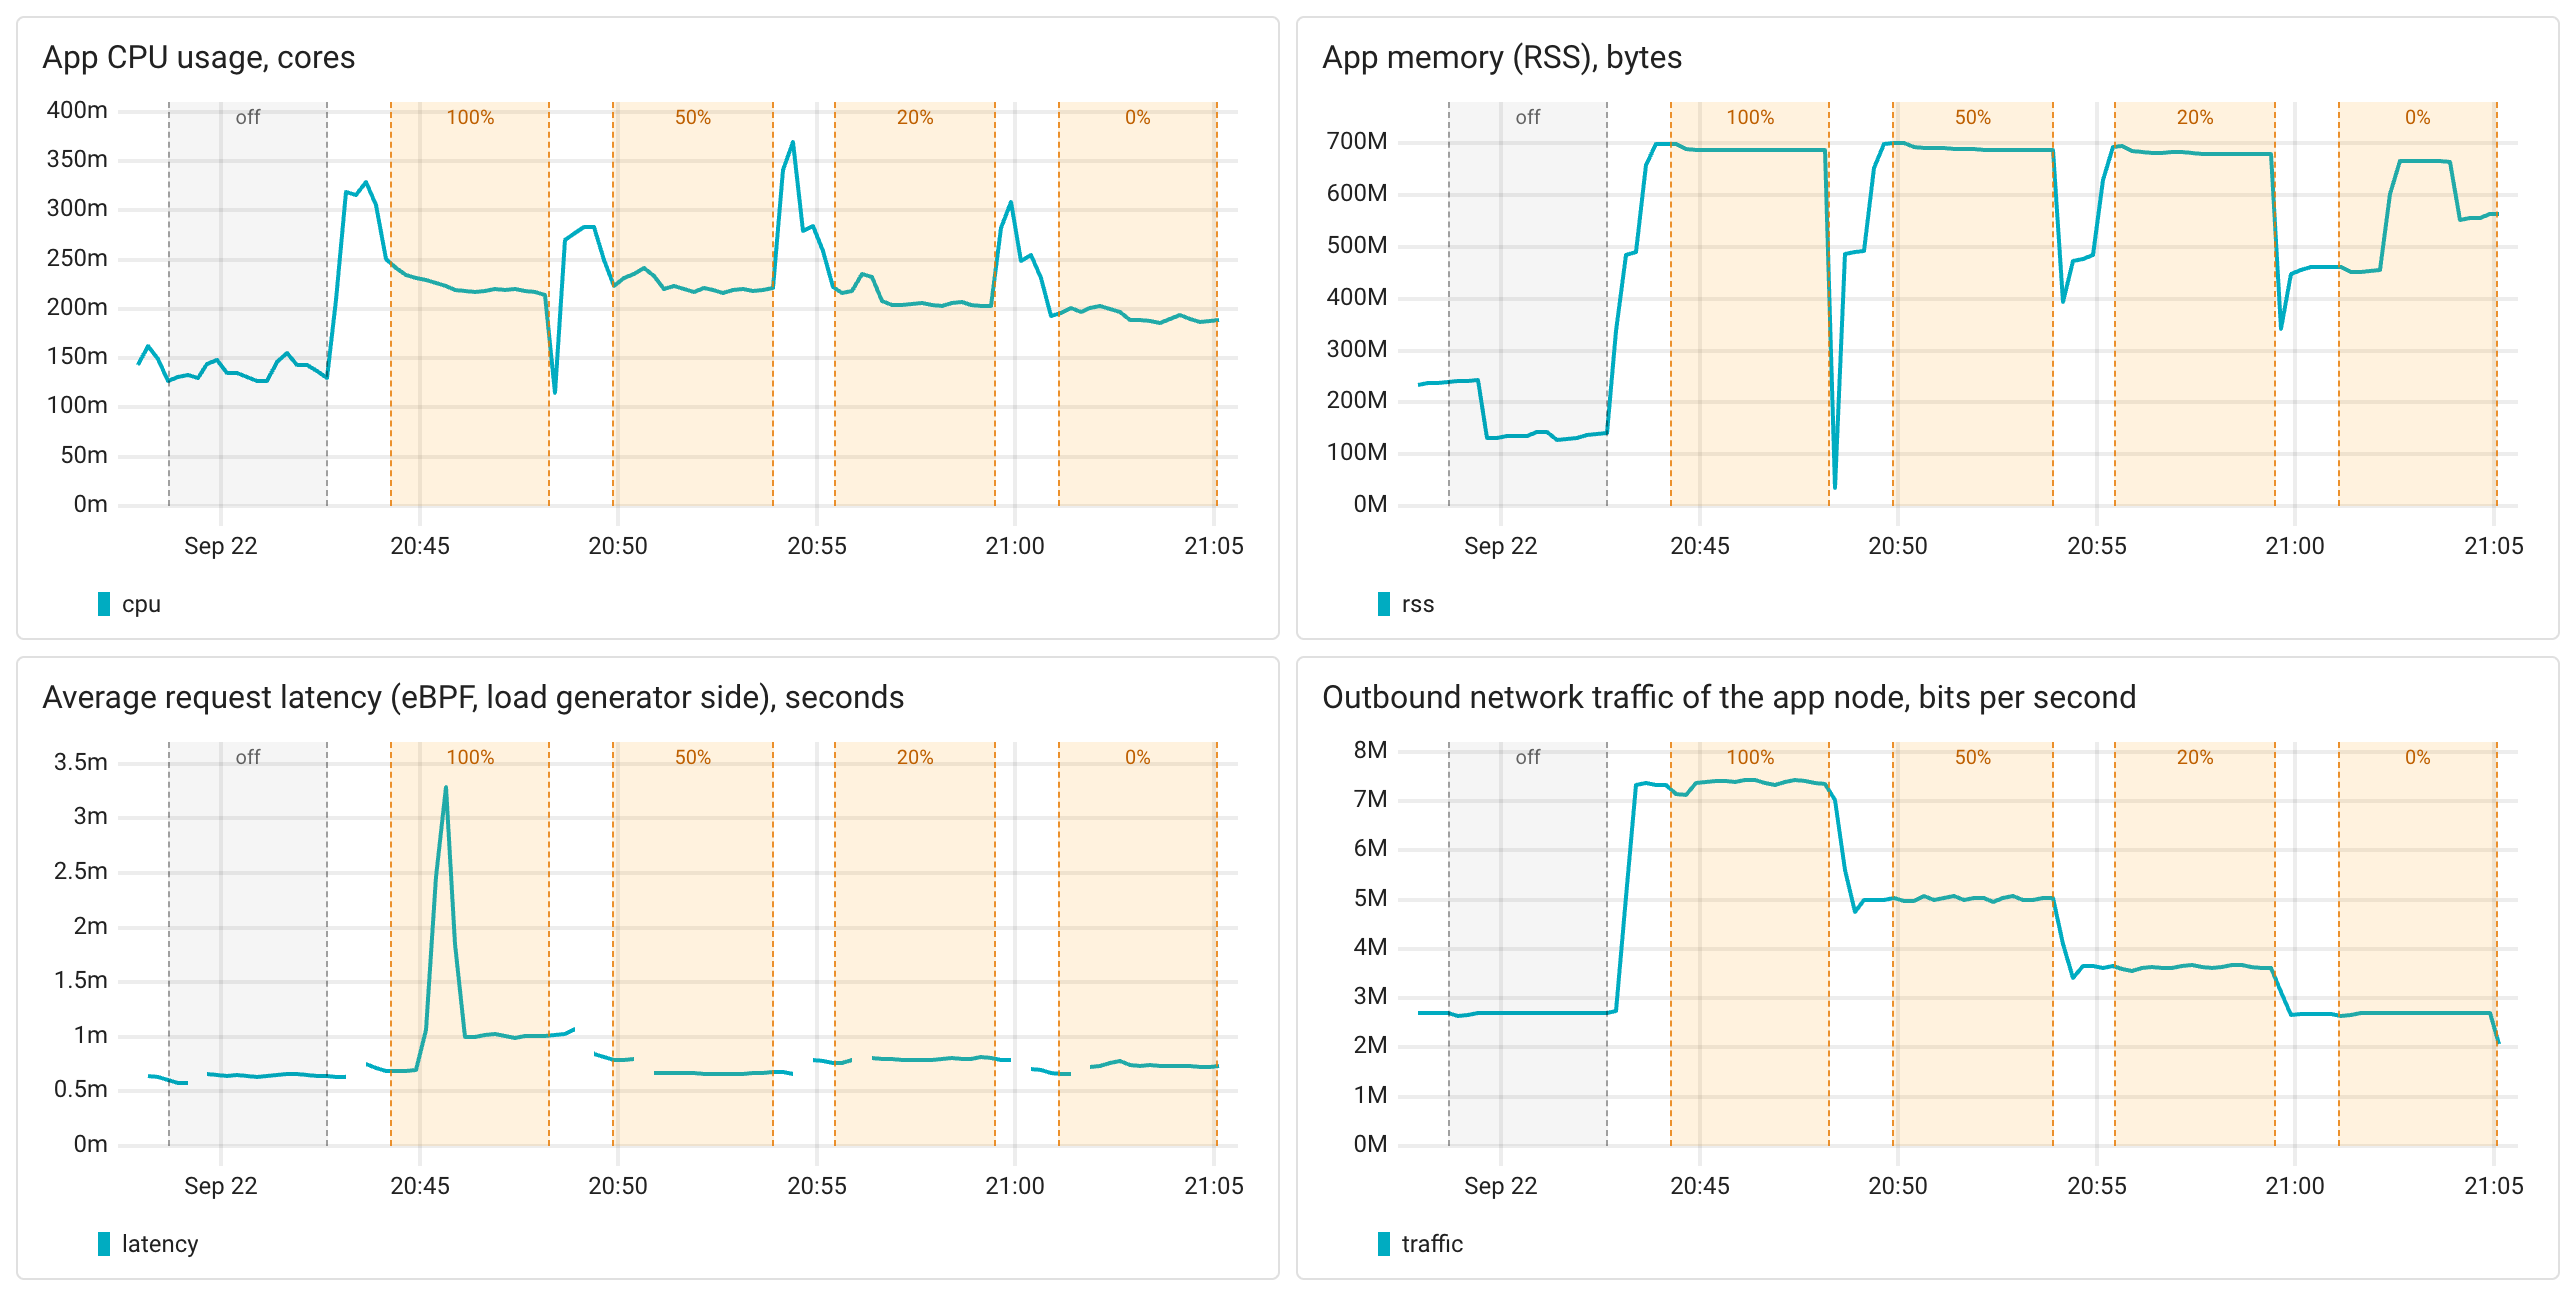
Each shaded area on the charts is a 4-minute measurement in one mode (the second of the two passes; the tables average both).
| Mode | off | 100% | 50% | 20% | 0% |
|---|---|---|---|---|---|
| Spans received by Coroot, per second | 0 | 1,994 | 998 | 398 | 0 |
| CPU usage, cores | 0.134 | 0.228 (+70%) | 0.218 (+63%) | 0.210 (+57%) | 0.189 (+41%) |
| Memory (RSS), MB, average | 147 | 688 (+369%) | 687 (+369%) | 686 (+368%) | 566 (+286%) |
| Memory (RSS), MB, peak | 243 | 691 | 701 | 701 | 678 |
| Trace export traffic, Mbit/s | - | 4.7 | 2.3 | 0.9 | 0 |
| Latency, p50, ms | 0.59 | 0.72 | 0.65 | 0.68 | 0.68 |
| Latency, p99, ms | 1.3 | 4.0 | 1.4 | 1.8 | 1.7 |
- CPU: tracing every request costs 0.09 CPU cores per 1,000 requests per second, +70% for this app. At 0% sampling it's still +41%:
the instrumentation wraps every HTTP request and every ioredis command, and the async context propagation (
AsyncLocalStorage) runs on every request, sampled or not. - Memory: the biggest memory hit in the benchmark, and it barely depends on the sampling rate. Each of the 4 workers loads the SDK and all the instrumentation packages: RSS goes from 147MB to about 690MB (135MB per worker), and even at 0% sampling it's 566MB.
- Network: about 290 bytes per span.
- Latency: the median goes up by about 0.1 ms in every traced mode. The 99th percentile went from 1.3 ms to 4 ms with every request traced, but only in one of the two passes (1.8 and 6.1 ms), so take it as a hint of garbage collection pauses rather than a firm number.
- Nothing was dropped.
Where the CPU goes
Coroot's eBPF profiler shows what the extra CPU time is spent on. To make the JavaScript frames readable, the app was started with
--perf-basic-prof-only-functions --interpreted-frames-native-stack, which makes Node.js write a perf map that the profiler picks up
(see eBPF-based profiling). This flame graph comes from a separate off → 100% run, so the numbers in the table above are not affected by it.
Red frames take a bigger share of CPU time with tracing on, green frames a smaller one.
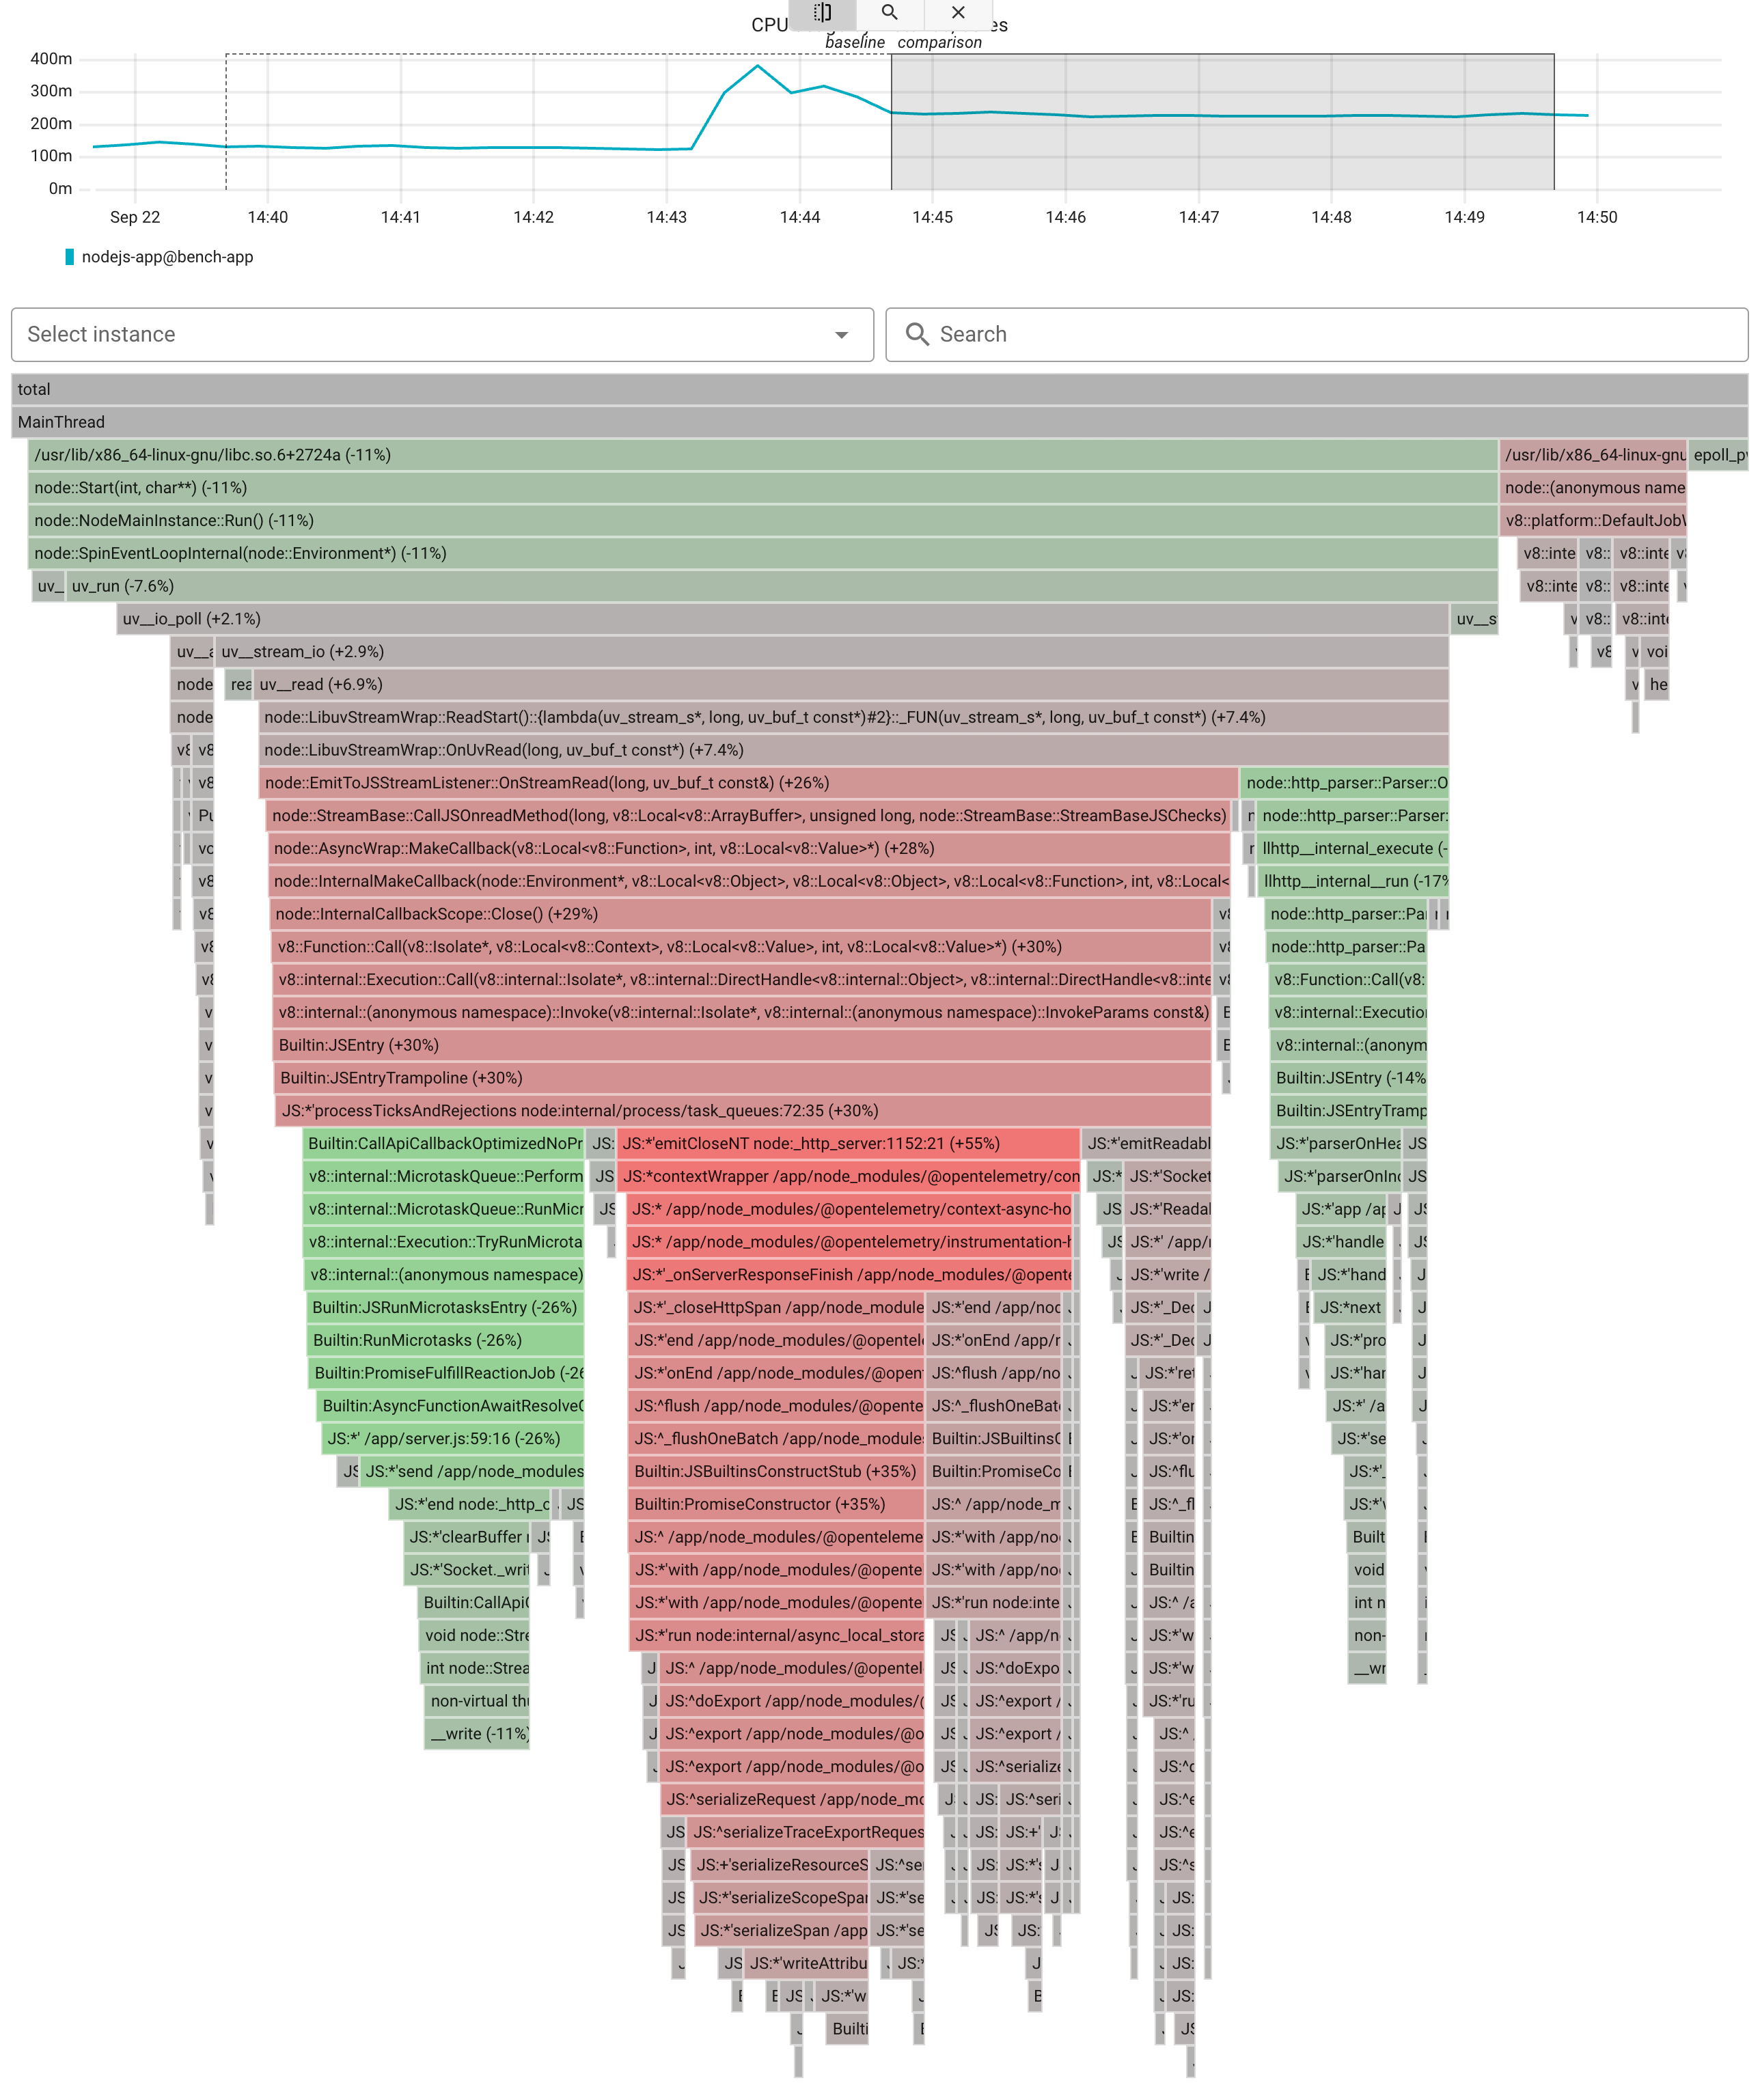
The big red column is what happens when a response finishes: the SDK closes the HTTP span, hands it to the batch processor, and, every time a batch is full, serializes it to protobuf and exports it, all on the same event loop thread that serves the requests. Node.js has no background thread for this, so the export work competes directly with request handling, and the extra objects it creates are what the garbage collector has to clean up.
Takeaways
- Tracing a Node.js service costs about 0.09 CPU cores per 1,000 requests per second and, above all, memory: 130MB+ per worker process.
- Sampling lowers the cost but doesn't remove it. Even at 0%, the instrumentation adds 41% CPU and almost quadruples the memory footprint.