Overview
In a distributed system, a single request may pass through multiple services and databases. Distributed tracing allows engineers to visualize the path of a request across all of these components, which can help identify performance bottlenecks, latency issues, and errors.
While most distributed tracing tools are good at visualizing individual request traces, many struggle to provide a comprehensive overview of system performance.
At Coroot, we've addressed this challenge by creating a new interface that allows you to easily explore and understand system performance with just a few clicks.
Traces overview
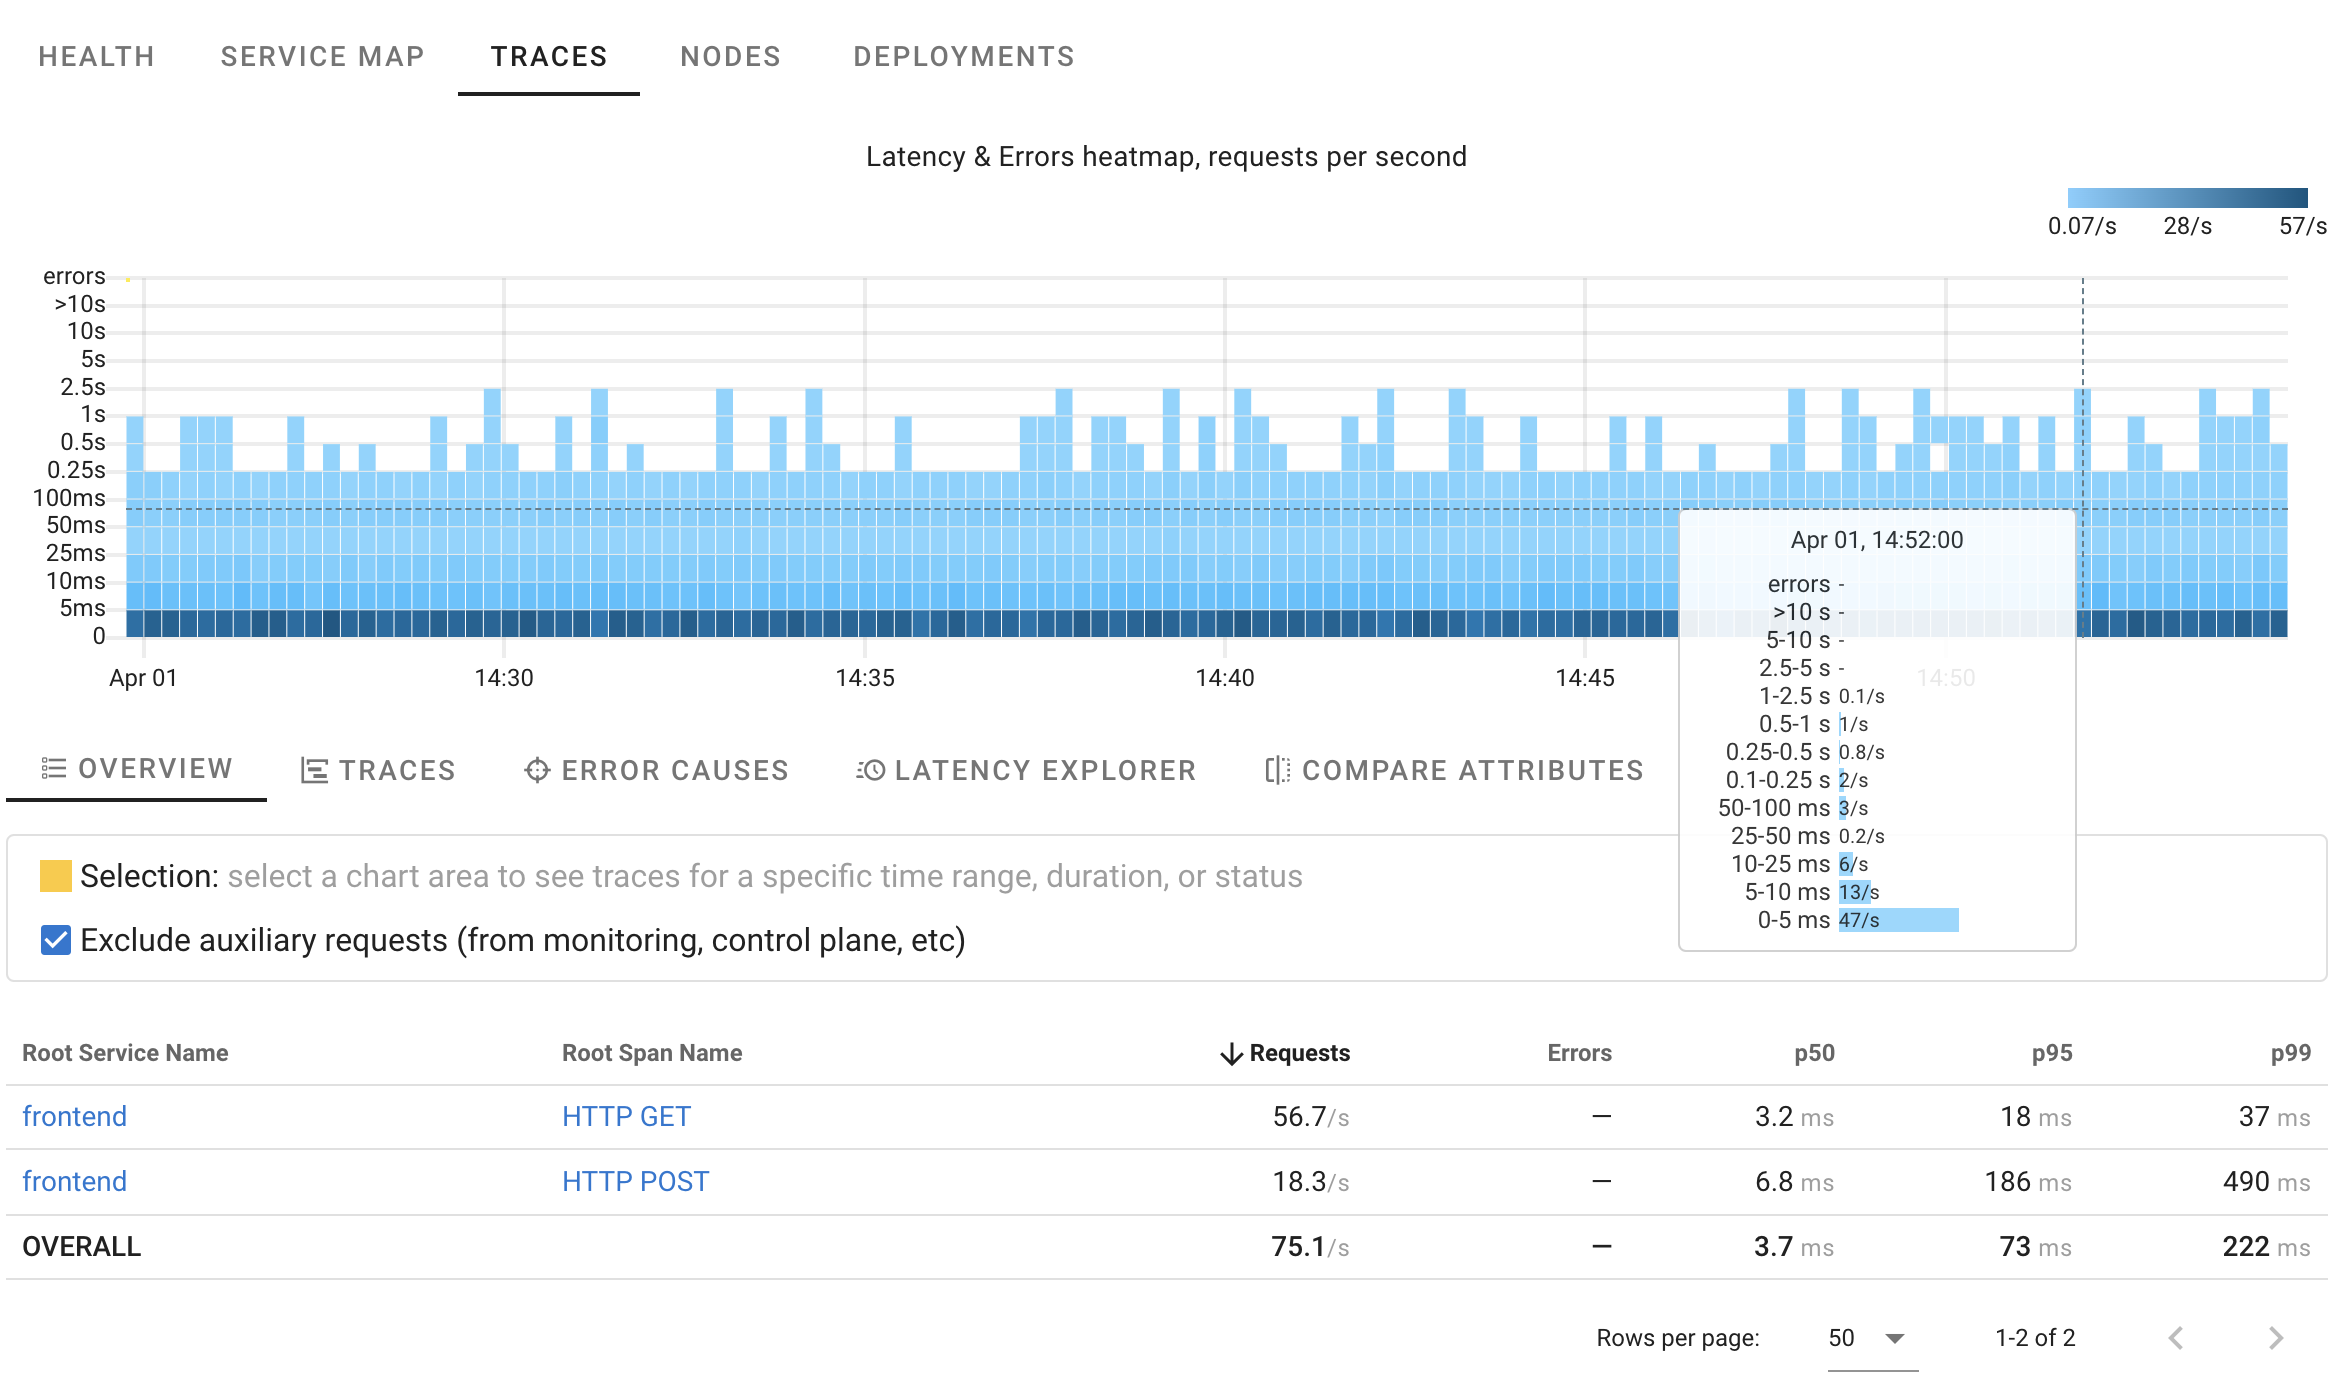
Here's a HeatMap showing request distribution over time, their statuses, and durations. It indicates that in this case the system is handling roughly 70 requests per second, with most taking less than 250ms and no errors detected.
Errors
Using HeatMaps it's easy to spot anomalies.
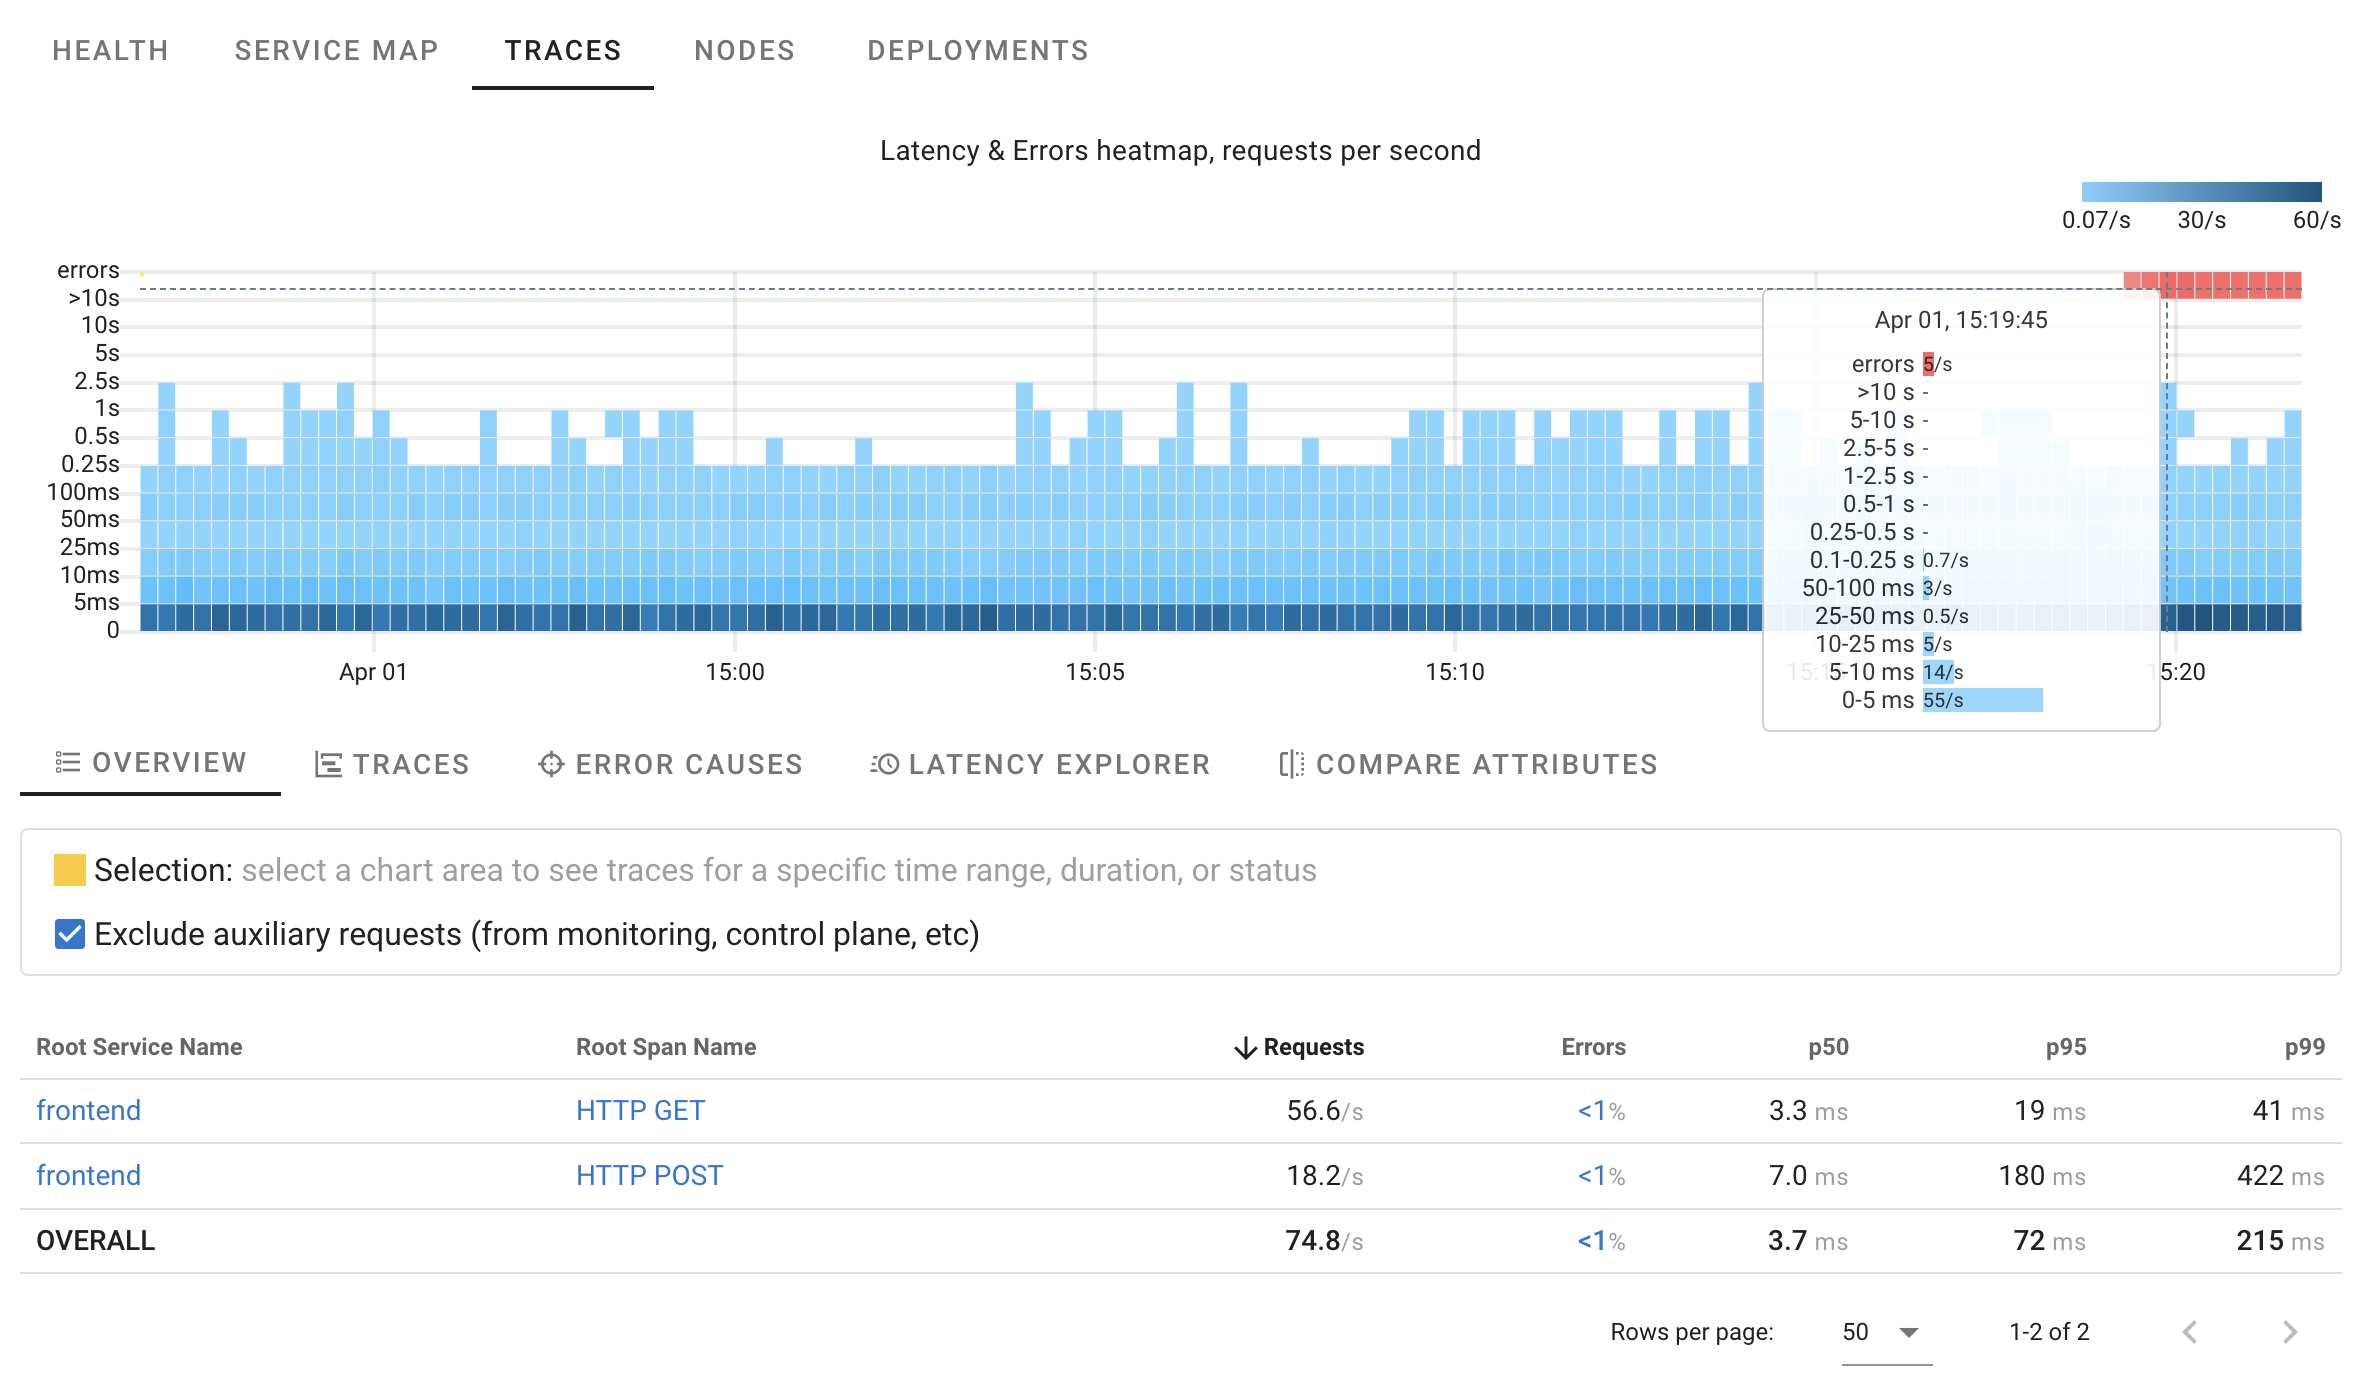
As seen in the HeatMap, there are approximately 5 errors per second. While we know precisely when this started, we're still unsure about the reasons behind it. Are these errors of a single type, or are multiple failures occurring simultaneously?
By selecting any area on the chart, we can view relevant traces or even summaries of ALL related traces:
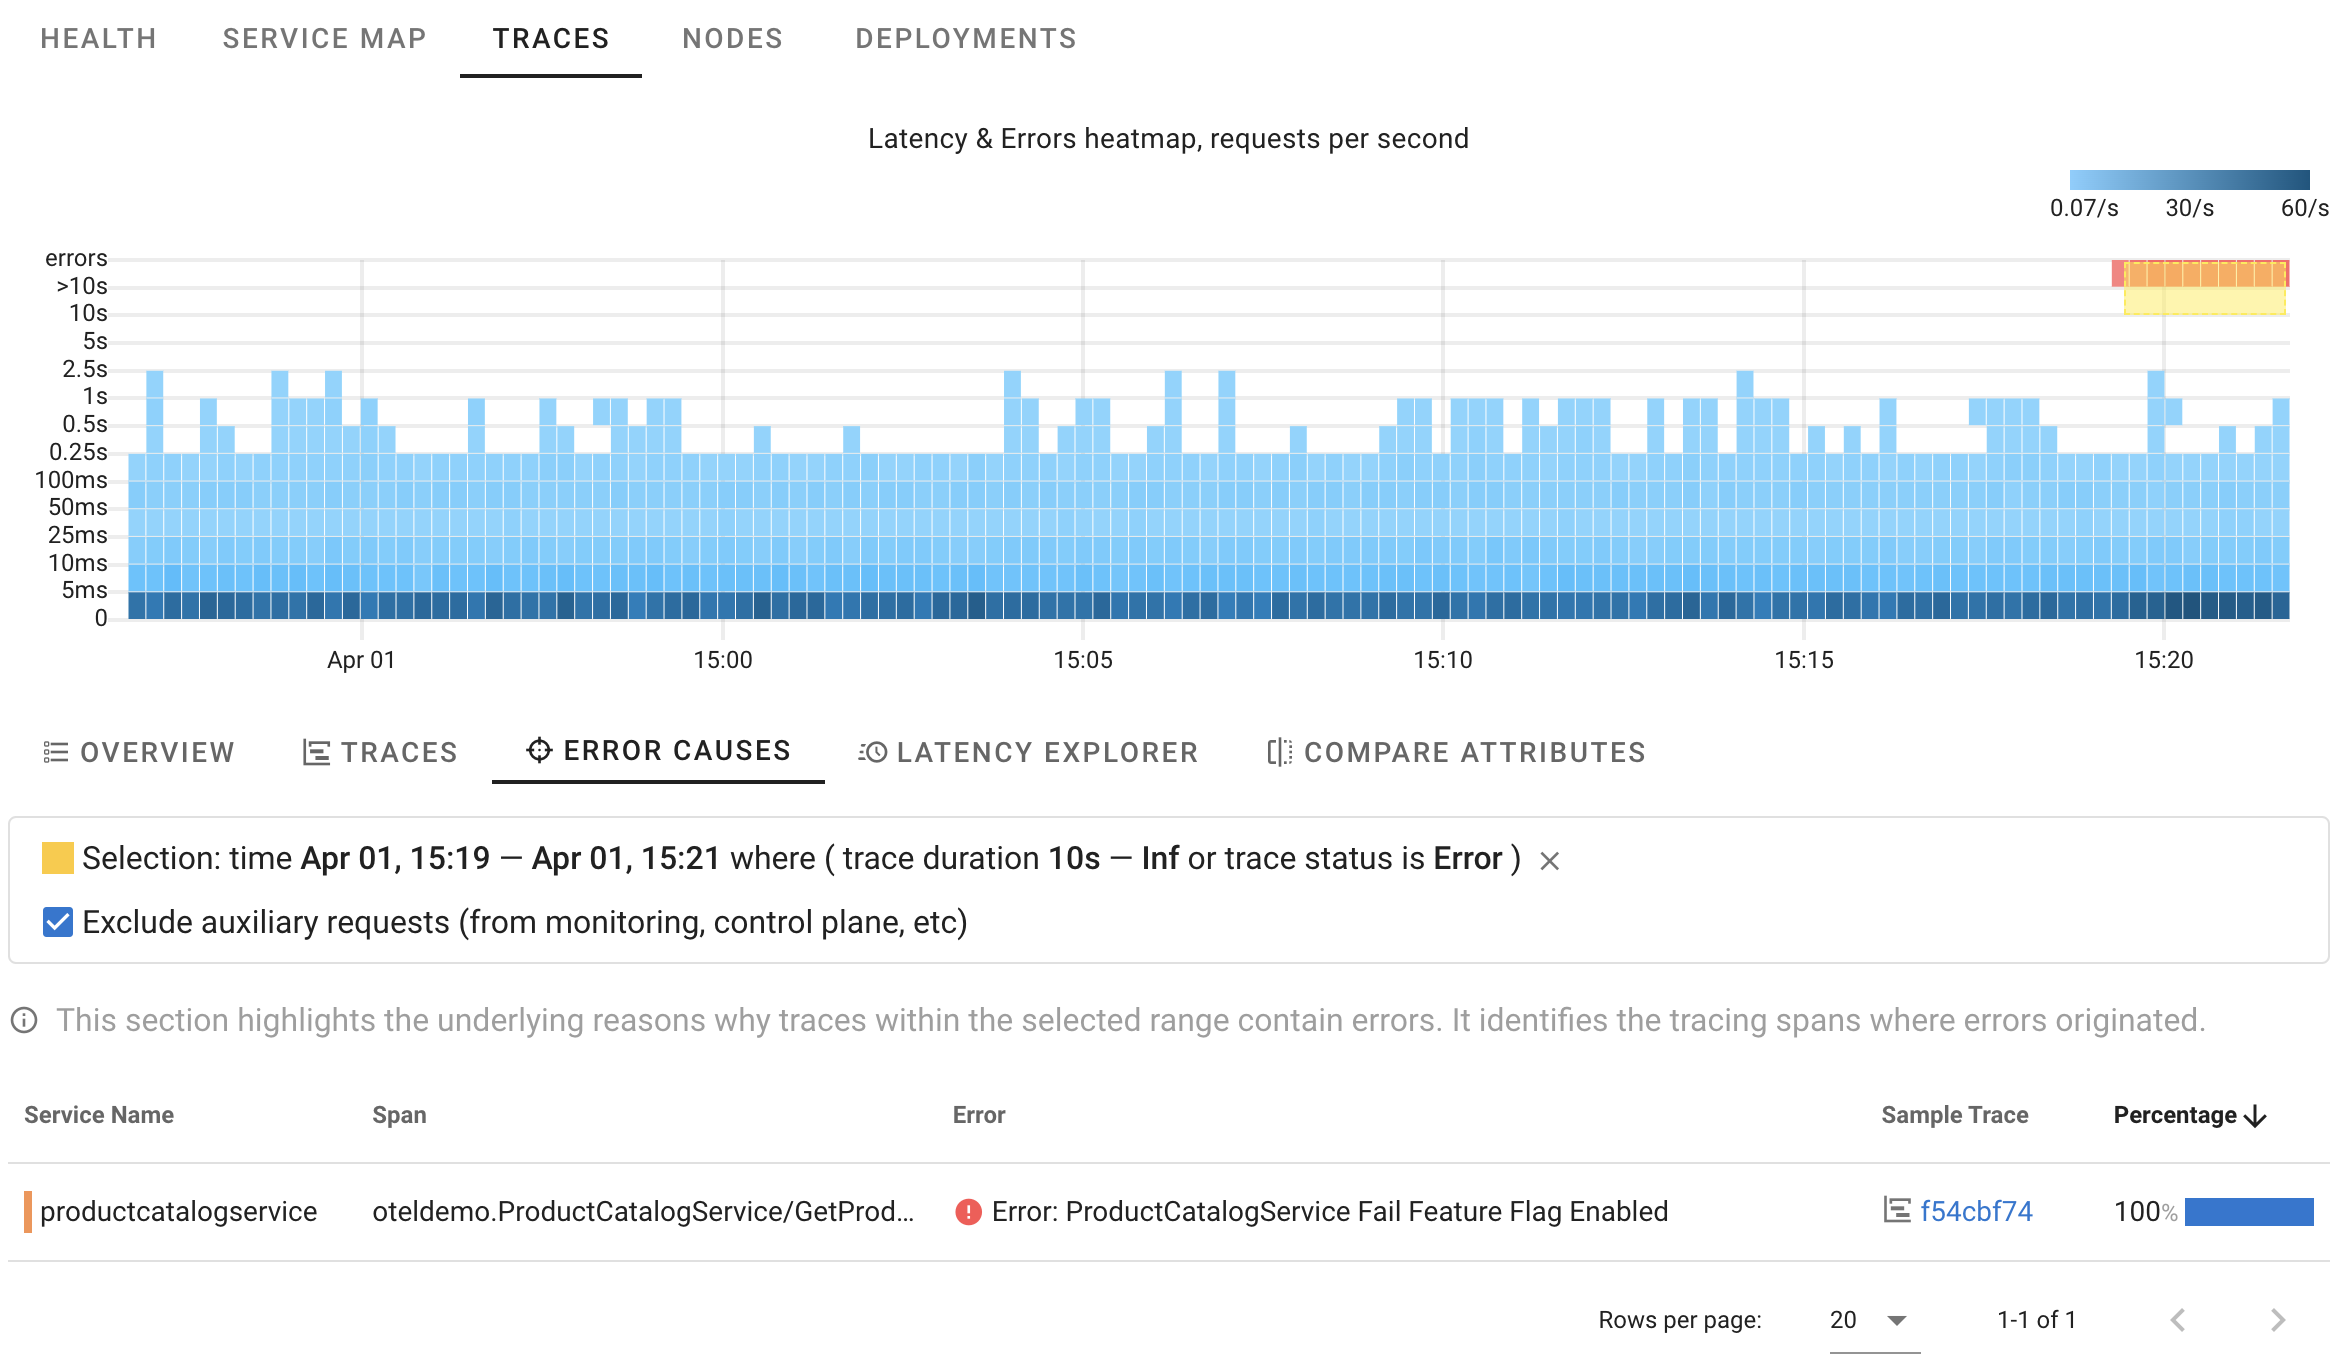
Now, we're certain that in this specific scenario, 100% of errors were triggered by our intentionally introduced error. It works similarly to manual trace analysis, but Coroot goes a step further by automatically analyzing ALL affected requests and pinpointing only those spans where errors originated.
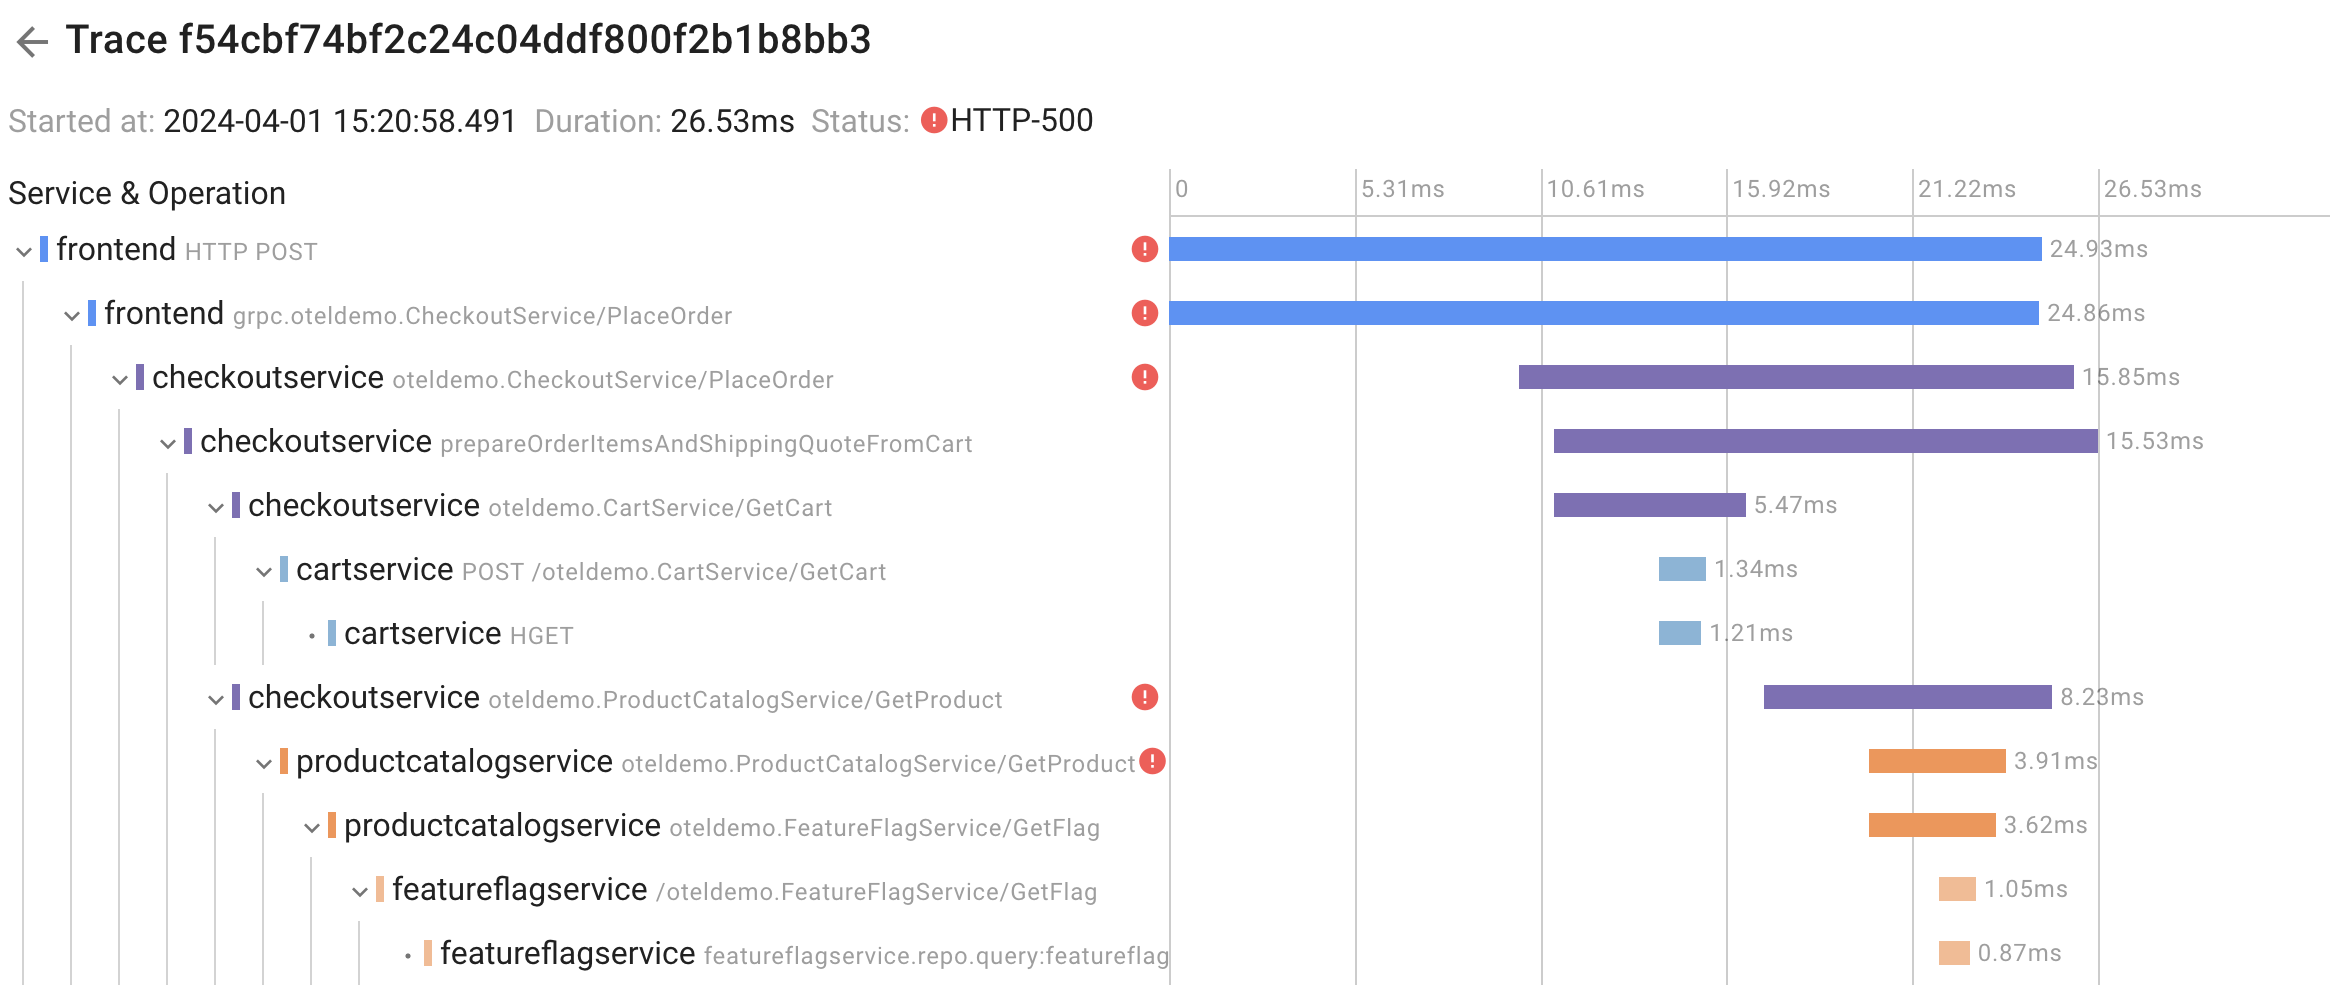
Of course, you still have the option to manually analyze any trace and crosscheck.
Attributes comparison
Another question that may arise is how requests within an anomaly differ from other requests. With Coroot you can compare trace attributes within a selected area of the chart with other requests.
This is extremely useful in cases where the system behaves differently when handling requests with specific input data, such as requests from a particular customer or browser type.
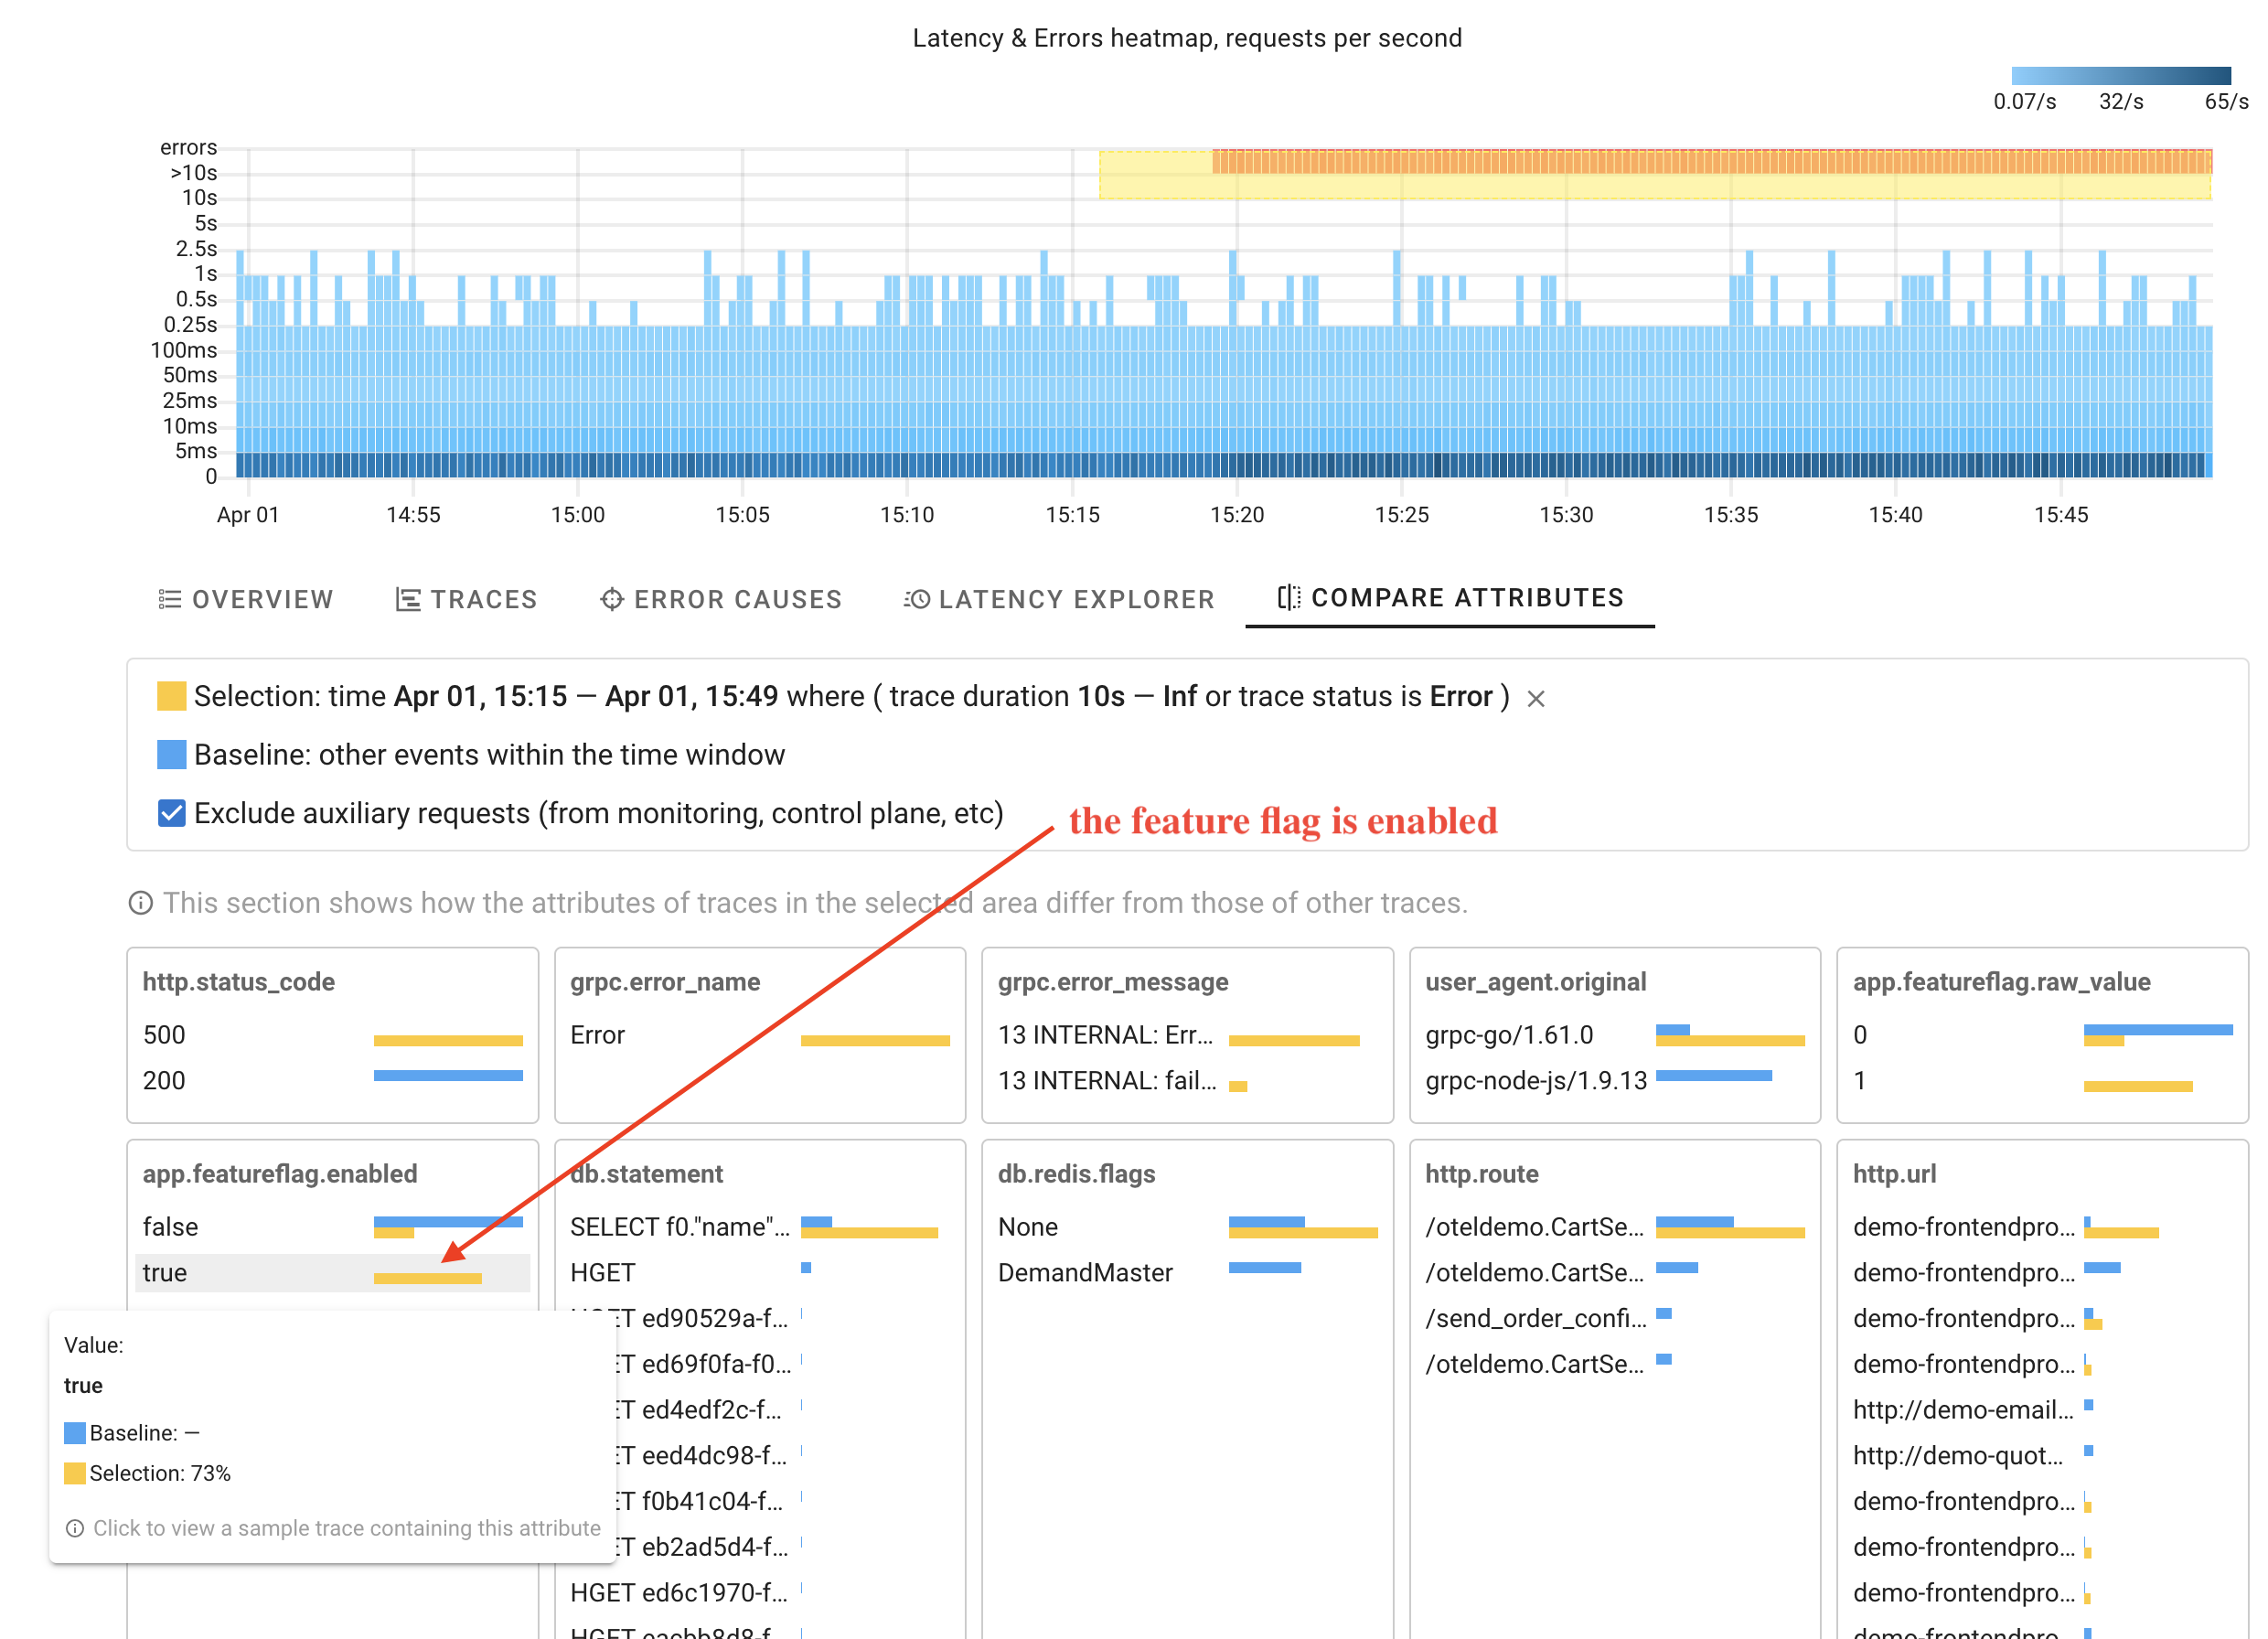
As you can see, Coroot has identified that the selected requests have the attribute indicating that the feature flag was enabled. The coolest thing here is that this feature works without any configuration, making it applicable for any custom attributes.
Slow requests
With Coroot's HeatMap, it's easy to identify an anomaly in request processing: certain requests are taking longer than usual.
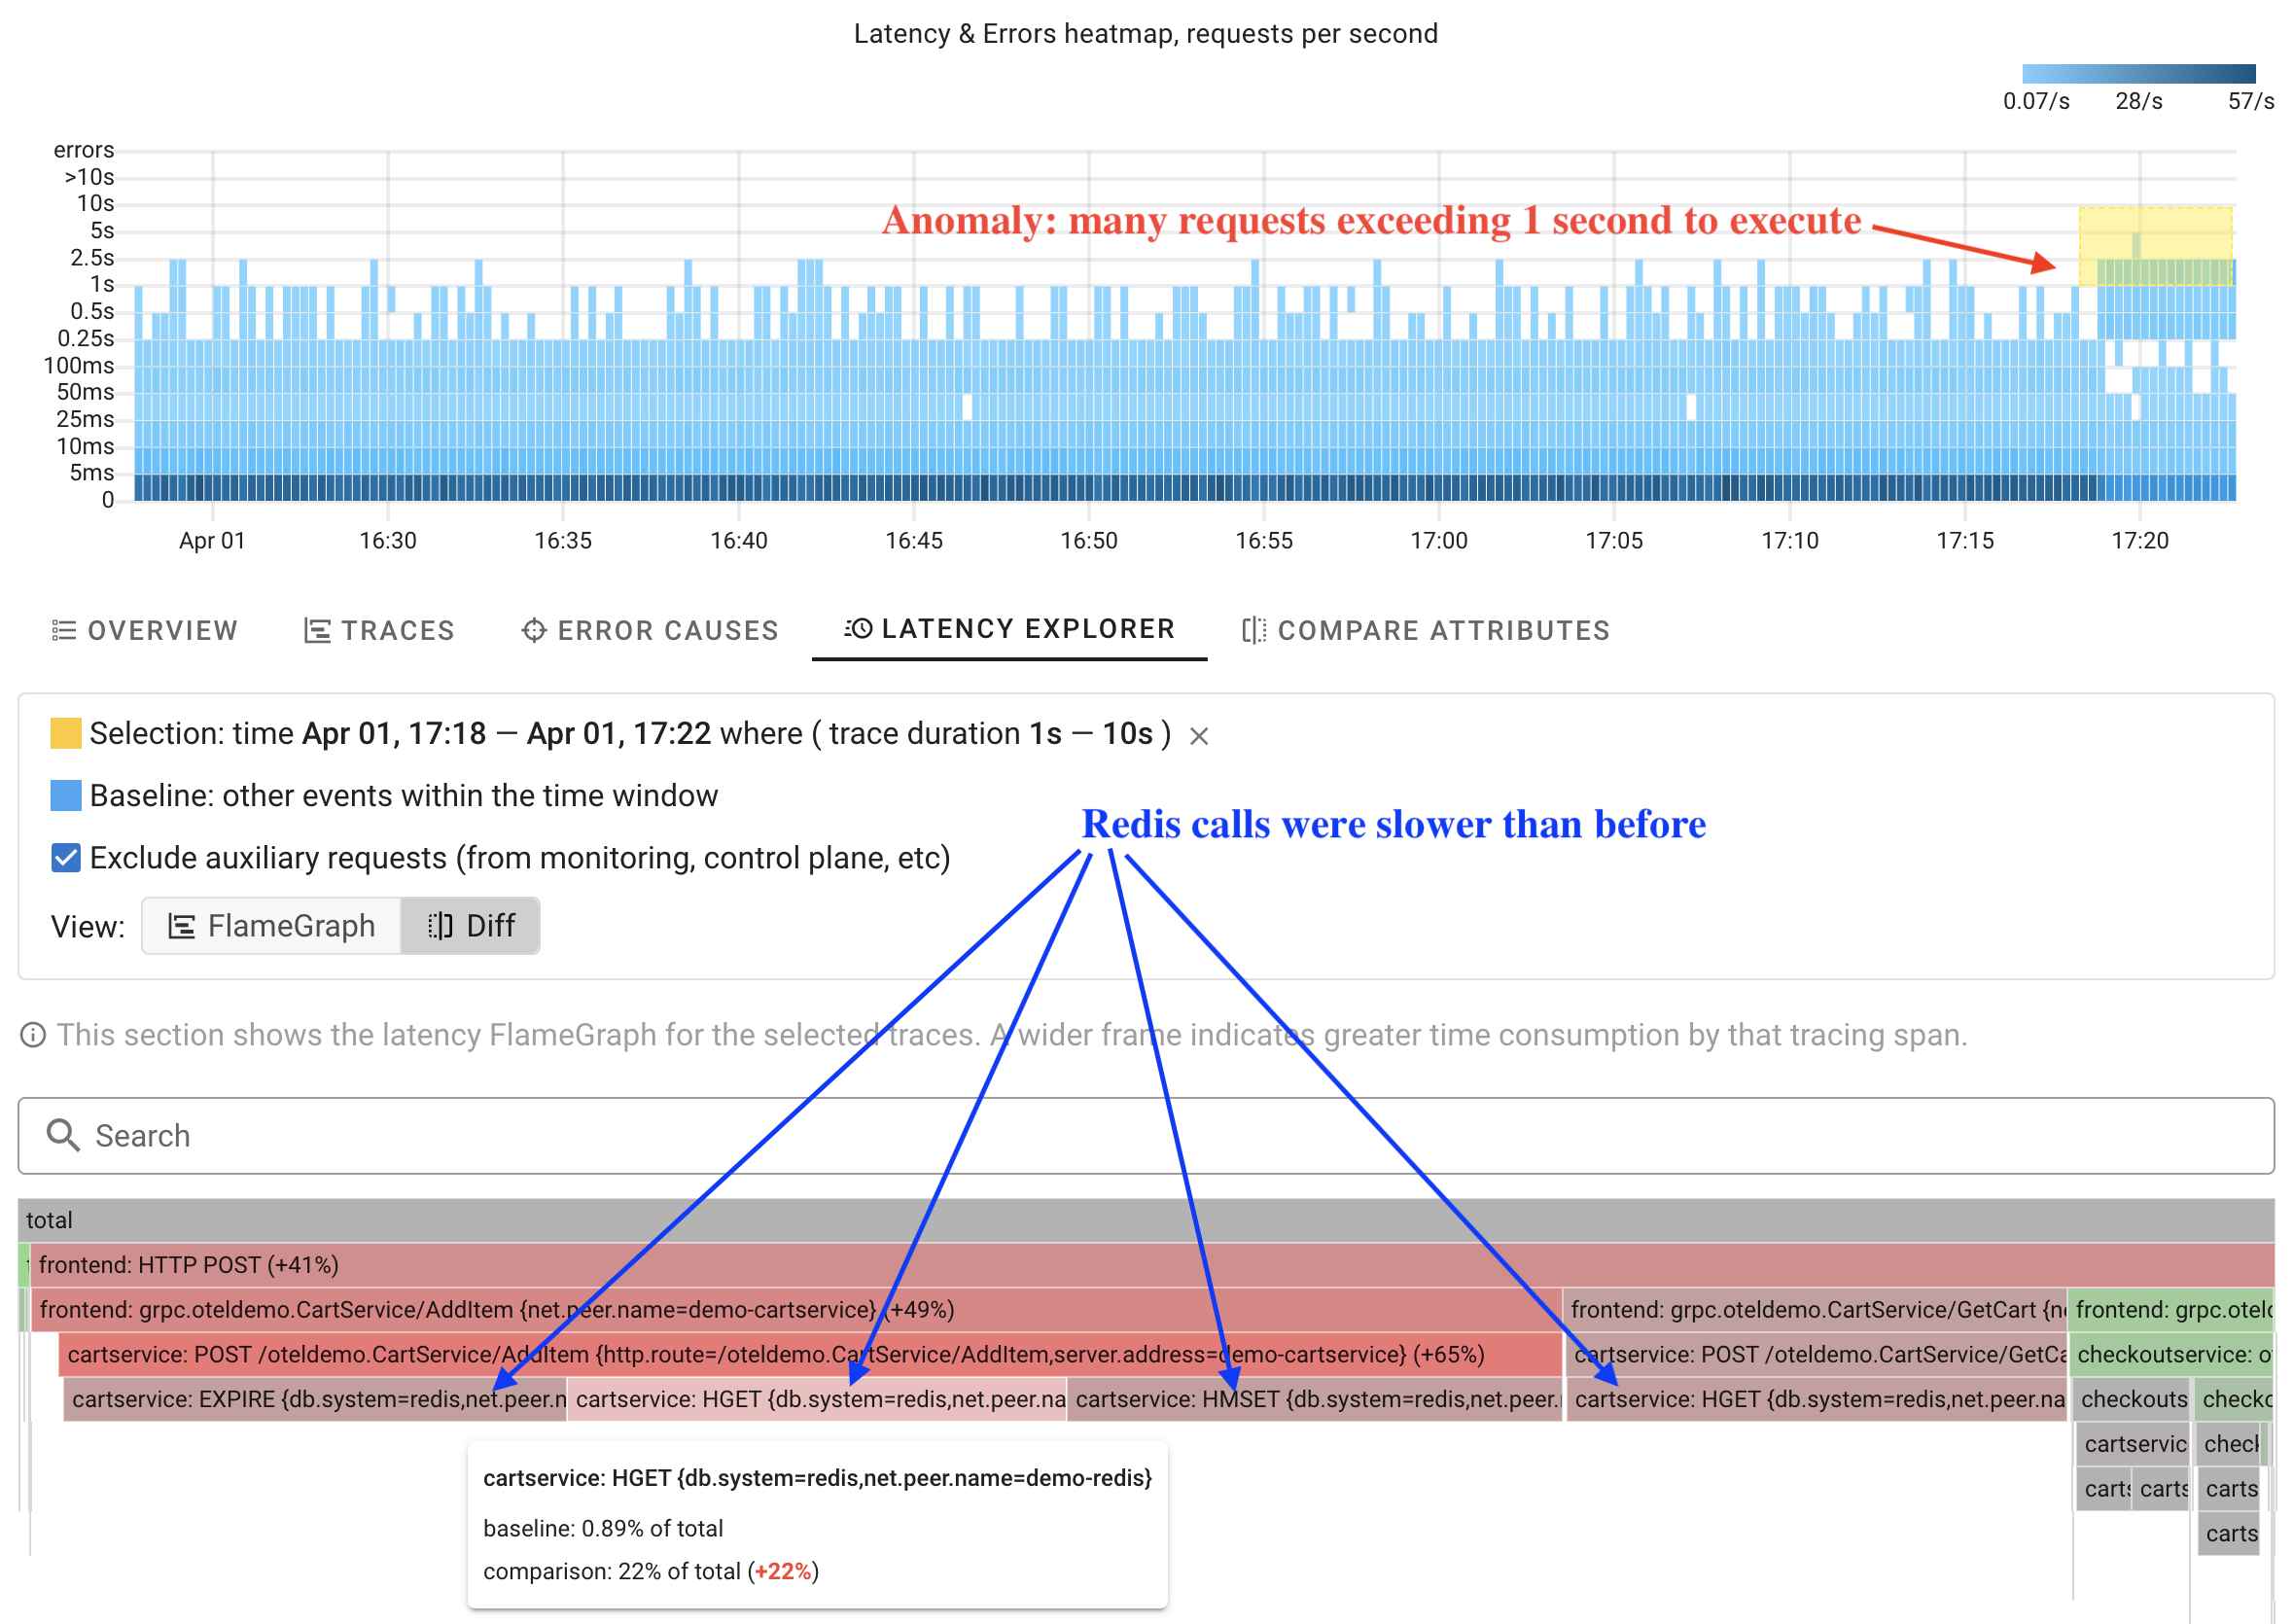
Instead of manually analyzing each trace within the anomaly, Coroot can analyze ALL of them and automatically compare operation durations with other requests in just a few seconds.
The screenshot shows a latency FlameGraph. A wider frame means more time is spent on that tracing span. In the comparison mode, Coroot highlights operations in red that take longer than before. This makes it easy to spot changes in the system's behavior at a glance.
How it works
Distributed tracing typically involves instrumenting each component of a distributed system to generate trace data. OpenTelemetry is a vendor-neutral, open-source project that provides a set of APIs, SDKs, and tooling for collecting and exporting telemetry data.
OpenTelemetry provides SDKs for many popular programming languages.
At Coroot, we consider ClickHouse to be the best open-source storage option for traces due to its low-latency querying, effective data compression, and rich SQL interface.