Storage
The storage inspections identify problems with the volumes an application uses:
- Disk I/O load: detects volumes whose I/O load is above the threshold (5 seconds/second by default). This is the situation where the application spends more time waiting for the disk than usual, because of its own workload or because another workload shares the same device.
- Disk space: detects volumes that are running out of space (80% used by default).
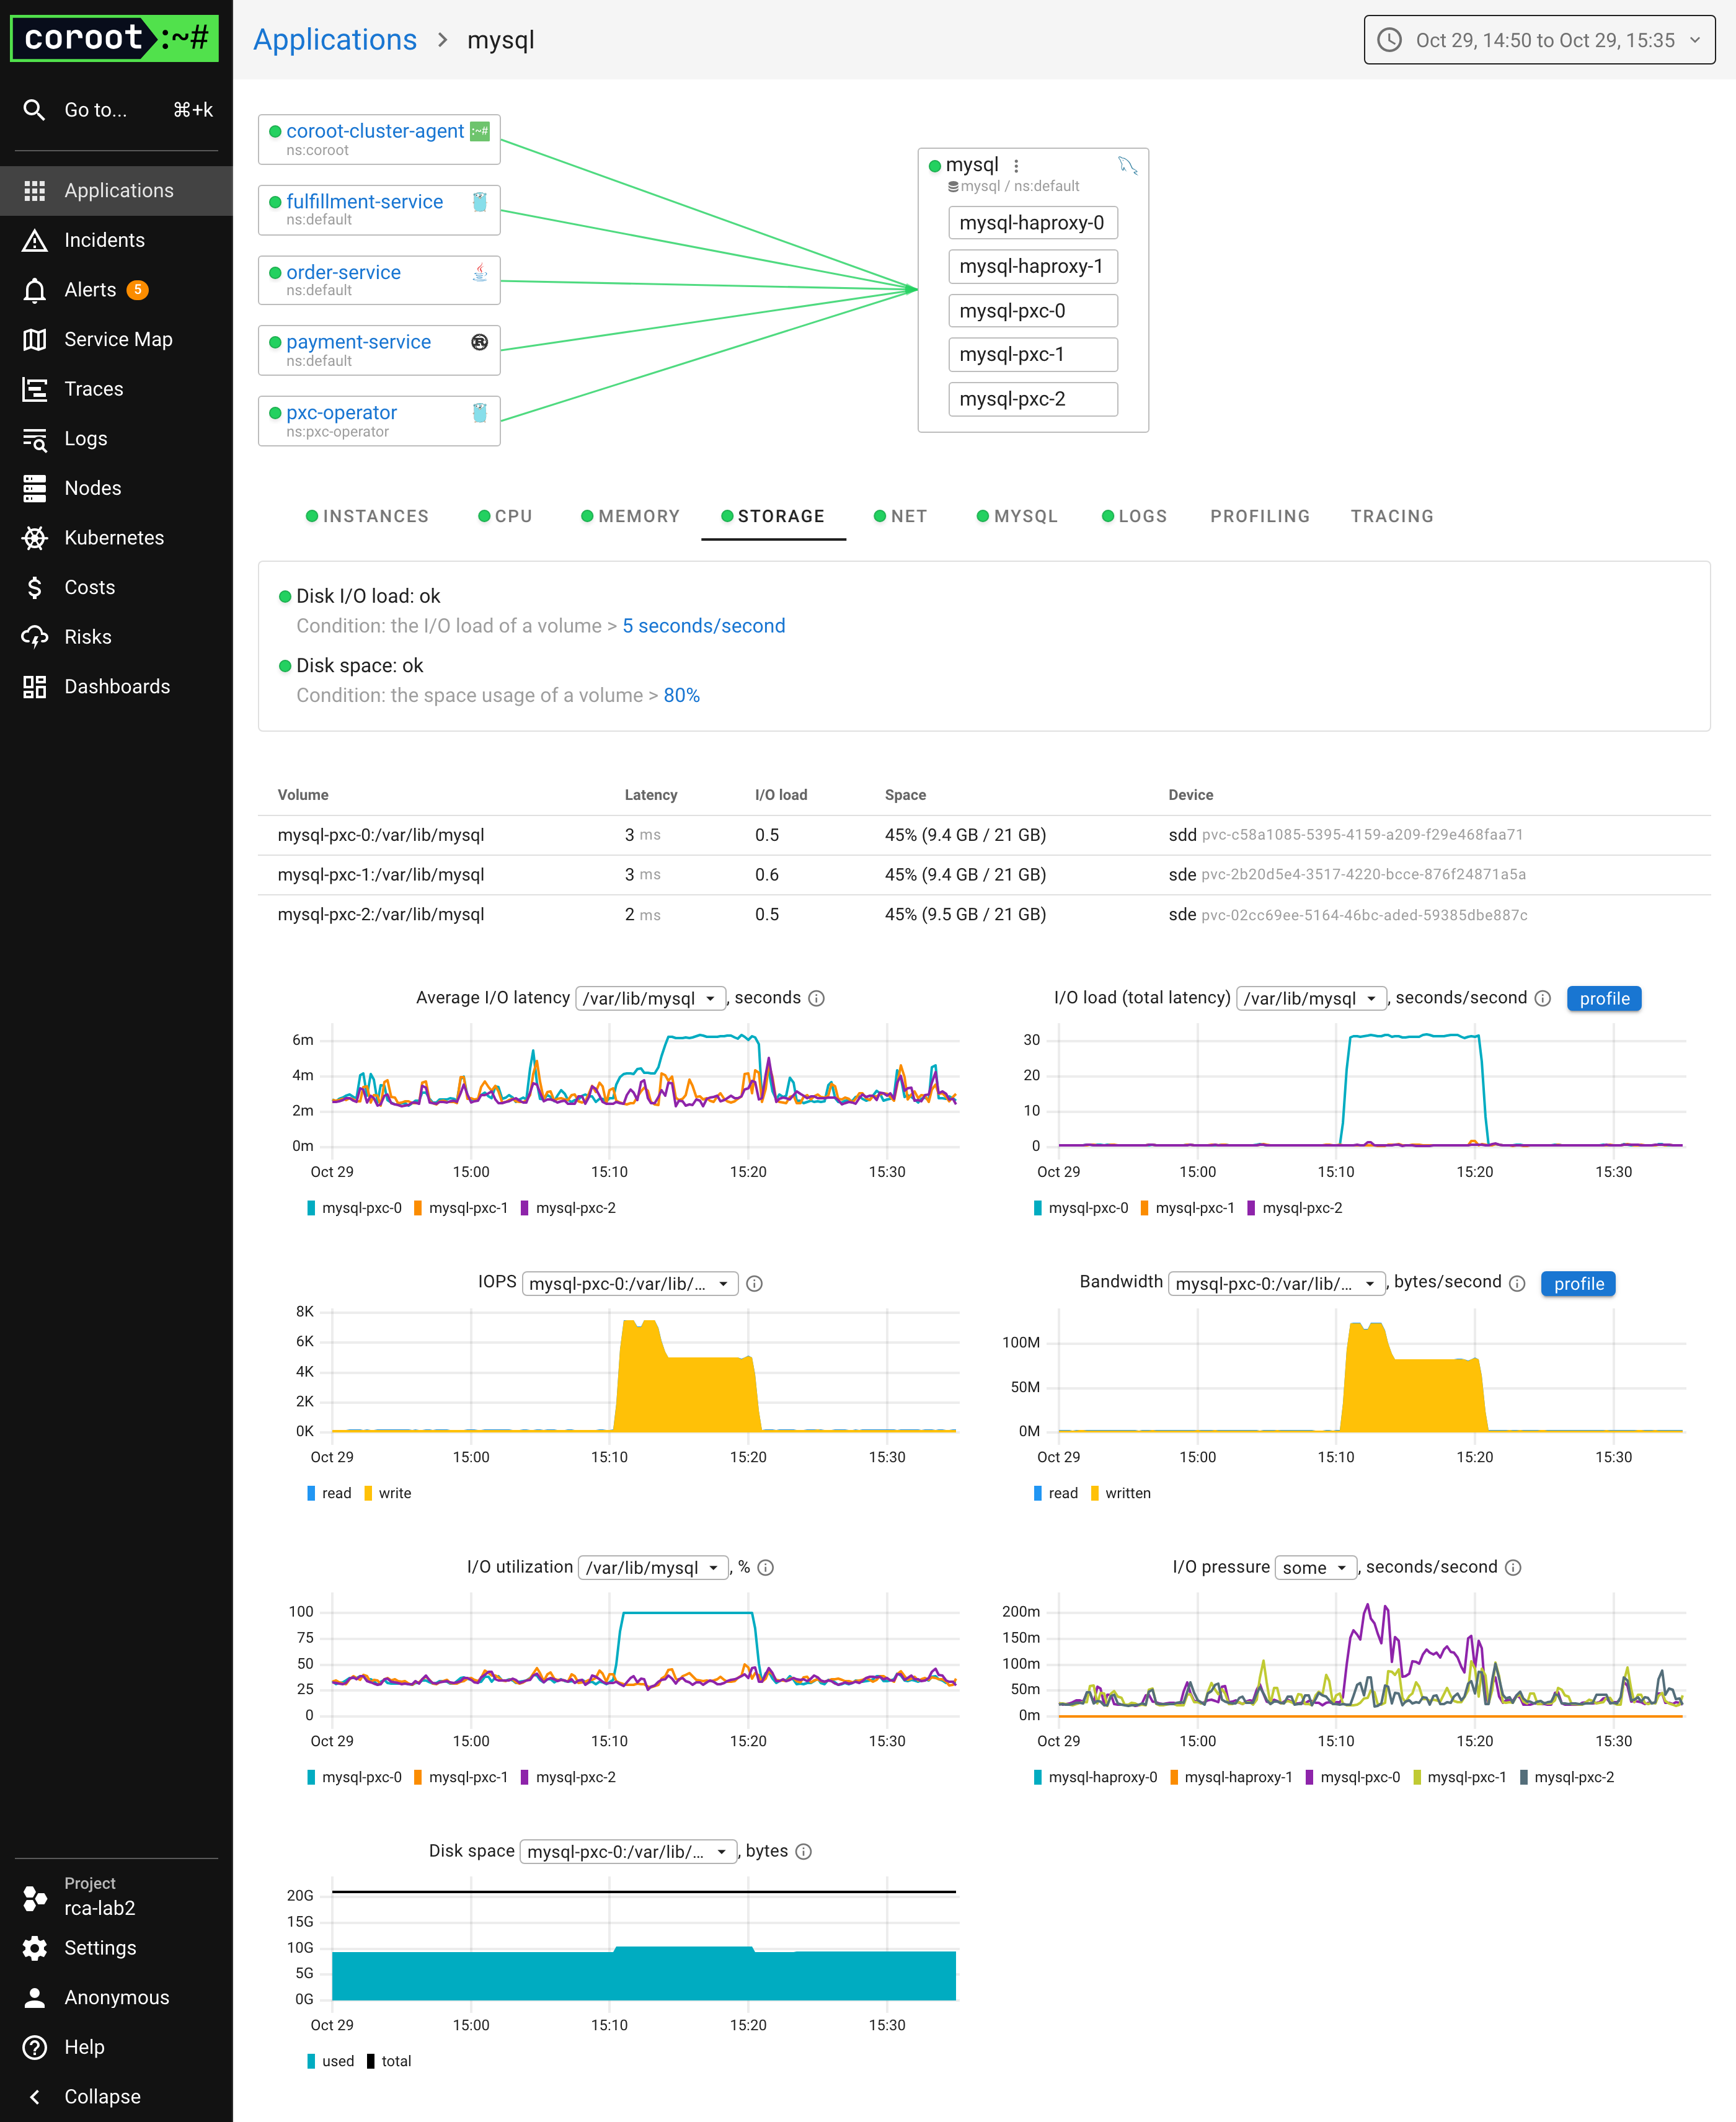
The screenshots on this page show a MySQL cluster whose writer node shares its data volume with another workload
that saturates the volume for 10 minutes. The affected volume is attached to mysql-pxc-0, the two other nodes are not affected.
Where the data comes from
For every volume, Coroot finds the block device behind it on the node and reads the device statistics from /proc/diskstats
through the node_resources_disk_* metrics. All the charts except I/O pressure are therefore per device: if two containers share a
device, they see the same numbers, which is exactly what a noisy neighbour looks like.
The volume table lists every volume of every instance with its device, latest latency, I/O load and space usage.
Dashboard
Average I/O latency
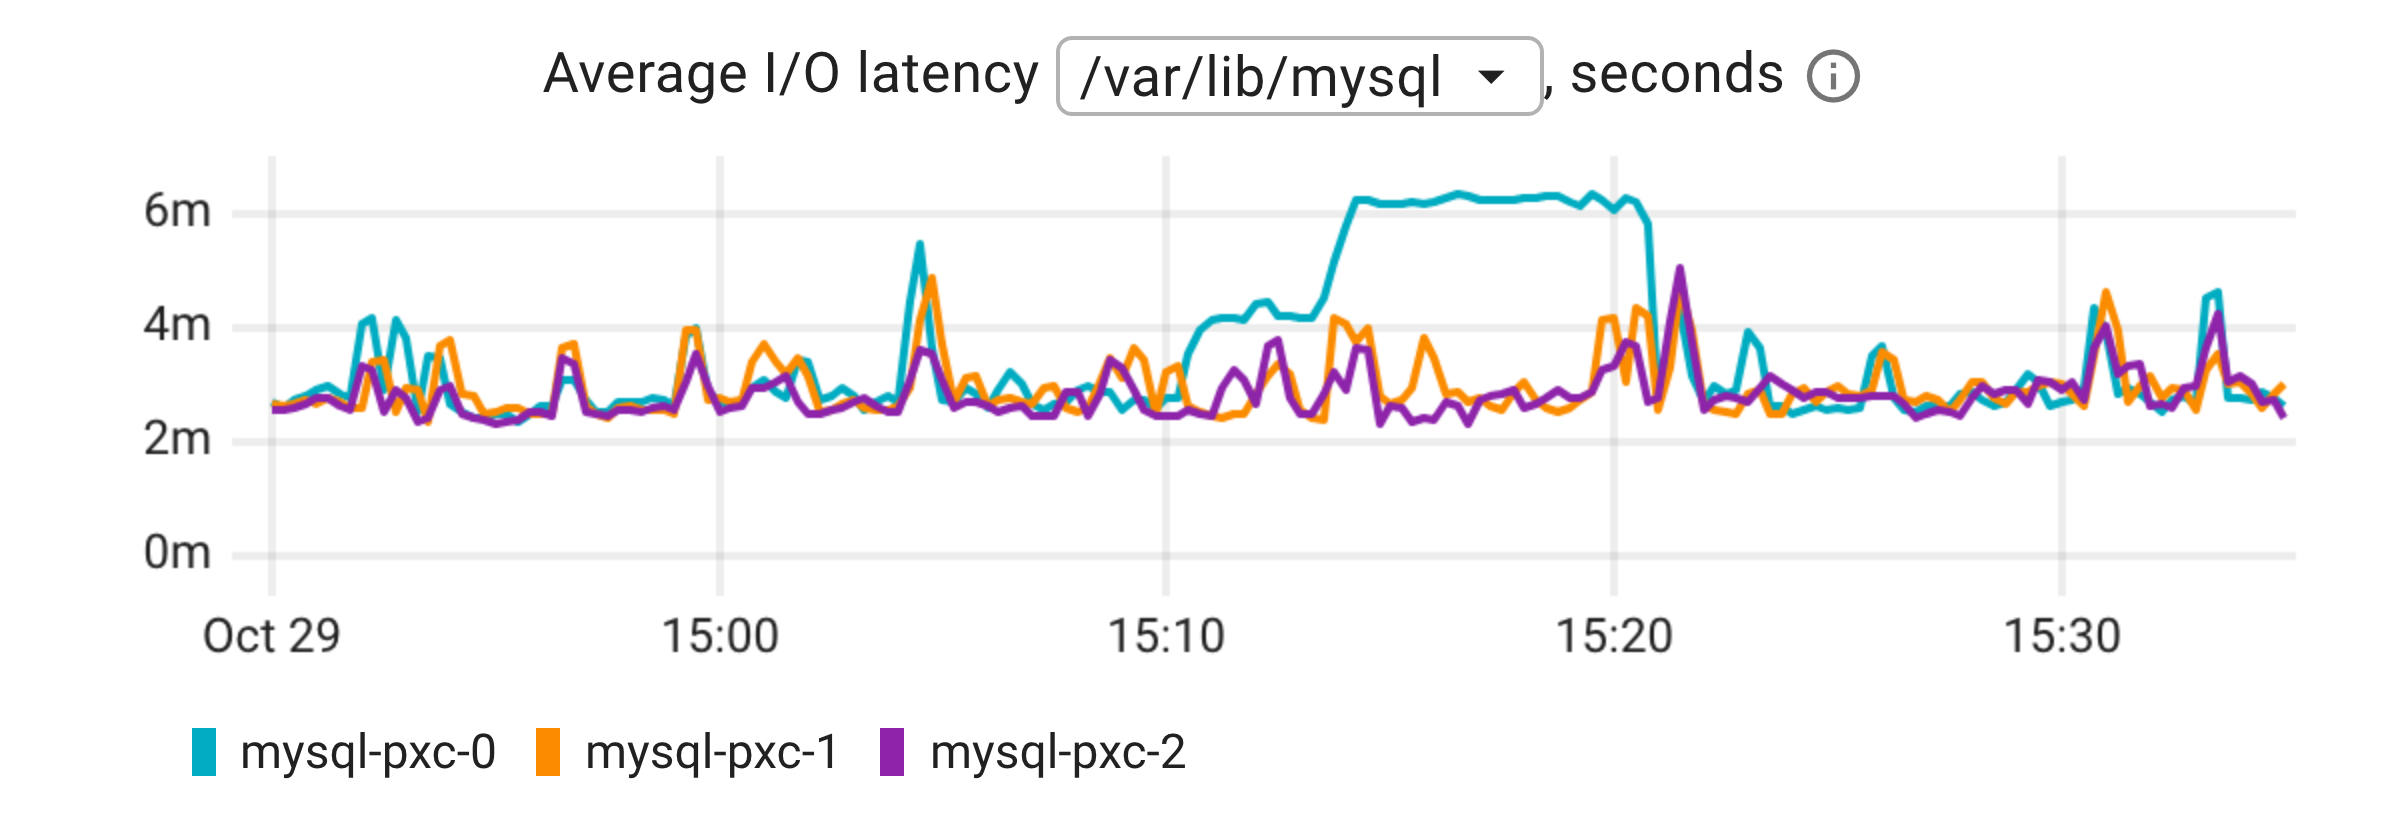
The average time a request to the device took, from being issued to the device until completion, in seconds.
It is calculated as (read time + write time) / (reads + writes) over the interval.
The featured view compares the instances using the same mount point, the per-volume views split the latency into reads and writes.
Latency is the most direct health signal of a device. On a healthy SSD it stays in the sub-millisecond to low-millisecond range, and a network or cloud volume typically stays below a few milliseconds. A latency increase without a change in the application's own IOPS and bandwidth points at the device, or at another workload sharing it.
I/O load
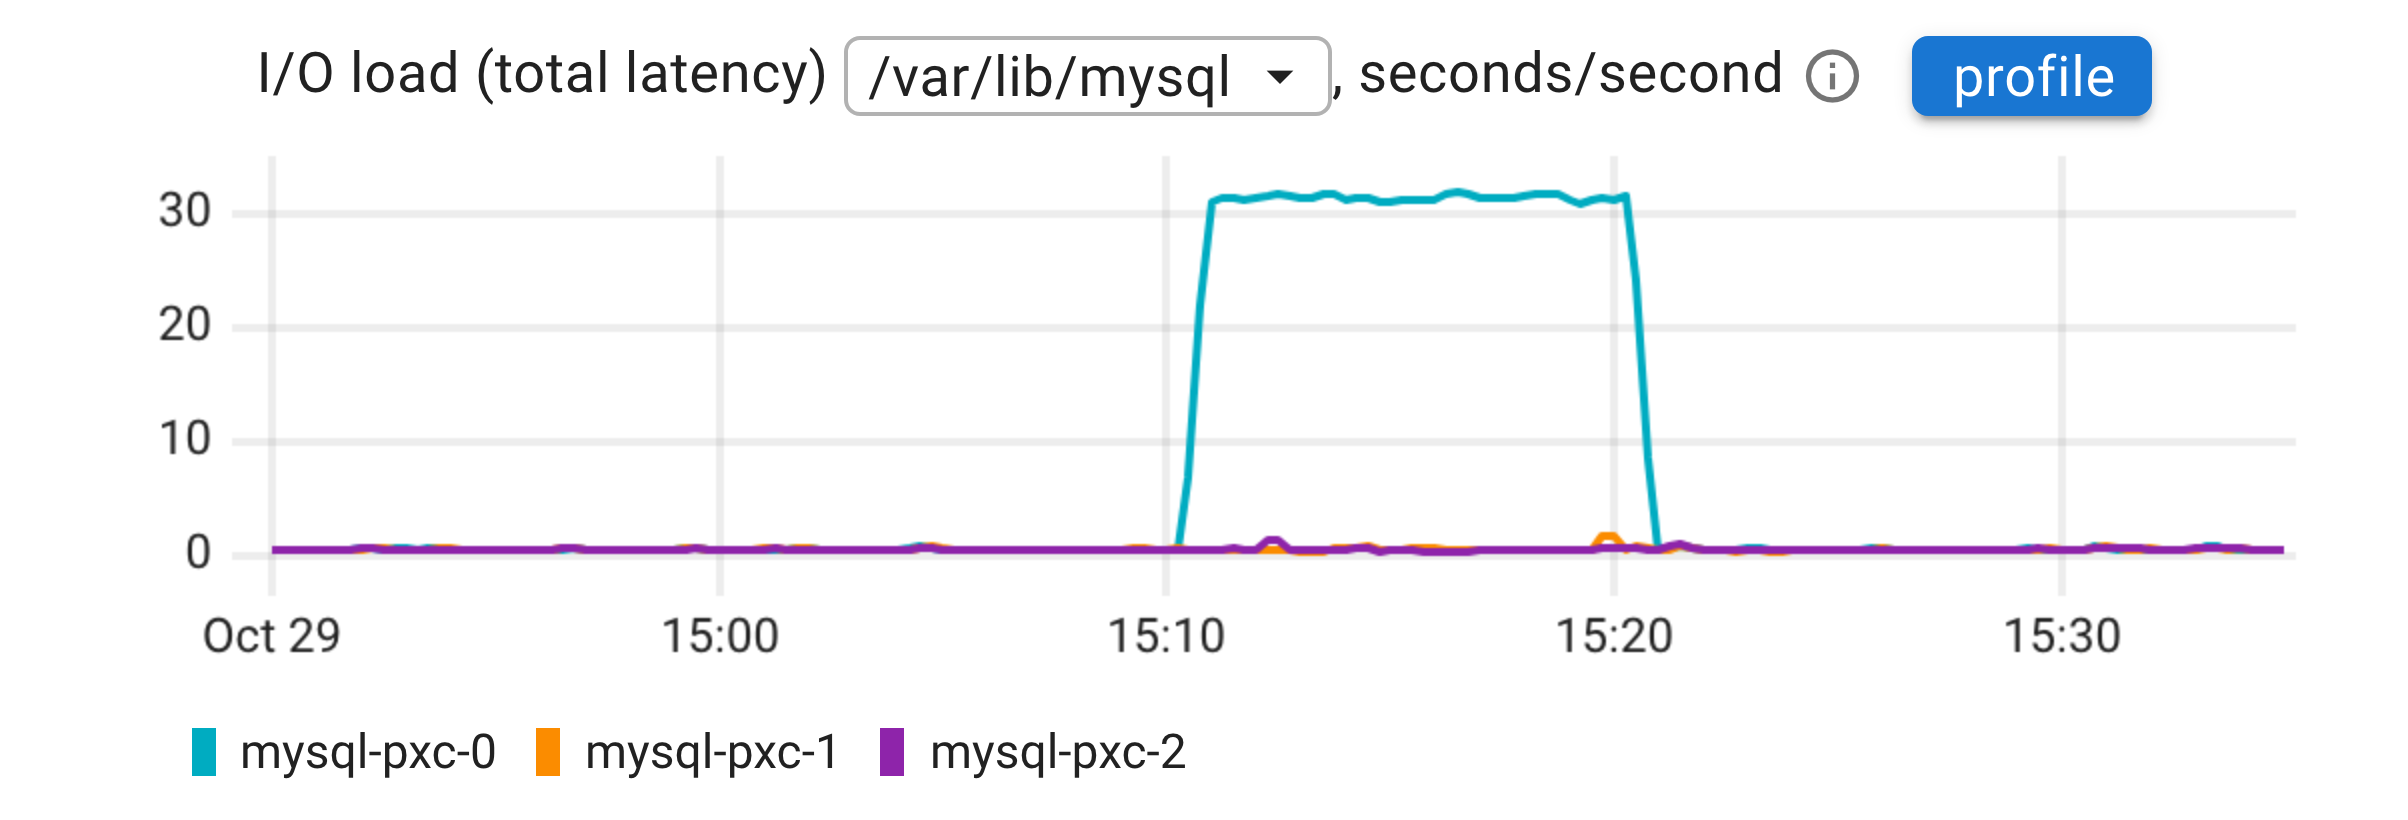
The total time spent by the device serving requests per second: (read time + write time) per second, in seconds/second.
Because the latency of concurrent requests adds up, this value equals the average number of requests in flight on the device.
A load of 30, as on the screenshot, means that at any moment 30 requests were queued or being served.
This is the disk equivalent of the CPU load average, and it is the metric behind the Disk I/O load inspection. It grows with both IOPS and latency, so it reacts to an application issuing more requests as well as to a device that became slower.
The profile button opens the Disk I/O time profile: the same quantity, seconds of block I/O per second, broken down by the code paths of the application that issued the requests.
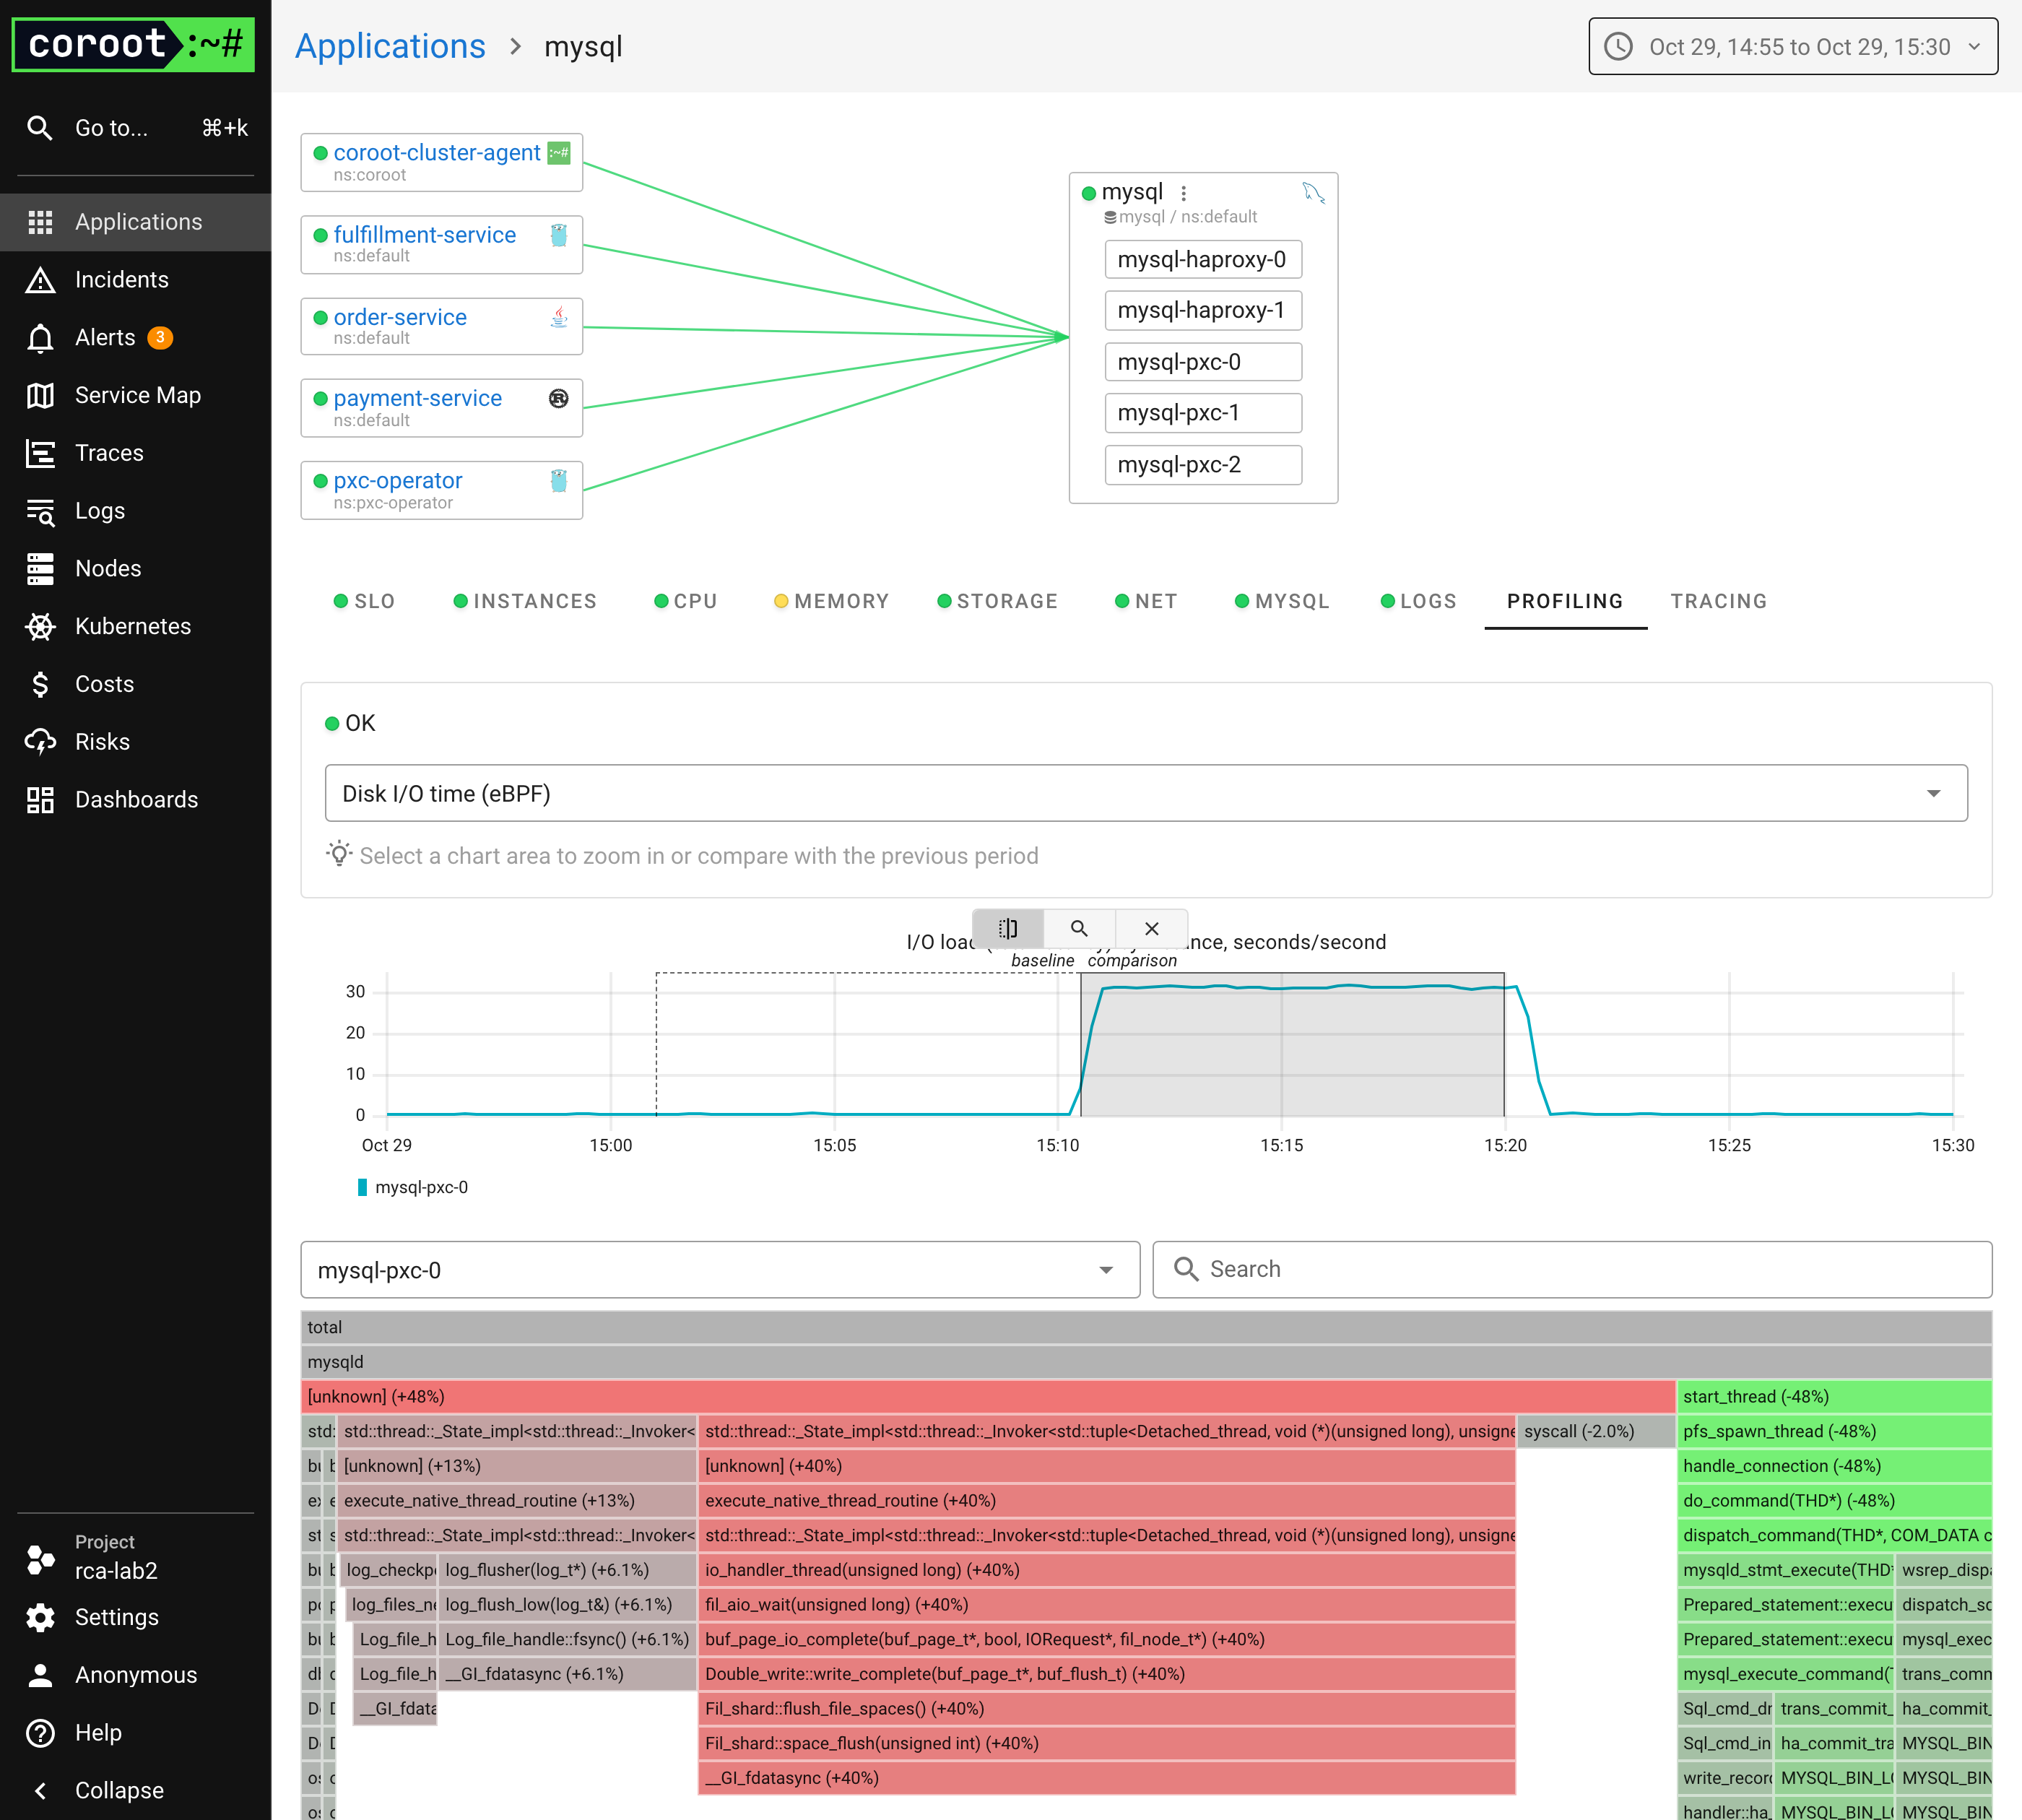
On the screenshot, the incident is selected on the chart and compared with the period before it for the affected instance.
The profile explains the I/O load spike above: the I/O time of fdatasync in InnoDB's doublewrite completion path grew by 40%,
so the slow volume stalls page flushing, not the queries themselves.
IOPS
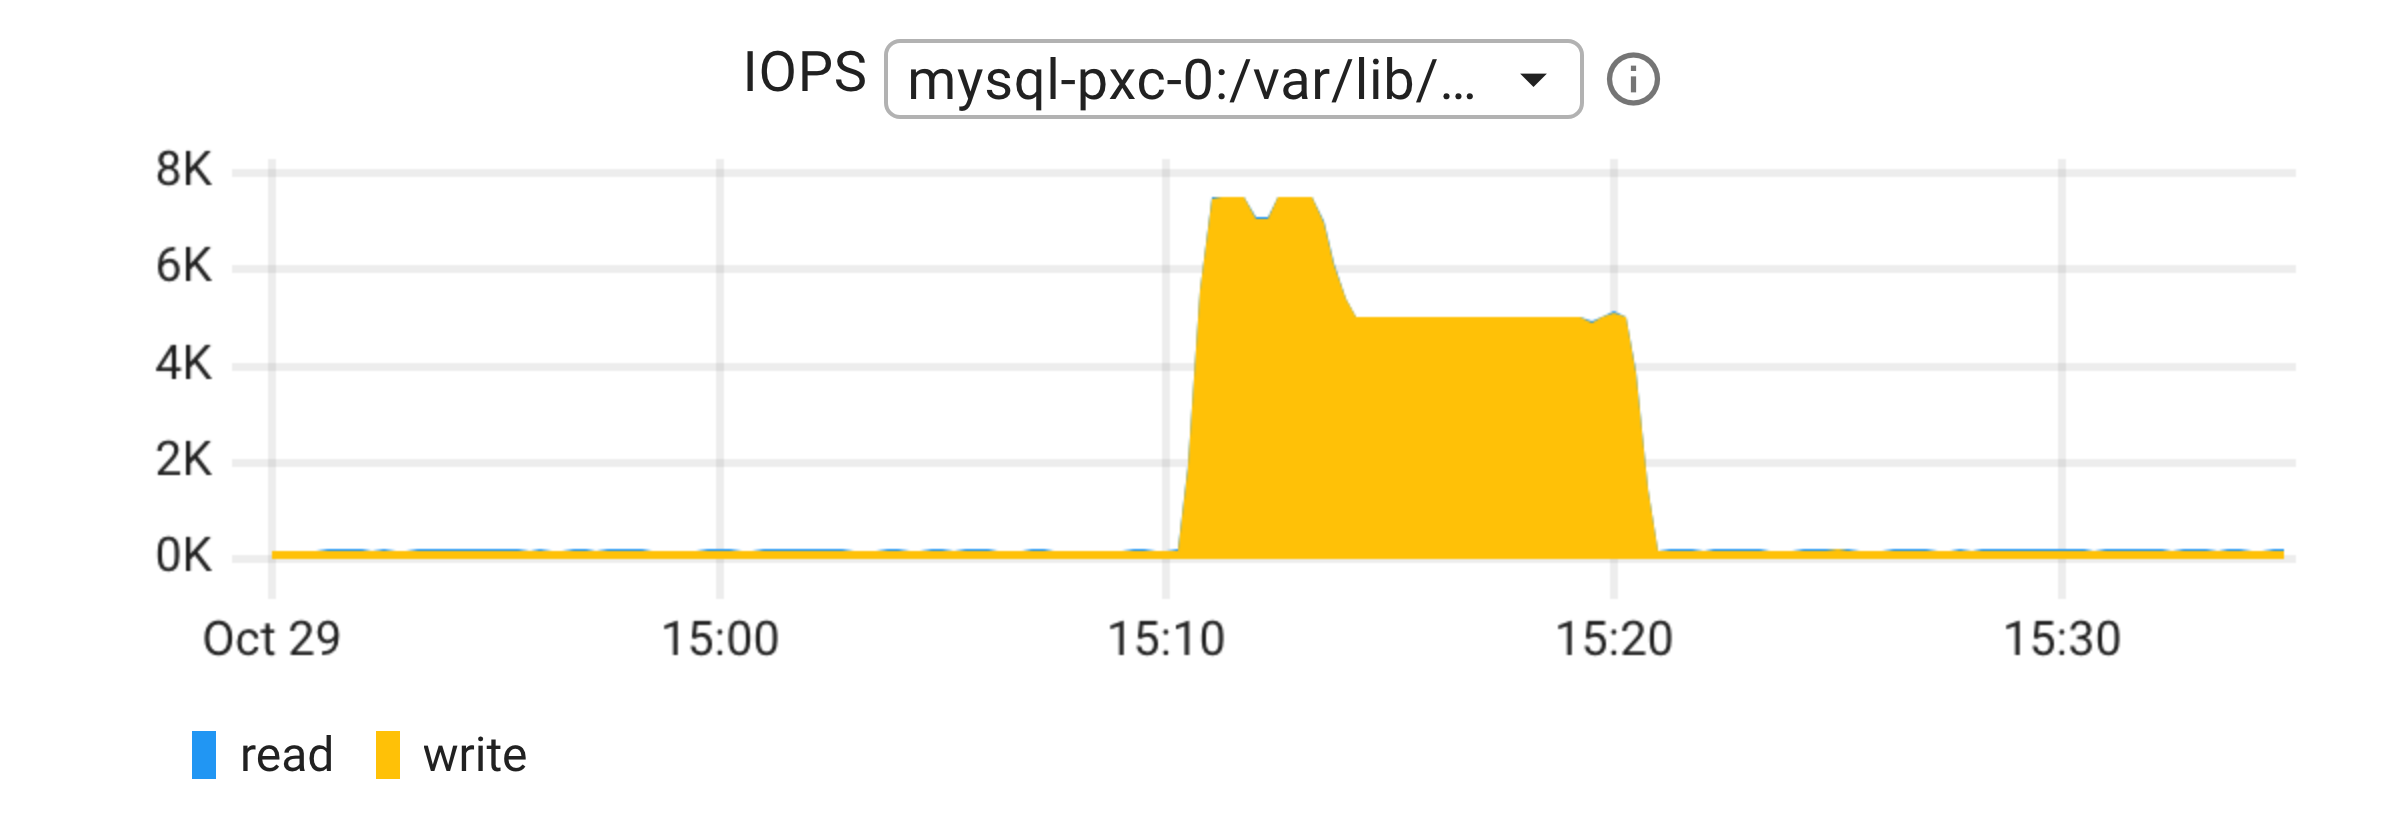
The number of read and write requests completed per second by the device of the selected volume. Compare it with the latency chart: more requests at the same latency is a workload change, the same requests at a higher latency is a device or neighbour problem.
Bandwidth
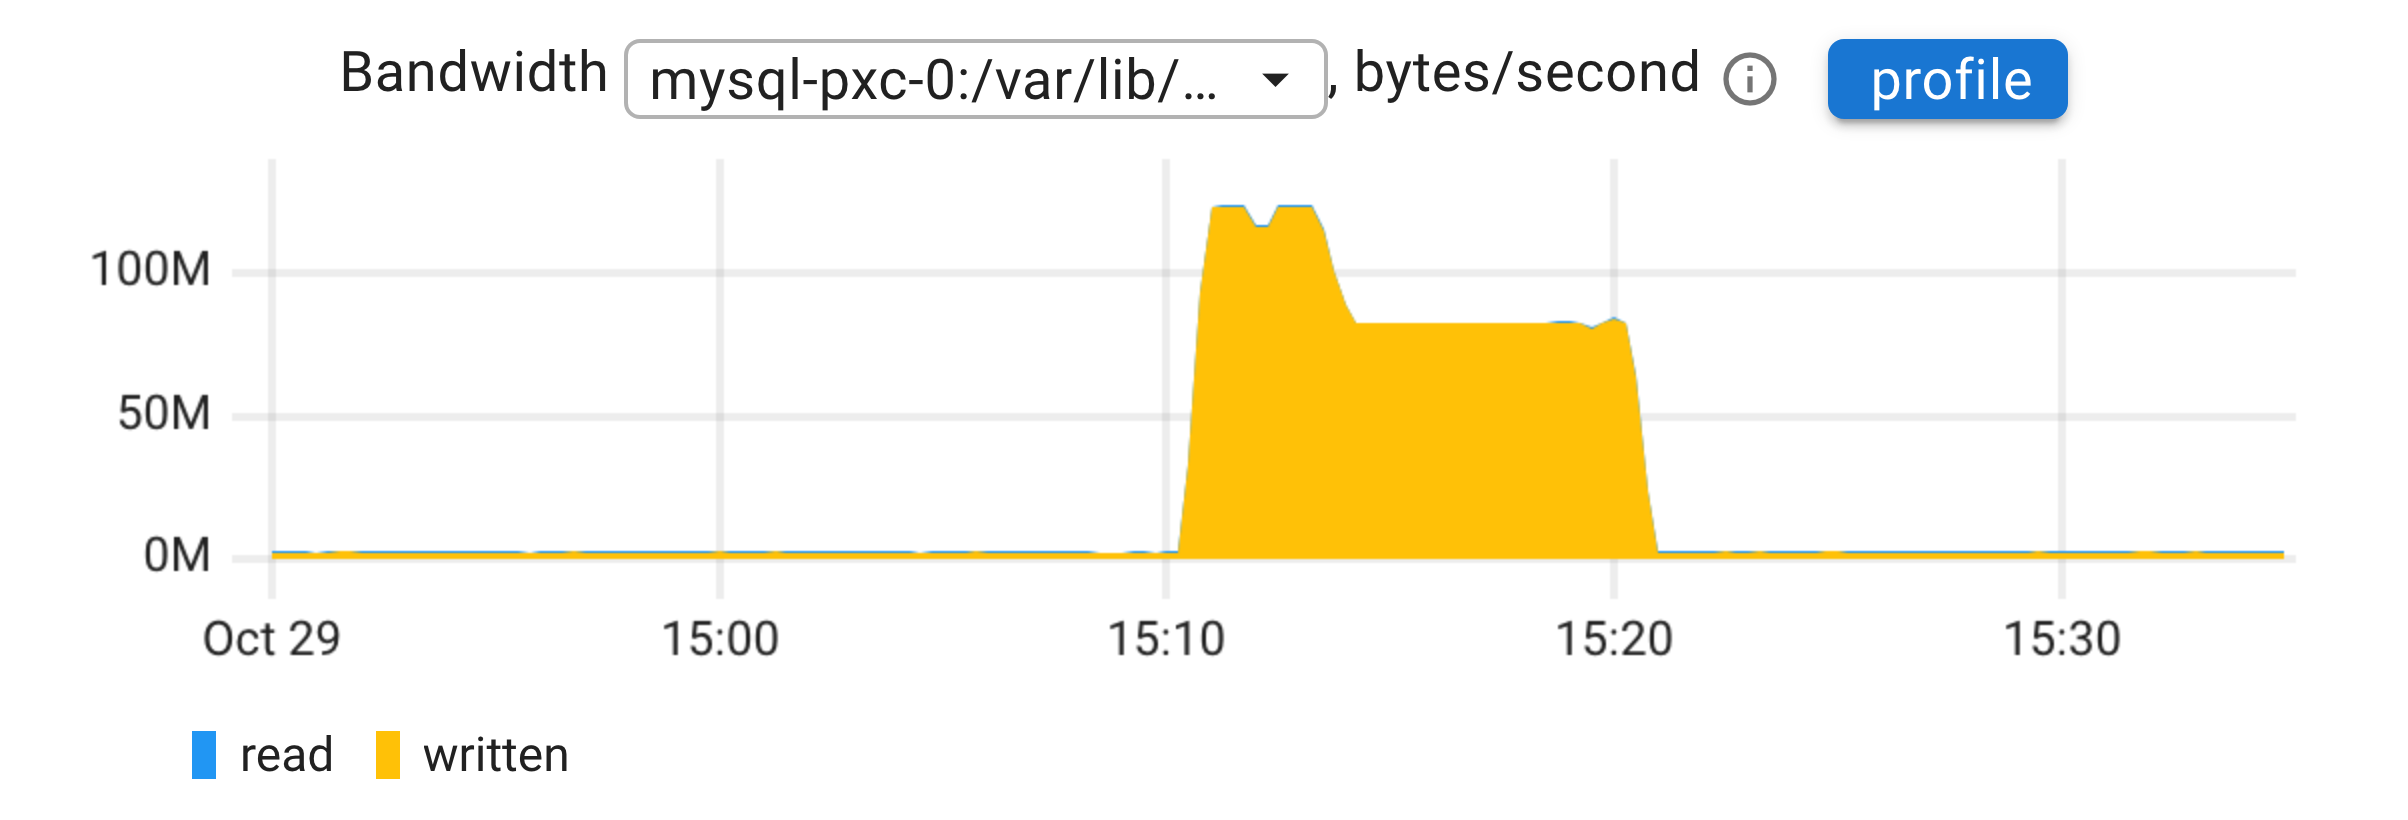
The number of bytes read from and written to the device of the selected volume per second.
The profile button opens the Disk read bytes or Disk write bytes profile, depending on which direction dominates on the volume, to see which code paths of the application move the data. Note that only the data the application itself submits to the block layer is attributed: buffered writes are issued later by the kernel's writeback threads and show up on the chart, but not in the application's profile.
I/O utilization
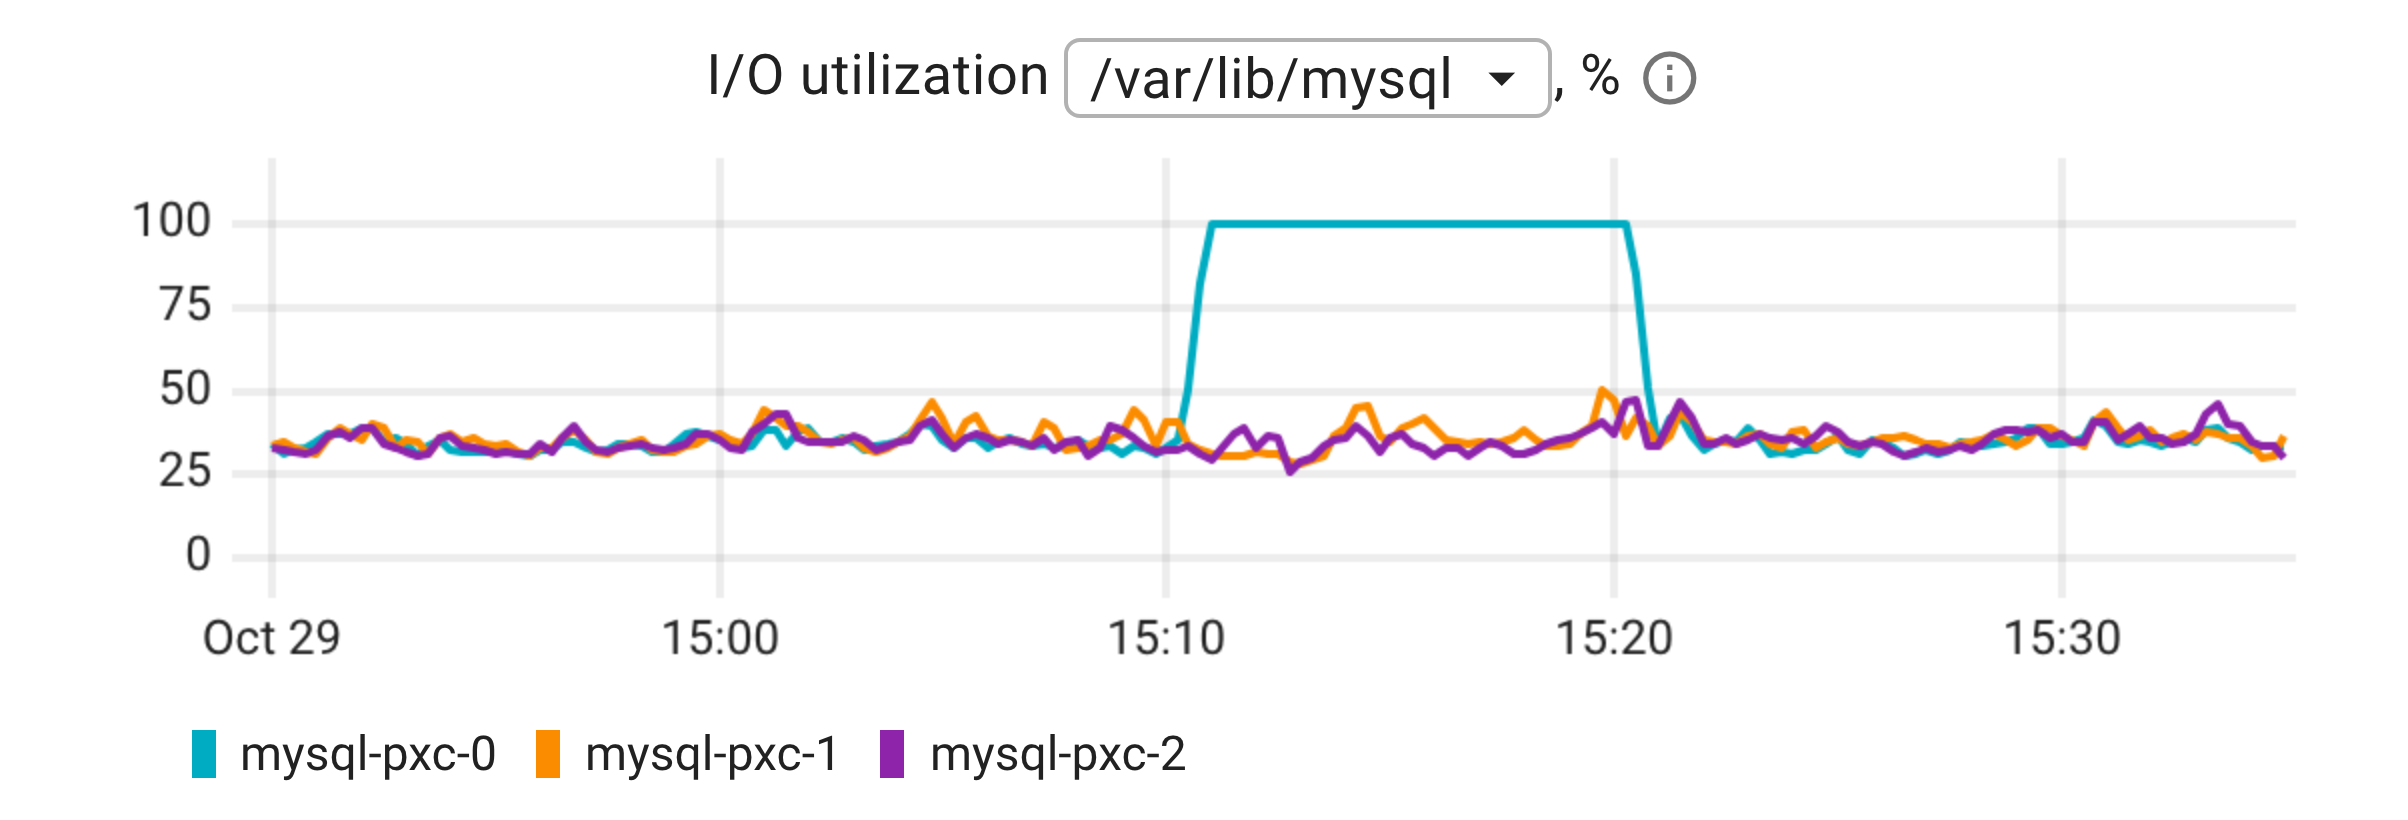
The percentage of time the device had at least one request in flight.
100% utilization does not mean the device is saturated: SSDs, NVMe devices and cloud volumes serve many requests in parallel, so a device can be busy all the time and still have spare capacity. Use latency and I/O load to judge saturation, and utilization to tell an idle device from a busy one.
I/O pressure
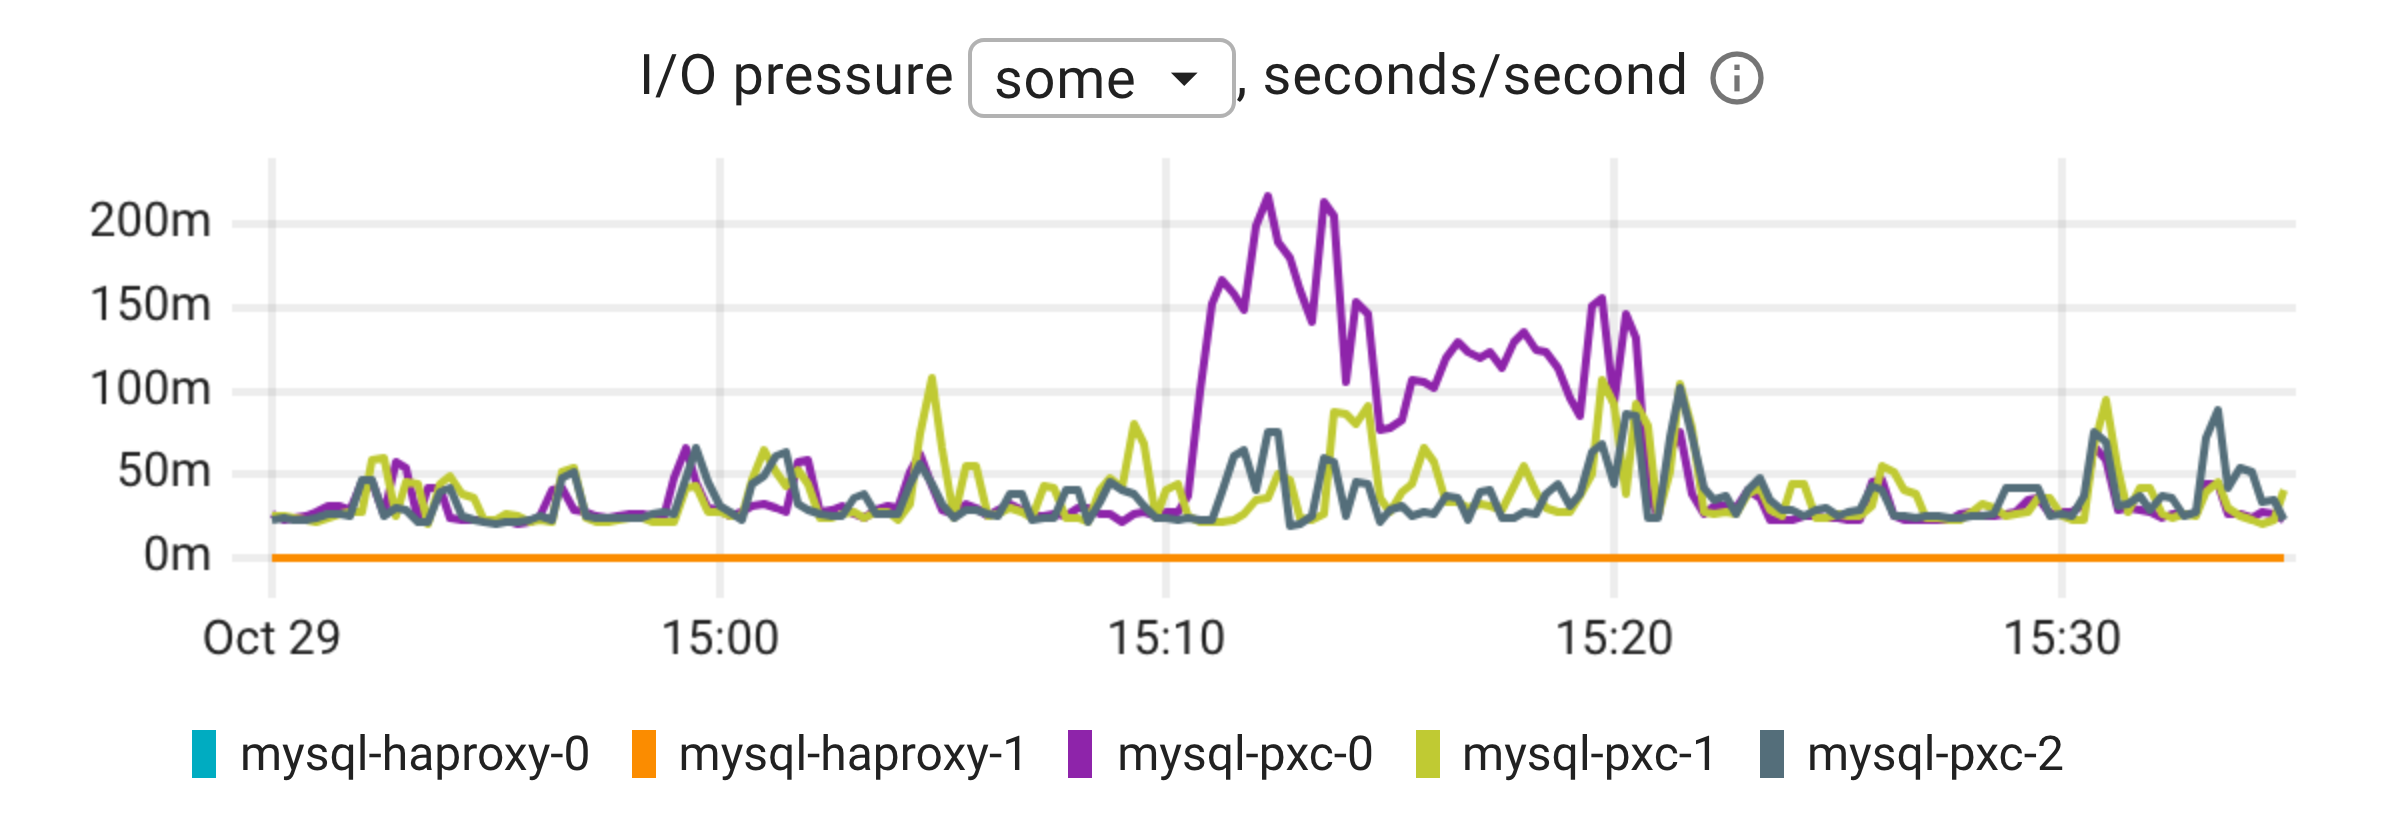
Unlike the other charts, this one is measured on the application's containers, not on the device.
It is the kernel's Pressure Stall Information for I/O, read from the io.pressure
file of each container's cgroup and summed over the containers of an instance (container_resources_io_pressure_waiting_seconds_total).
- some: the share of wall-clock time during which at least one task of the container was stalled waiting for disk I/O. A value of 0.2 seconds/second means the application spent 20% of the time with at least one thread blocked on the disk.
- full: the share of time during which all tasks of the container were stalled on I/O at the same time, so the container made no progress at all.
I/O pressure answers a different question than the device charts: not "is the disk busy", but "did this application actually wait for it".
A device can be saturated by a neighbour while the application barely notices because its working set is in memory, and the pressure stays flat.
Conversely, a single slow fsync every second produces no visible device load and still shows up as pressure.
Keep two properties in mind when reading it:
- It is capped at 1 second/second and does not grow with the number of waiting threads. Ten threads waiting at once count the same as one, so a database with many client connections behind a single I/O thread shows modest pressure even when the I/O load and the I/O time profile grow tenfold. Threads waiting on a lock held by the thread doing the I/O are not counted either.
- Only tasks sleeping in the kernel on I/O count. Applications that submit I/O asynchronously (
libaio,io_uring) and keep working while the requests are in flight report little pressure.
Pressure on cgroup v1 nodes is not available, the chart is empty there.
Disk space
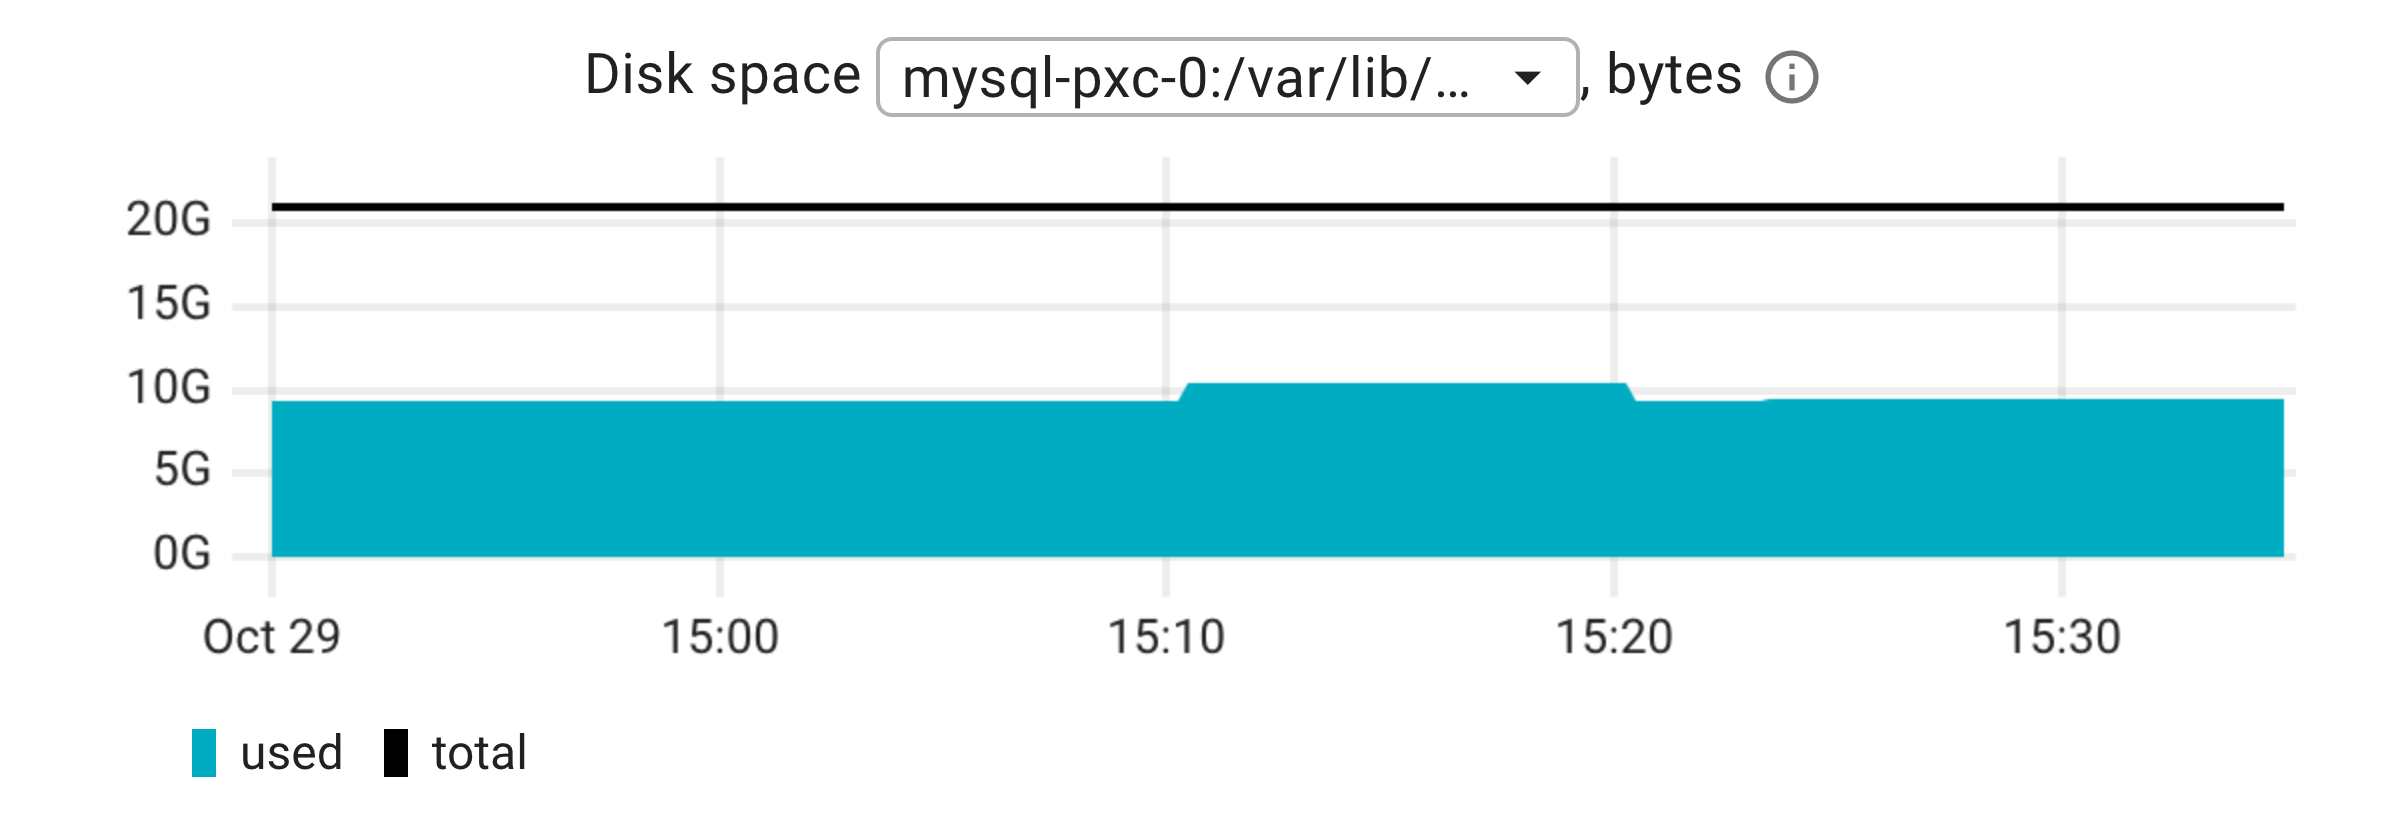
Used space against the capacity of each volume, based on container_resources_disk_used_bytes and container_resources_disk_size_bytes.
The Disk space inspection fires when a volume is used above the threshold, 80% by default.