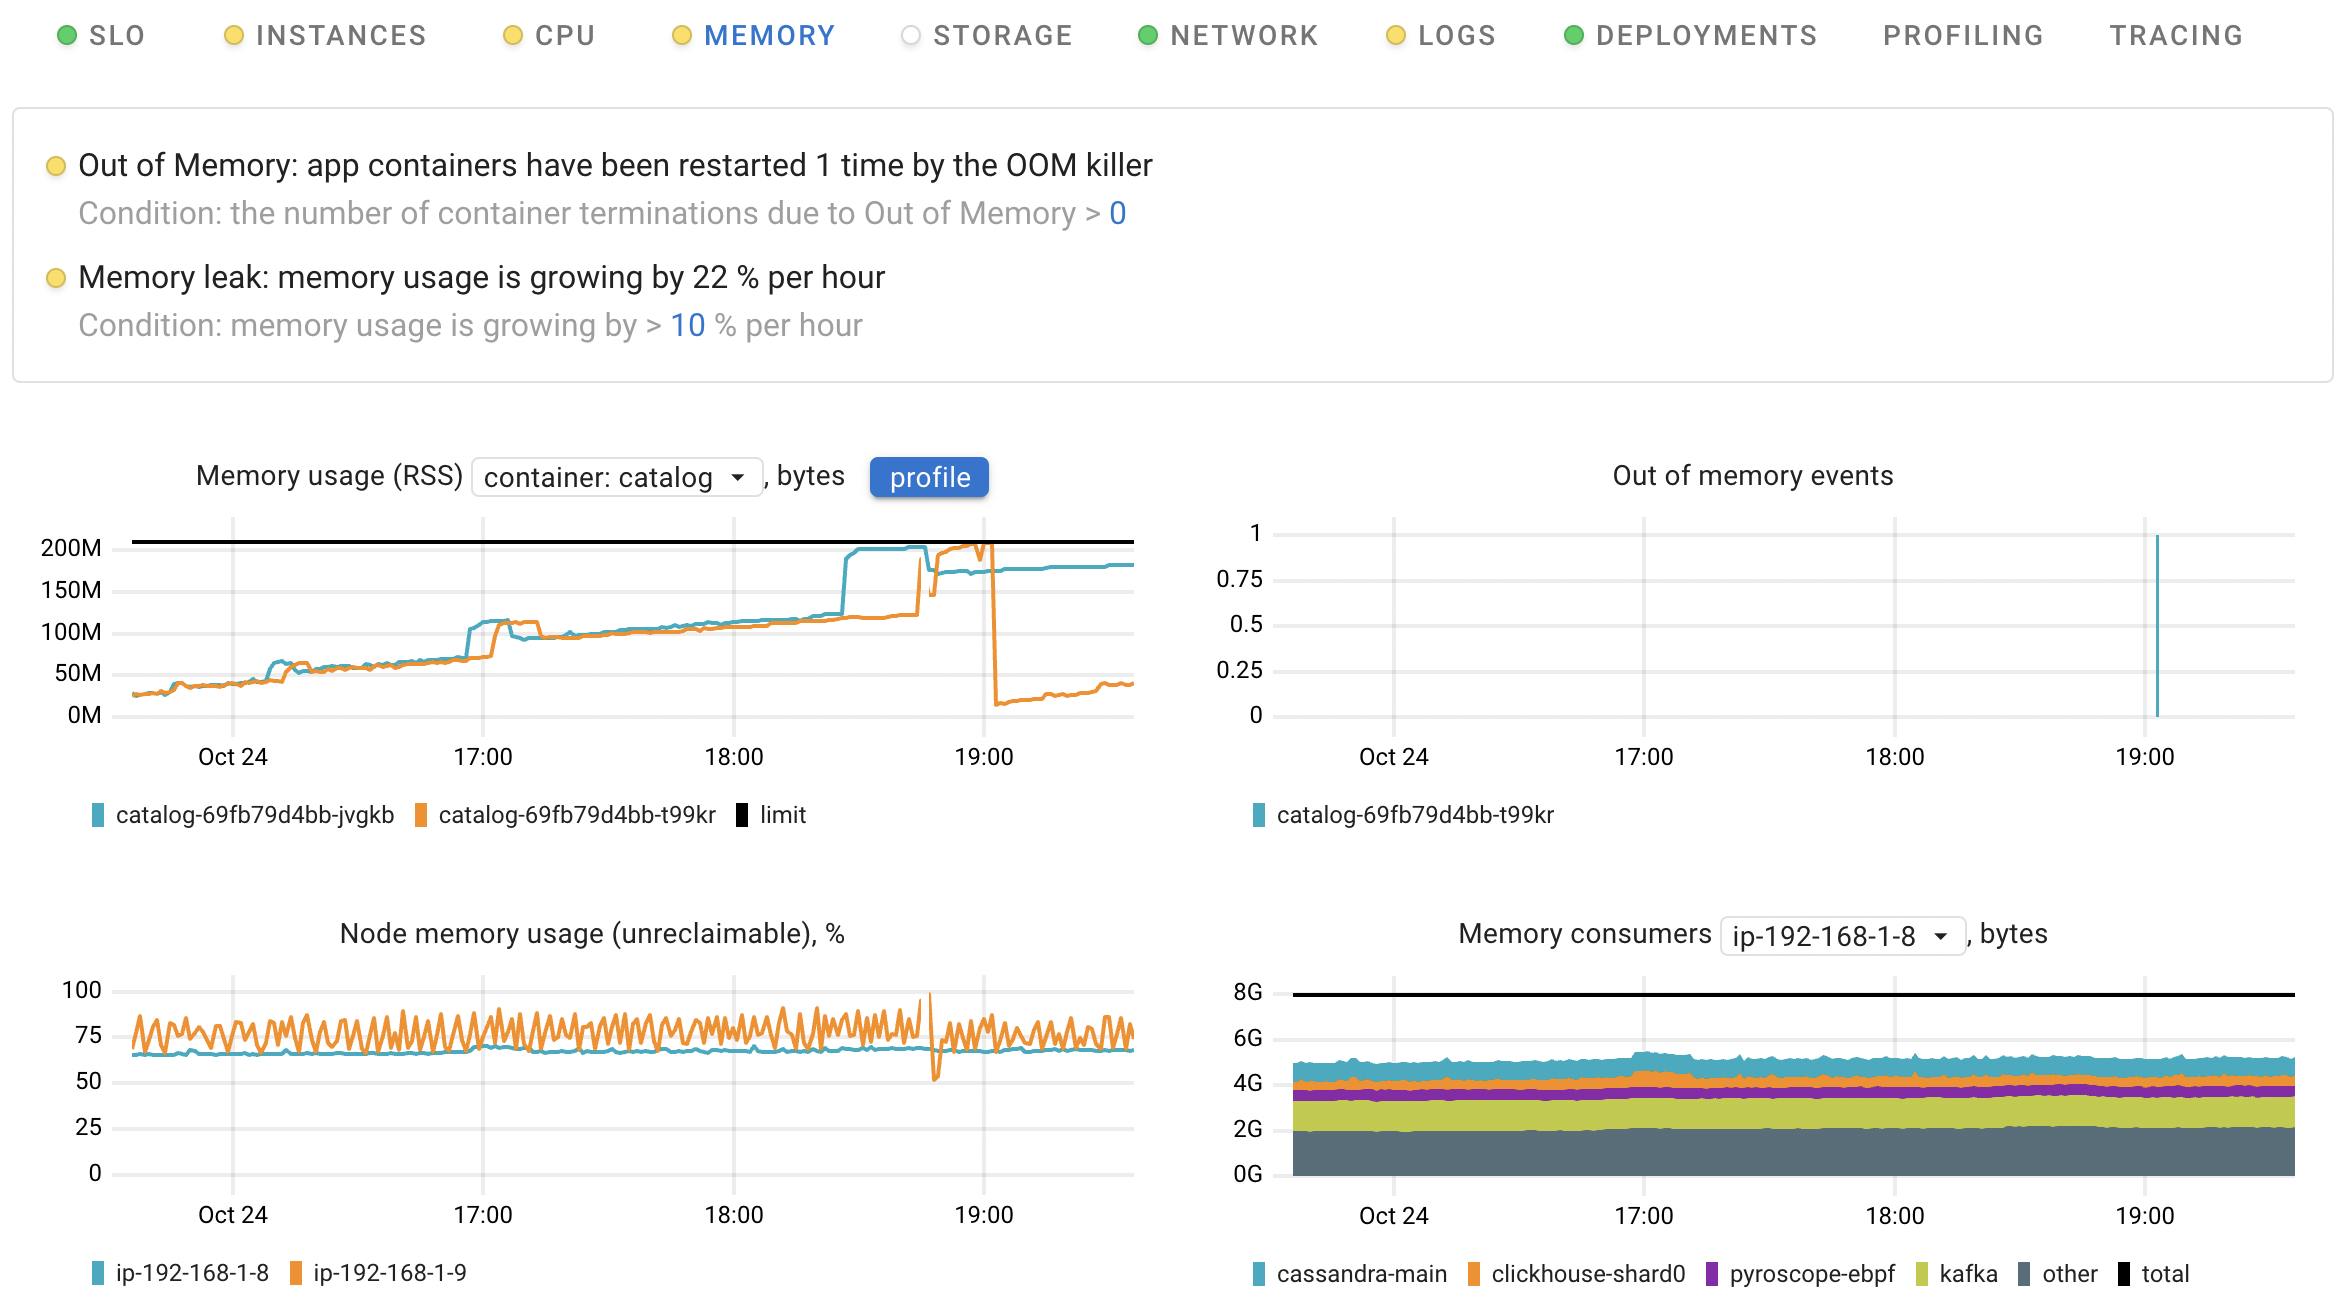
Memory
These memory inspections identify problems with the application's memory:
- Out of Memory: detects situations where an application's container has been terminated by the OOM (Out Of Memory) killer.
- Memory leak: monitors the memory usage of the app over time and detects memory leaks before the OOM killer restarts the application containers.
Possible failure scenarios
Out of Memory
There are several reasons why the OOM killer mechanism might terminate a process:
- If a container has reached its memory limit.
- If a top-level cgroup has reached its memory limit.
For example, Kubernetes limits the
kubepodscgroup to the size of allocatable memory on the node, so a container can be killed even if it has no memory limit. - If a node has run out of memory.
Though the terminated container will be restarted by a container runtime, this can affect the application SLIs (Services Level Indicators). For example, when a container is terminated, all its in-progress requests will fail.
In the worst cases of node-level OOMs, a node becomes unresponsive due to the low-memory condition. This means that every application on the node 'freezes', so not only the OOM Killer victim's SLI can be affected.
Coroot utilizes the container_oom_kills_total metric to identify which containers have been terminated.
Memory leak
Memory leaks typically occur when a program allocates memory dynamically during its execution but forgets to release it when it's no longer needed.
Coroot analyzes the container_resources_memory_rss_bytes metric per container to decide whether memory consumption is trending upward. The detection is deliberately conservative so it stays quiet on noisy, healthy applications:
- The RSS series is split at sharp downward steps (>50% drops) — those are process restarts (OOM-kill, crash, rollout). The longest run between restarts is analyzed, so a container that keeps being restarted doesn't hide an ongoing leak.
- A linear regression is fit over the analyzed run. The slope has to be positive, and the last ~25% of the run (or last 15 minutes, whichever is longer) must still be climbing at a comparable rate. This filters out one-time step-ups — e.g. an application that ramps up at startup and then plateaus.
- The predicted per-hour growth must be at least 5% of the container's memory limit (or 50 MB if no limit is set). This avoids misleading percentages when RSS is small (e.g. a container running at a few MB with tiny fluctuations reading as a high percentage leak).
- The longest post-restart run must cover at least one third of the inspection window — containers that thrash don't get flagged as leaks.
The default threshold for the reported per-hour growth rate is 10%.
Dashboard
Memory usage
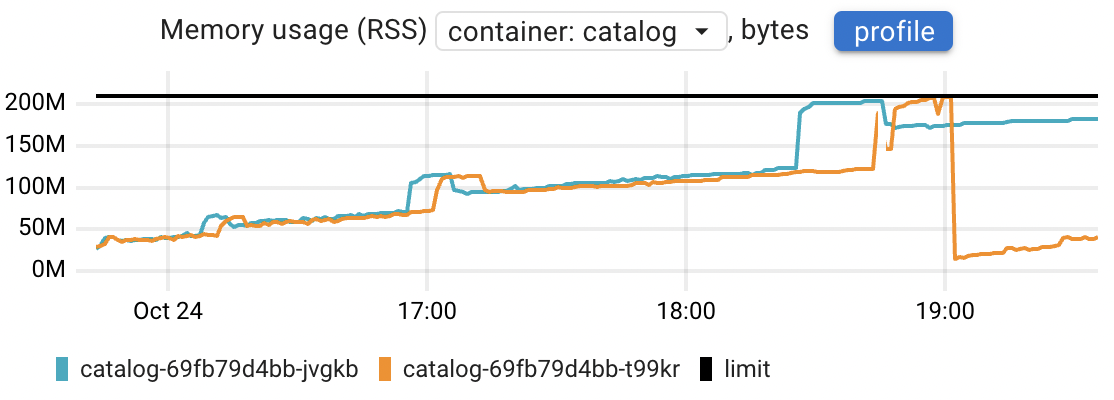
This chart can help you answer the following questions:
- Are all the application instances consuming the same amount of memory, or are there any outliers?
- How does memory consumption change over time?
- Assess the memory usage of each container in comparison to its limit.
Memory usage is calculated using the container_resources_memory_rss_bytes metric,
and does not take into account the amount of page cache memory allocated by the container.
If the application Pods contain more than one container, this chart provides you with both per-container and total views.
The profile button opens the memory profiling data, allowing you to identify and analyze unexpected spikes in memory usage down to the precise line of code.
Learn more about Continuous profiling in Coroot.
Out of memory events
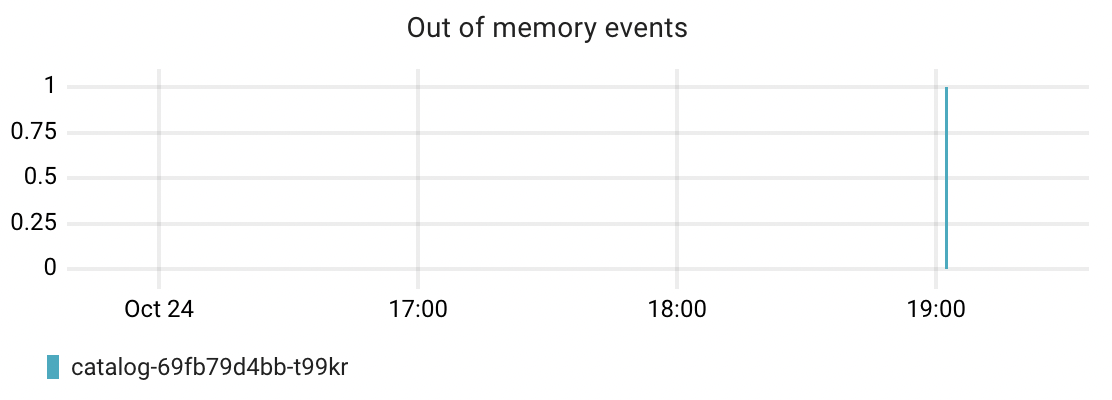
Based on the container_oom_kills_total metric,
this chart shows the number of times application containers have been terminated by the OOM killer and when these terminations occurred.
Node memory usage (unreclaimable)
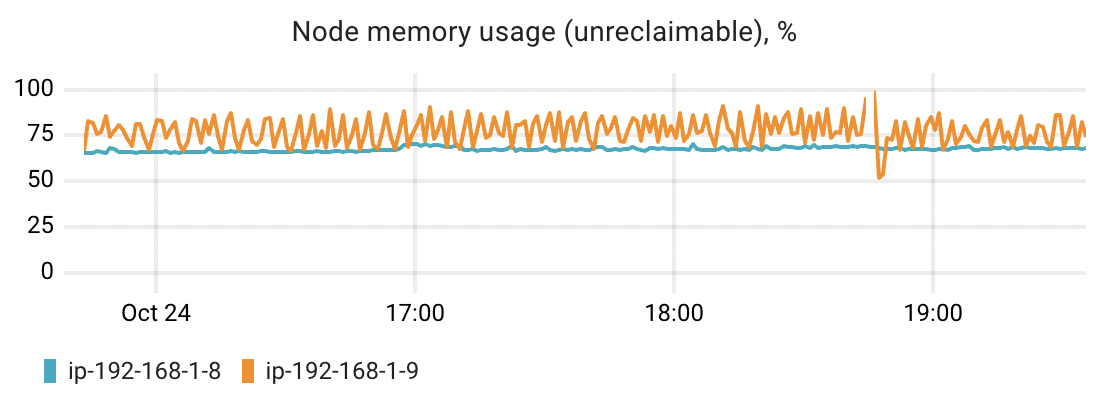
This chart allows you to estimate the memory usage of the related nodes. It does not take into account the page cache size because this memory can be reclaimed for new allocations.
In situations where there is no memory available for allocations, the OOM killer will terminate certain processes on the node, even if they have no memory limits defined.
Node memory usage = (total - available) / total * 100%
Memory consumers
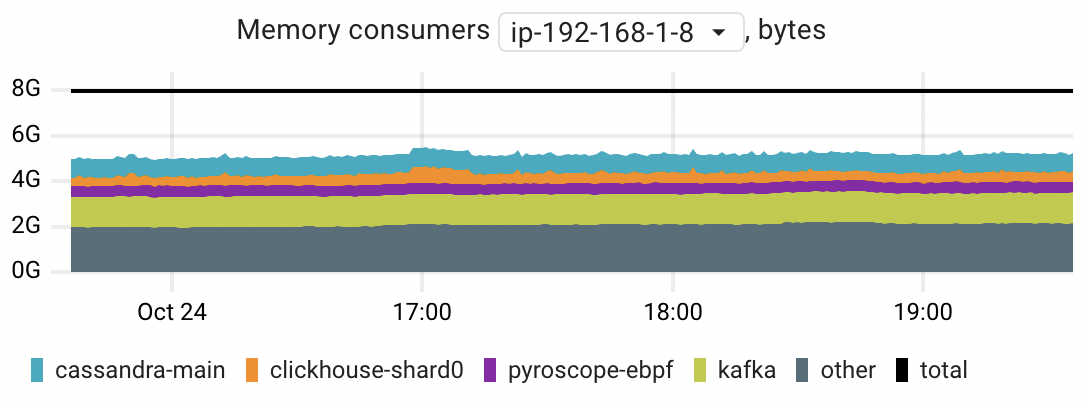
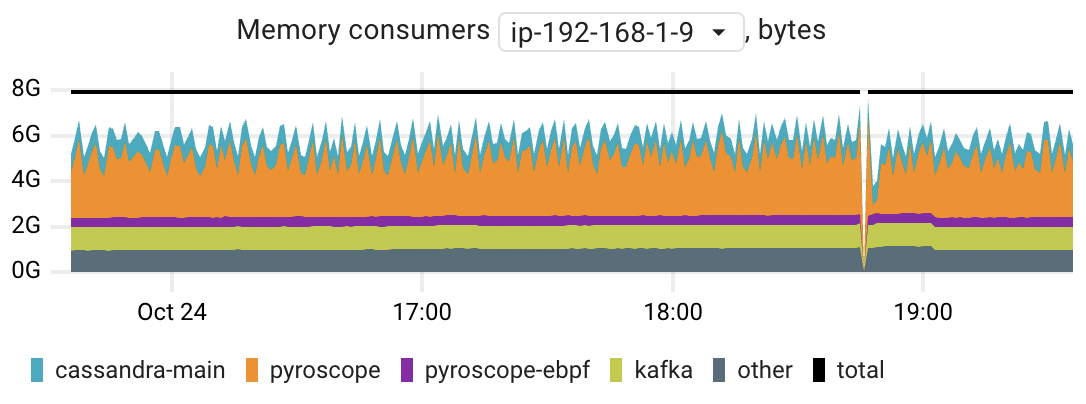
When you observe high memory usage on a particular node, this chart can assist you in identifying the primary memory-consuming applications. The chart displays the top 5 applications by their peak memory consumption.
The chart is based on the container_resources_memory_rss_bytes metric,
which does not include the amount of page cache allocated by the container.