CPU
This inspection detects situations in which an application is experiencing a lack of CPU time, which can be caused by several reasons:
- A container has reached its CPU limit and has been throttled by the system.
- A container competes for CPU time against the other containers running on the same node.
- A container consumes all available CPU time on its own.
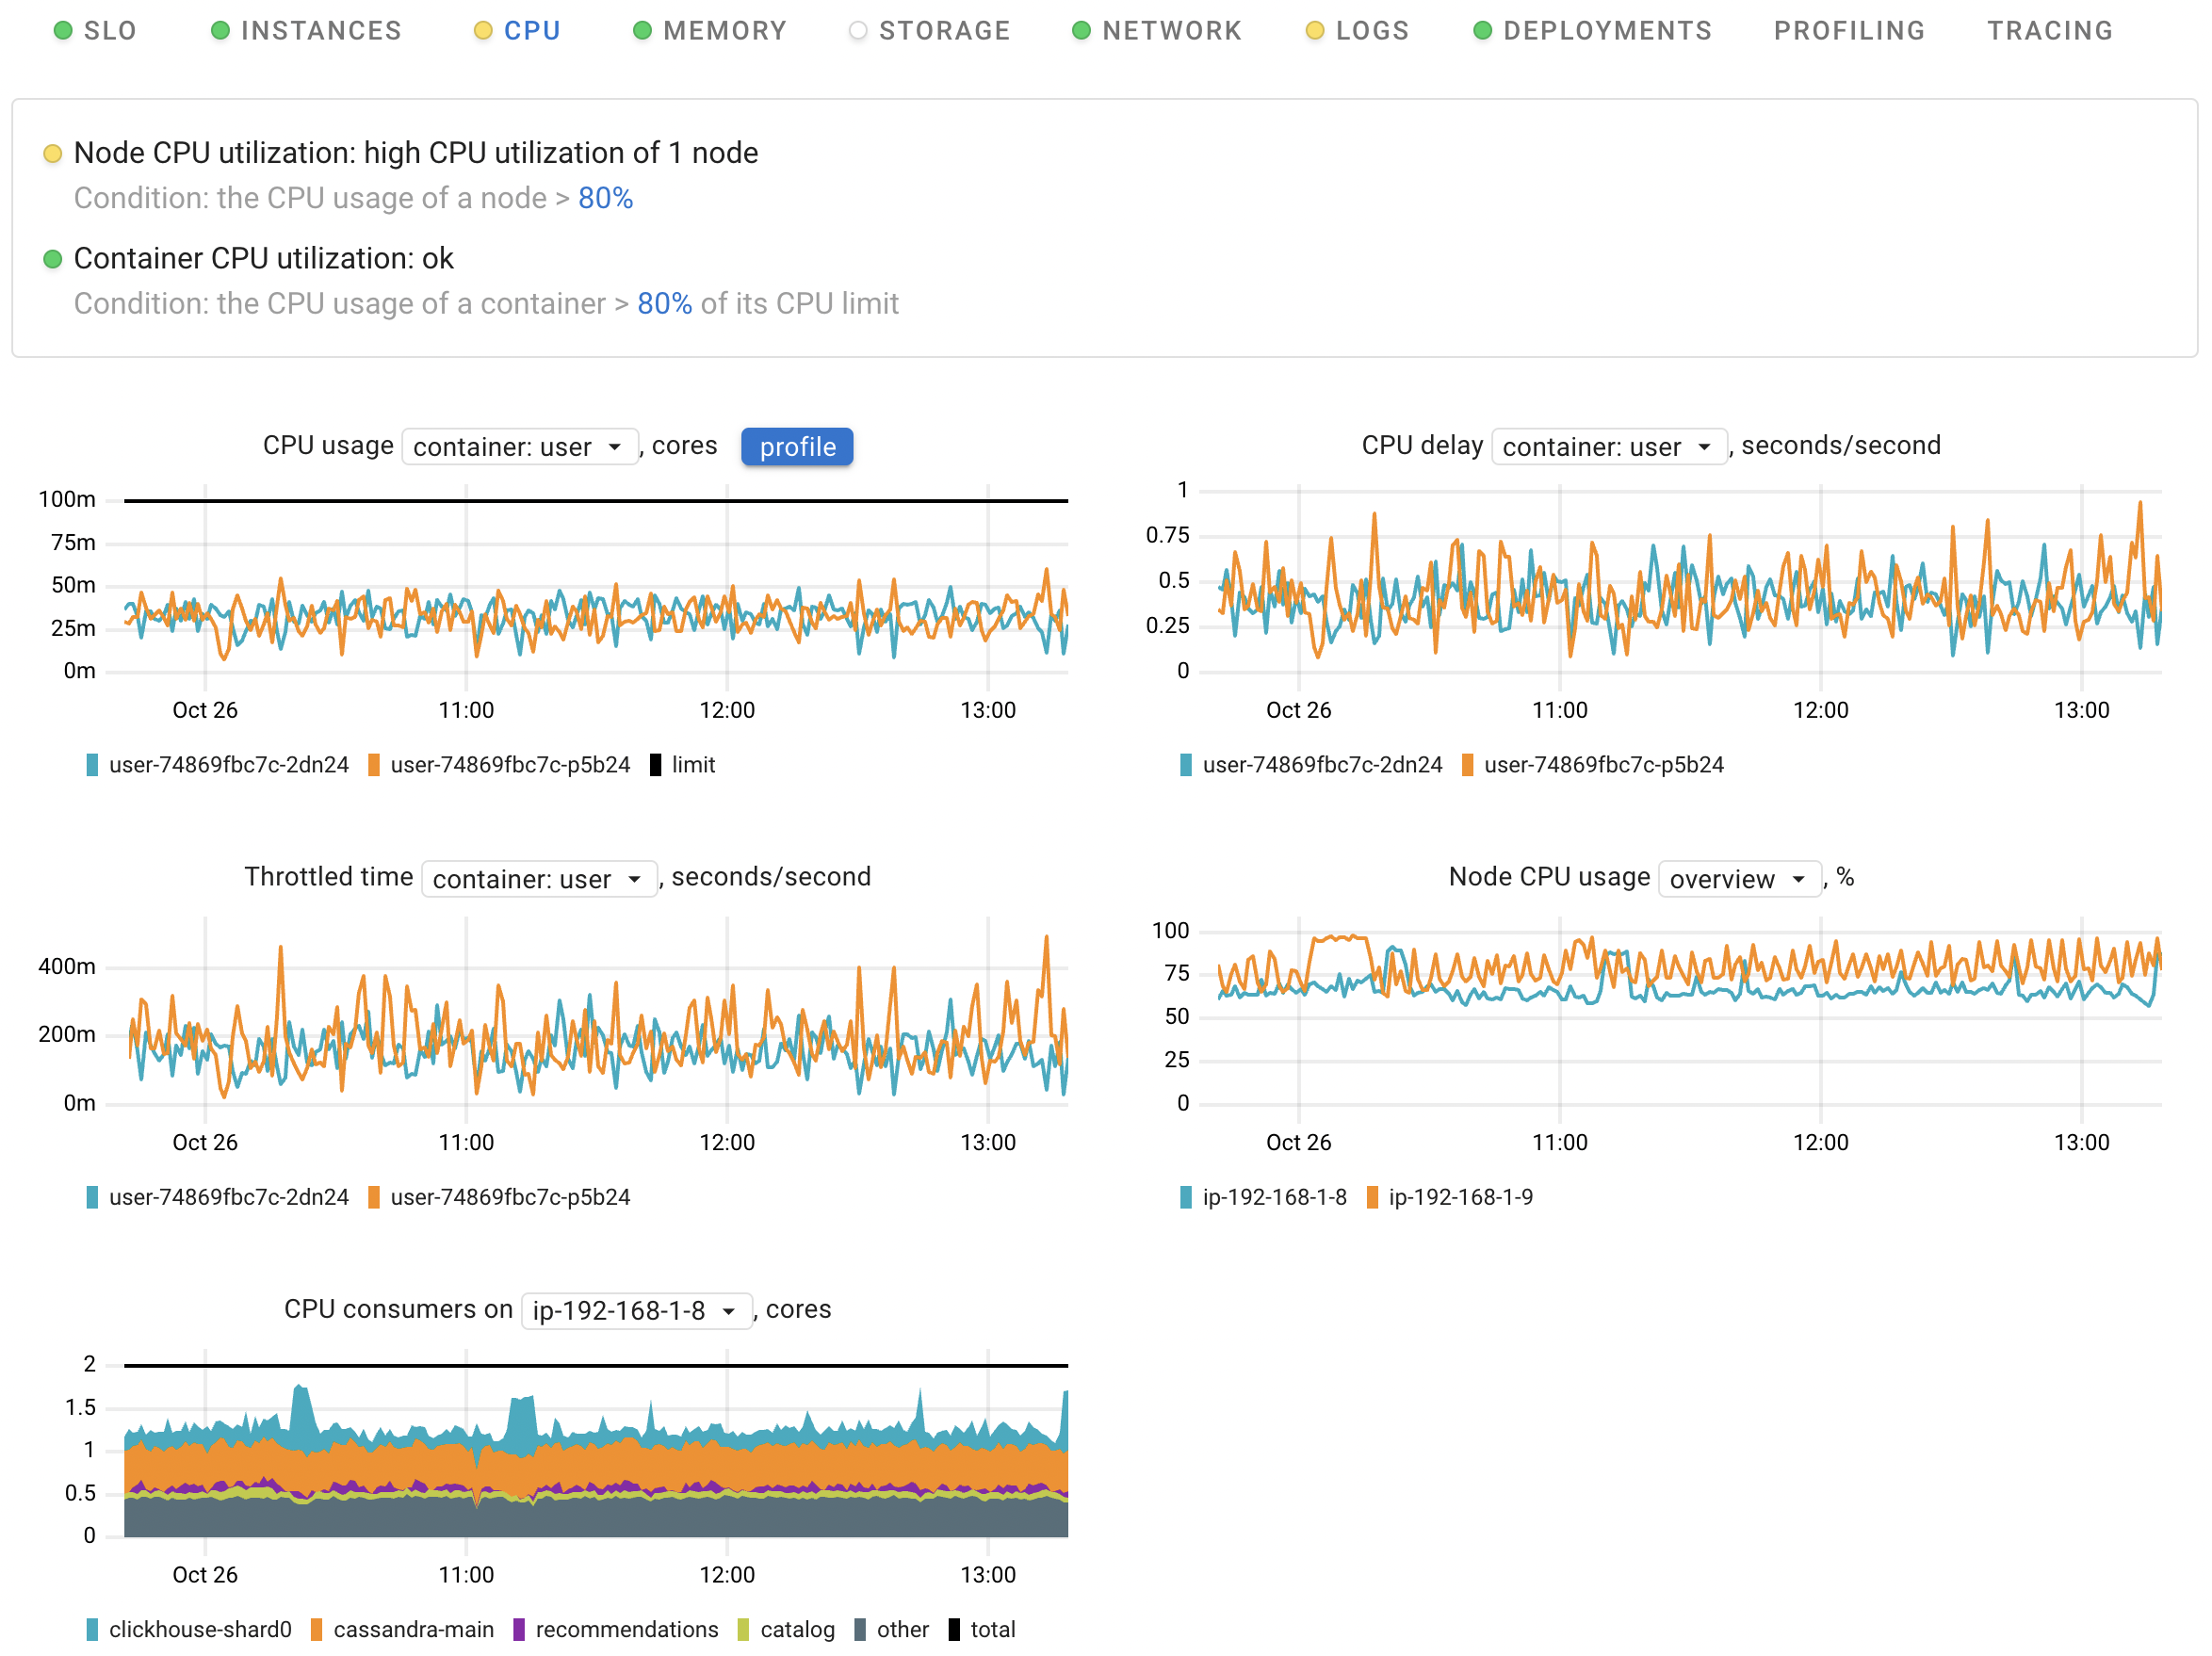
Possible failure scenarios
A container has reached its CPU limit
To control the CPU usage of containers, you can set CPU limits for them. If a container uses all the allowed CPU bandwidth, it will be limited in CPU cycles for a while. This mechanism is called CPU throttling.
High CPU utilization on the related nodes
Throttling is not the sole reason why an application can experience a shortage of CPU time. There can be situations where the application itself or other applications on the same node consume the entire CPU bandwidth. This can result in performance degradation due to a shortage of CPU time.
Dashboard
CPU usage
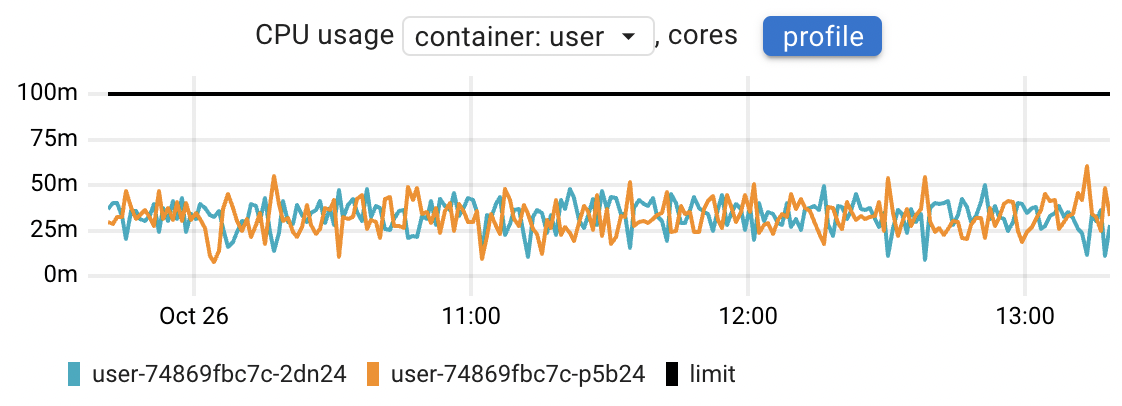
This chart can help you answer the following questions:
- Are all the application instances consuming the same amount of CPU time, or are there any outliers?
- How does CPU consumption change over time?
- Assess the CPU usage of each container in comparison to its limit.
CPU usage is calculated using the container_resources_cpu_usage_seconds_total metric.
If the application Pods contain more than one container, this chart provides you with both per-container and total views.
The profile button opens the CPU profiling data, allowing you to identify and analyze unexpected spikes in CPU usage down to the precise line of code.
Learn more about Continuous profiling in Coroot.
CPU delay
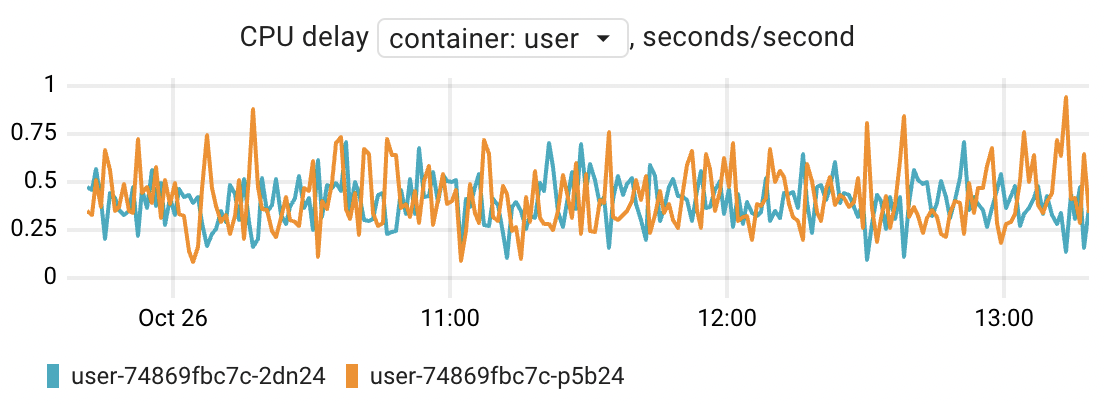
A lack of CPU time can be estimated by container_resources_cpu_delay_seconds_total metric.
The Linux kernel reports CPU delay,
indicating how long a specific process or container has been waiting for CPU time.
For instance, if you observe a delay of 500ms per second, it signifies that you are experiencing an additional latency of 500ms, which is spread across all requests processed during that wall-clock second.
If a container is limited in CPU time (throttled), the container_resources_cpu_delay_seconds_total metric is bound to increase.
This means that this metric indicates a shortage regardless of its underlying reasons.
To identify the specific reason, please refer to the Throttled time and Node CPU usage usage charts.
Related blog post: Delay accounting: an underrated feature of the Linux kernel
Throttled time��
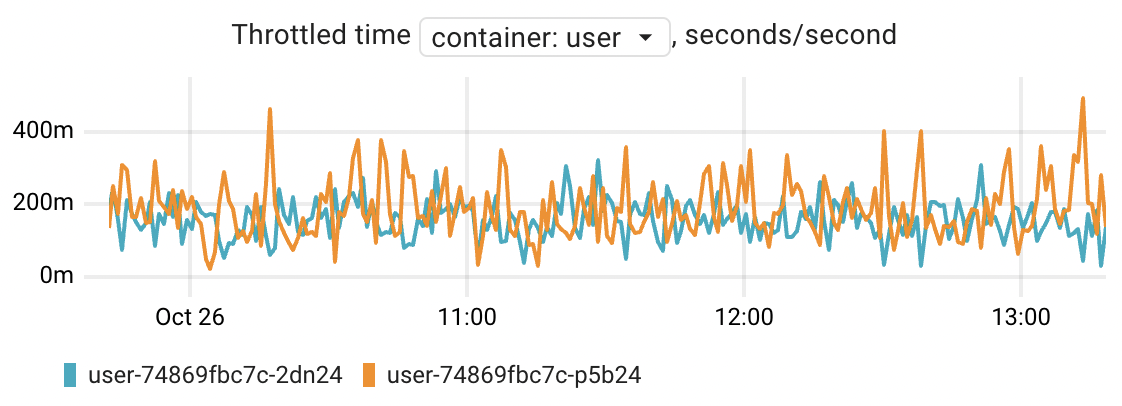
The Linux kernel offers several mechanisms to manage the distribution of CPU time among applications. One of these mechanisms is CPU Bandwidth Control, which allows to set a quota (limit) for the amount of CPU time that a container (cgroup) is allowed to consume. This quota is configured within a specific time period. If a container consumes all the allowed CPU bandwidth, it will be limited (throttled) in CPU cycles for the remainder of that period.
The container_resources_cpu_throttled_seconds_total metric displays the duration for which each container has been throttled.
Think of this throttled time as an additional latency for the application.
In simpler terms, if an application has been throttled for 200ms per second,
it means that the application was suspended for 200ms during that particular wall-clock second.
The default quota period in Kubernetes is 100ms. Therefore, when you define a CPU limit of 100m (which is equivalent to 1/10 of a CPU core) in Kubernetes, it sets up a CPU quota of 10ms for each 100ms period. This clarifies situations where the container has been throttled, even though its CPU consumption was significantly lower than the limit:


Node CPU usage
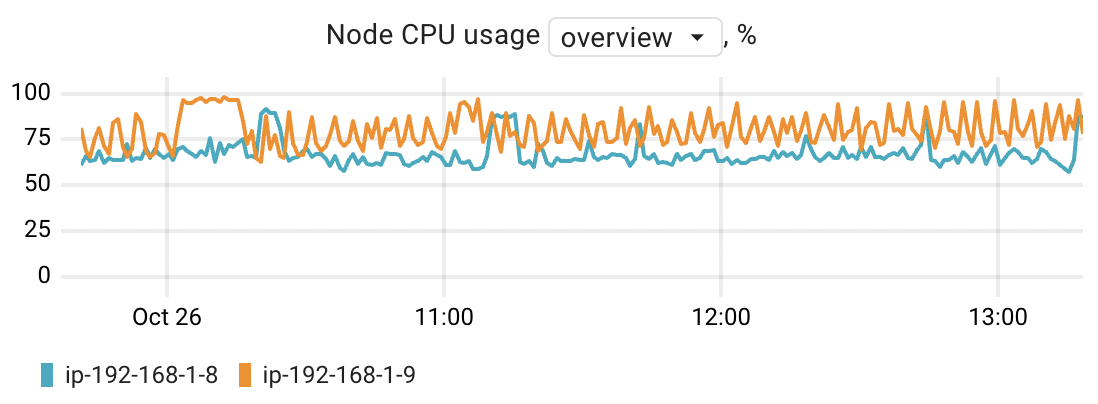
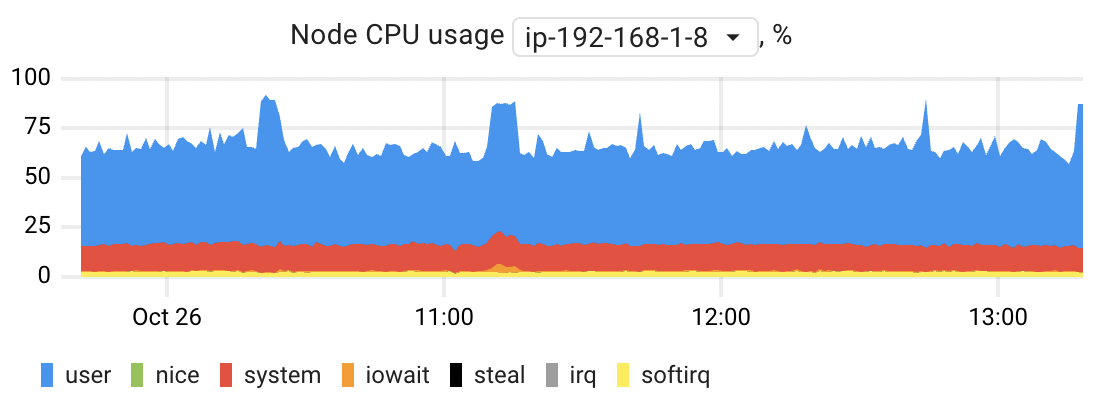
This chart allows you to estimate the CPU usage of the nodes where application instances are running. You can compare node CPU usage in an overview mode or choose a specific node to see its CPU usage broken down by mode. Each of these modes provides insight into how the CPU's time is allocated across various types of processes and activities:
- User: This mode represents the CPU time consumed by normal user processes running in user space. These are typical applications and tasks initiated by users.
- Nice: The "nice" mode is for processes that are niced, meaning they have their execution priority adjusted.Niced processes also run in user mode but with lower priority.
- System: This mode accounts for CPU time spent on tasks running in kernel mode, primarily associated with system processes and managing the operating system itself.
- I/O Wait: This mode is associated with the CPU waiting for input/output (I/O) operations to complete. During this time, the CPU is idle because it's waiting for data to be read from or written to a storage device.
- IRQ: The "IRQ" mode indicates CPU time spent servicing hardware interrupts. These are signals generated by hardware devices that require immediate attention from the CPU.
- SoftIRQ: Similar to IRQ, "SoftIRQ" mode accounts for CPU time spent servicing software-generated interrupts, known as softirqs. These are typically used for network-related tasks and other asynchronous events. Steal: This mode indicates the CPU time that a virtual CPU (vCPU) within a virtual machine has to wait because the physical CPU on the host system is being utilized by other VMs or processes. It essentially reflects the amount of time the vCPU is "stolen" or preempted by other workloads on the host. This can have a notable impact on application performance, especially when using burstable performance instances like AWS's T4g, T3a, and T3, where resource allocation can vary based on demand.
The chart is based on the node_resources_cpu_usage_seconds_total metric.
CPU consumers
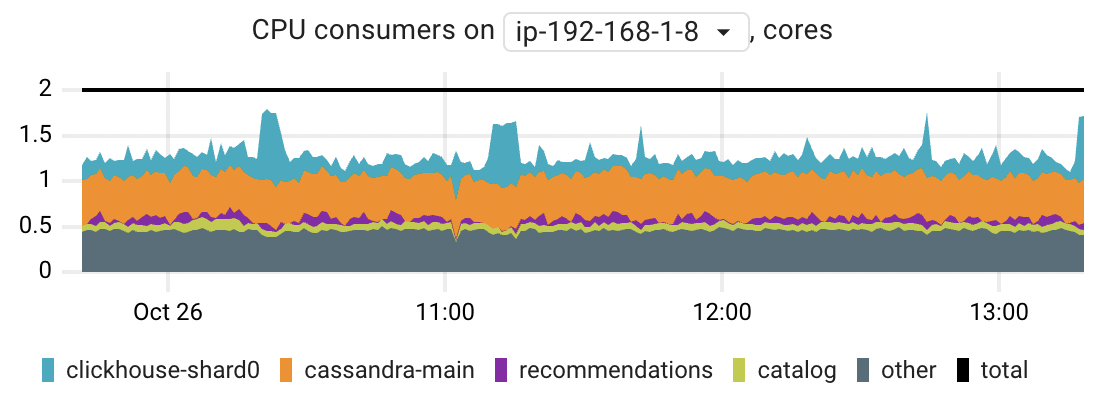
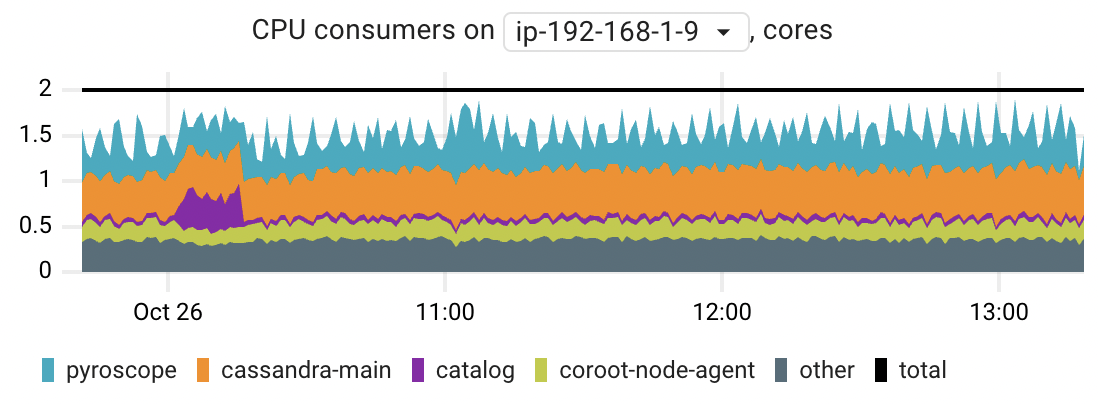
When you observe high CPU usage on a particular node, this chart can assist you in identifying the primary CPU-consuming applications. The chart displays the top 5 applications by their peak CPU time consumption.
The chart is based on the container_resources_cpu_usage_seconds_total metric.