Postgres
Coroot inspects Postgres clusters using metrics gathered by the
cluster-agent, which connects to each discovered instance
and reads its system views (pg_stat_activity, pg_stat_statements, pg_stat_replication,
pg_stat_archiver, pg_stat_user_tables, pg_class, and others). Backup state is collected
from the CloudNativePG and Percona operator custom resources
(see Postgres backups).
The report opens with a set of automated checks. Each check raises an alert when it crosses a threshold and comes with supporting charts. Thresholds are configurable per project and can be overridden per application.
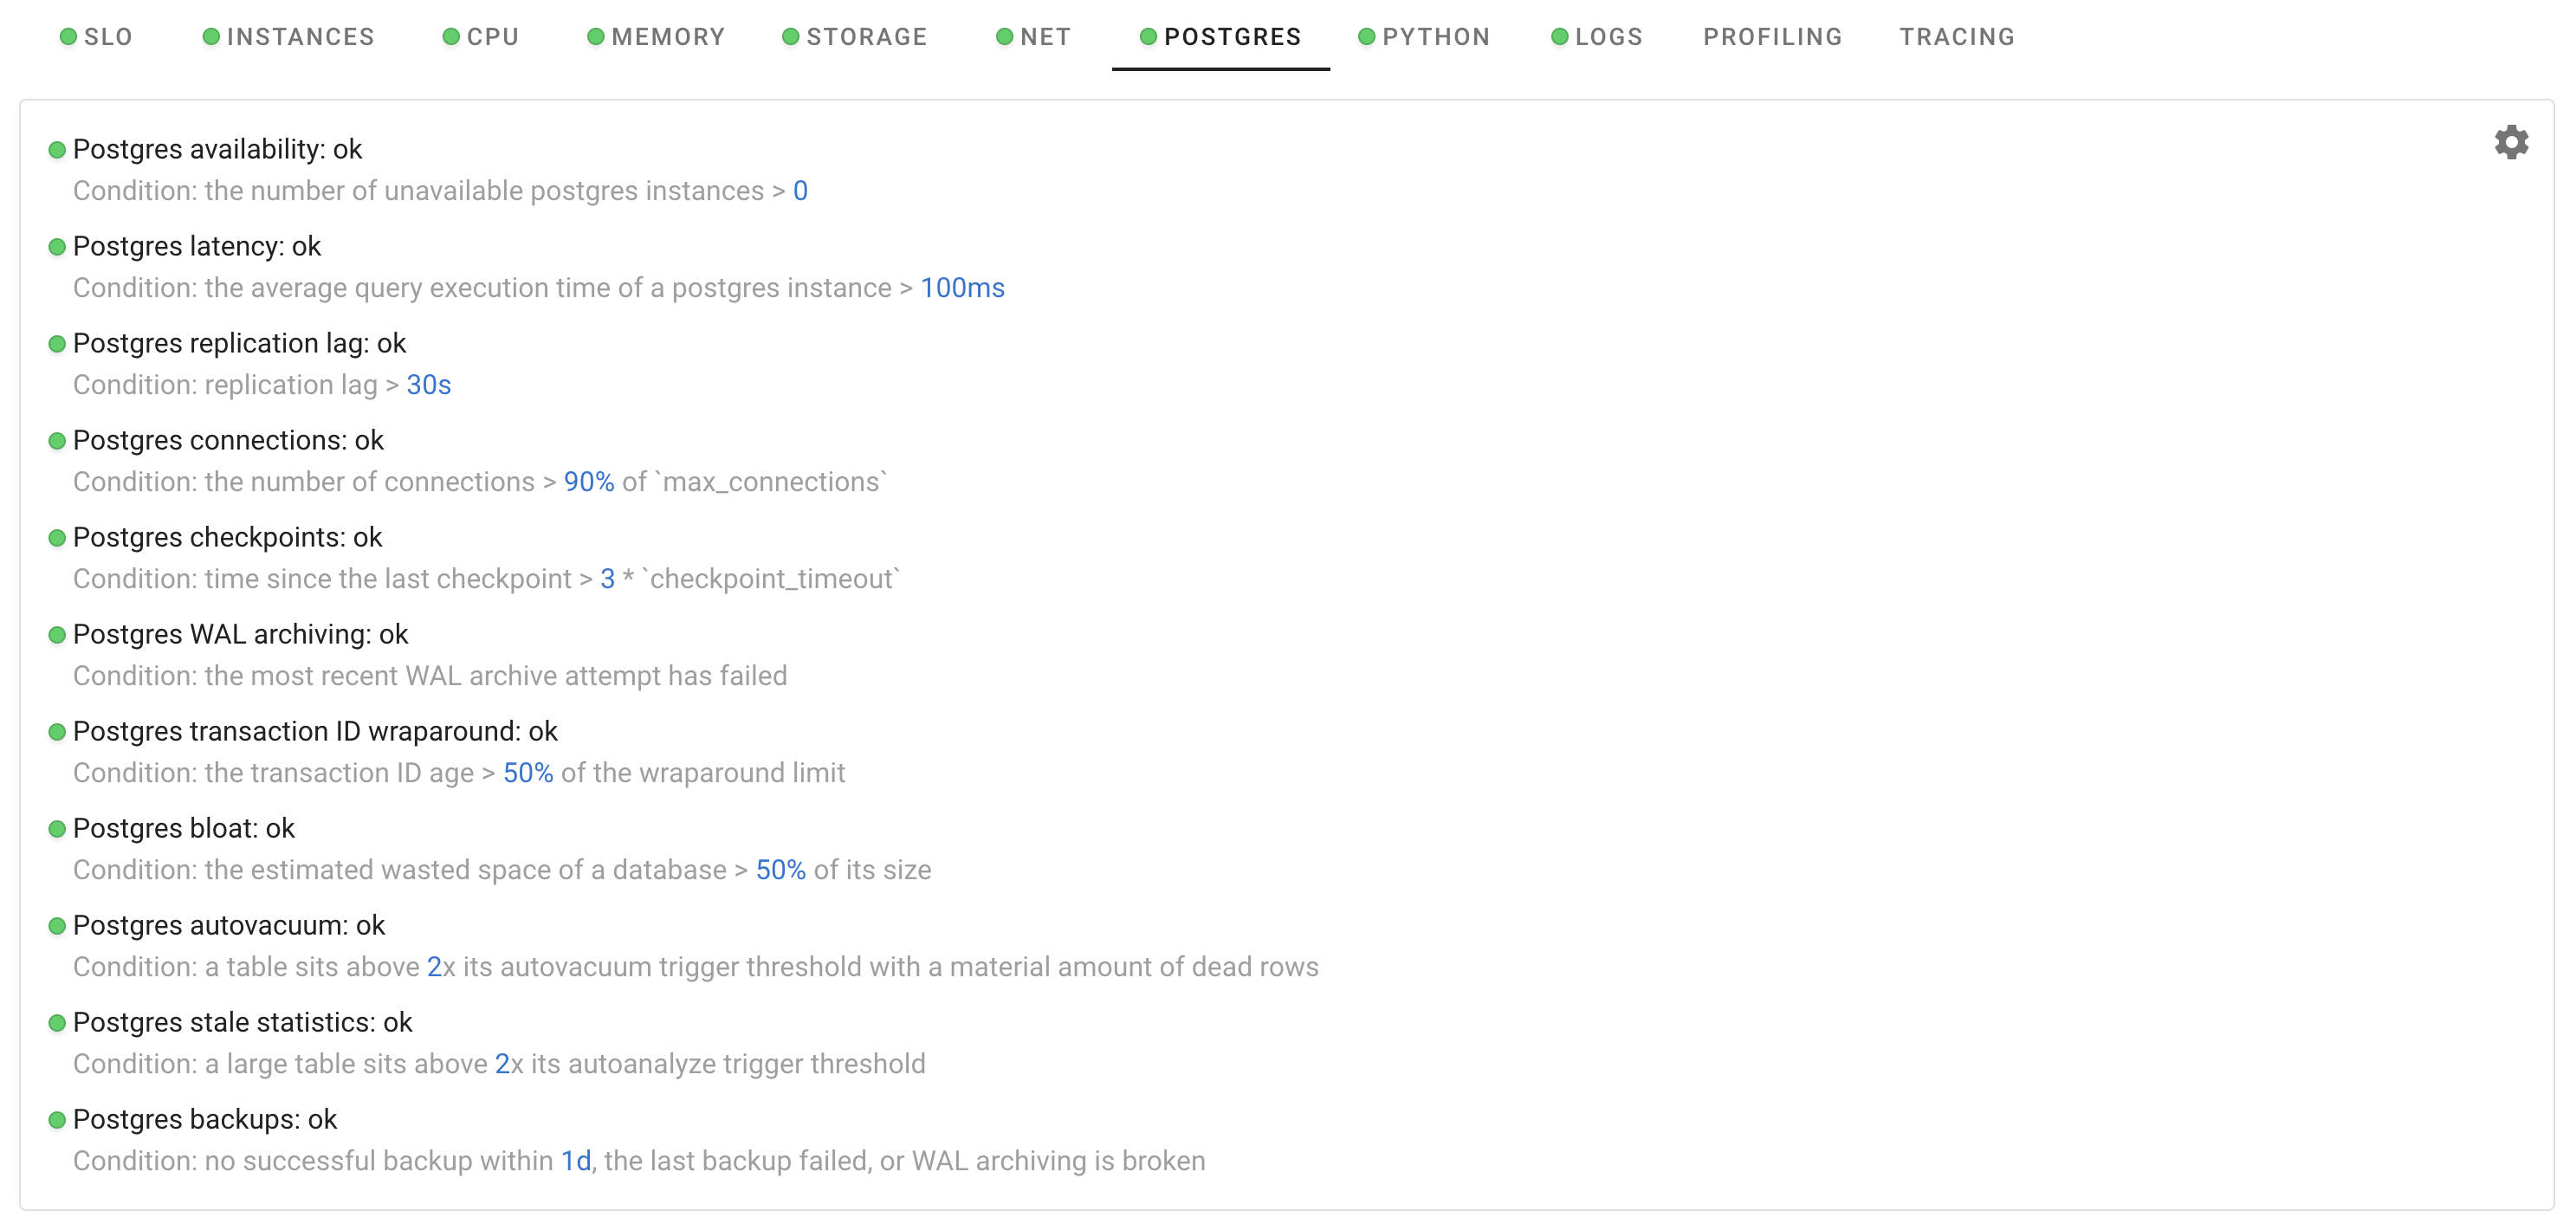
Below the checks is a per-instance overview that shows the role (primary or replica), status, queries per second, latency, replication lag, and database size.

Availability
Detects Postgres instances that are unreachable or not accepting connections. The agent verifies
the connection is alive on every scrape (pg_up), and the check reports the fraction of time an
instance was unavailable. The Status column in the instance overview above shows the current
state of each instance, and the Role column shows which one is the primary, so you can see at
a glance whether the outage hit a replica or the primary.
Latency
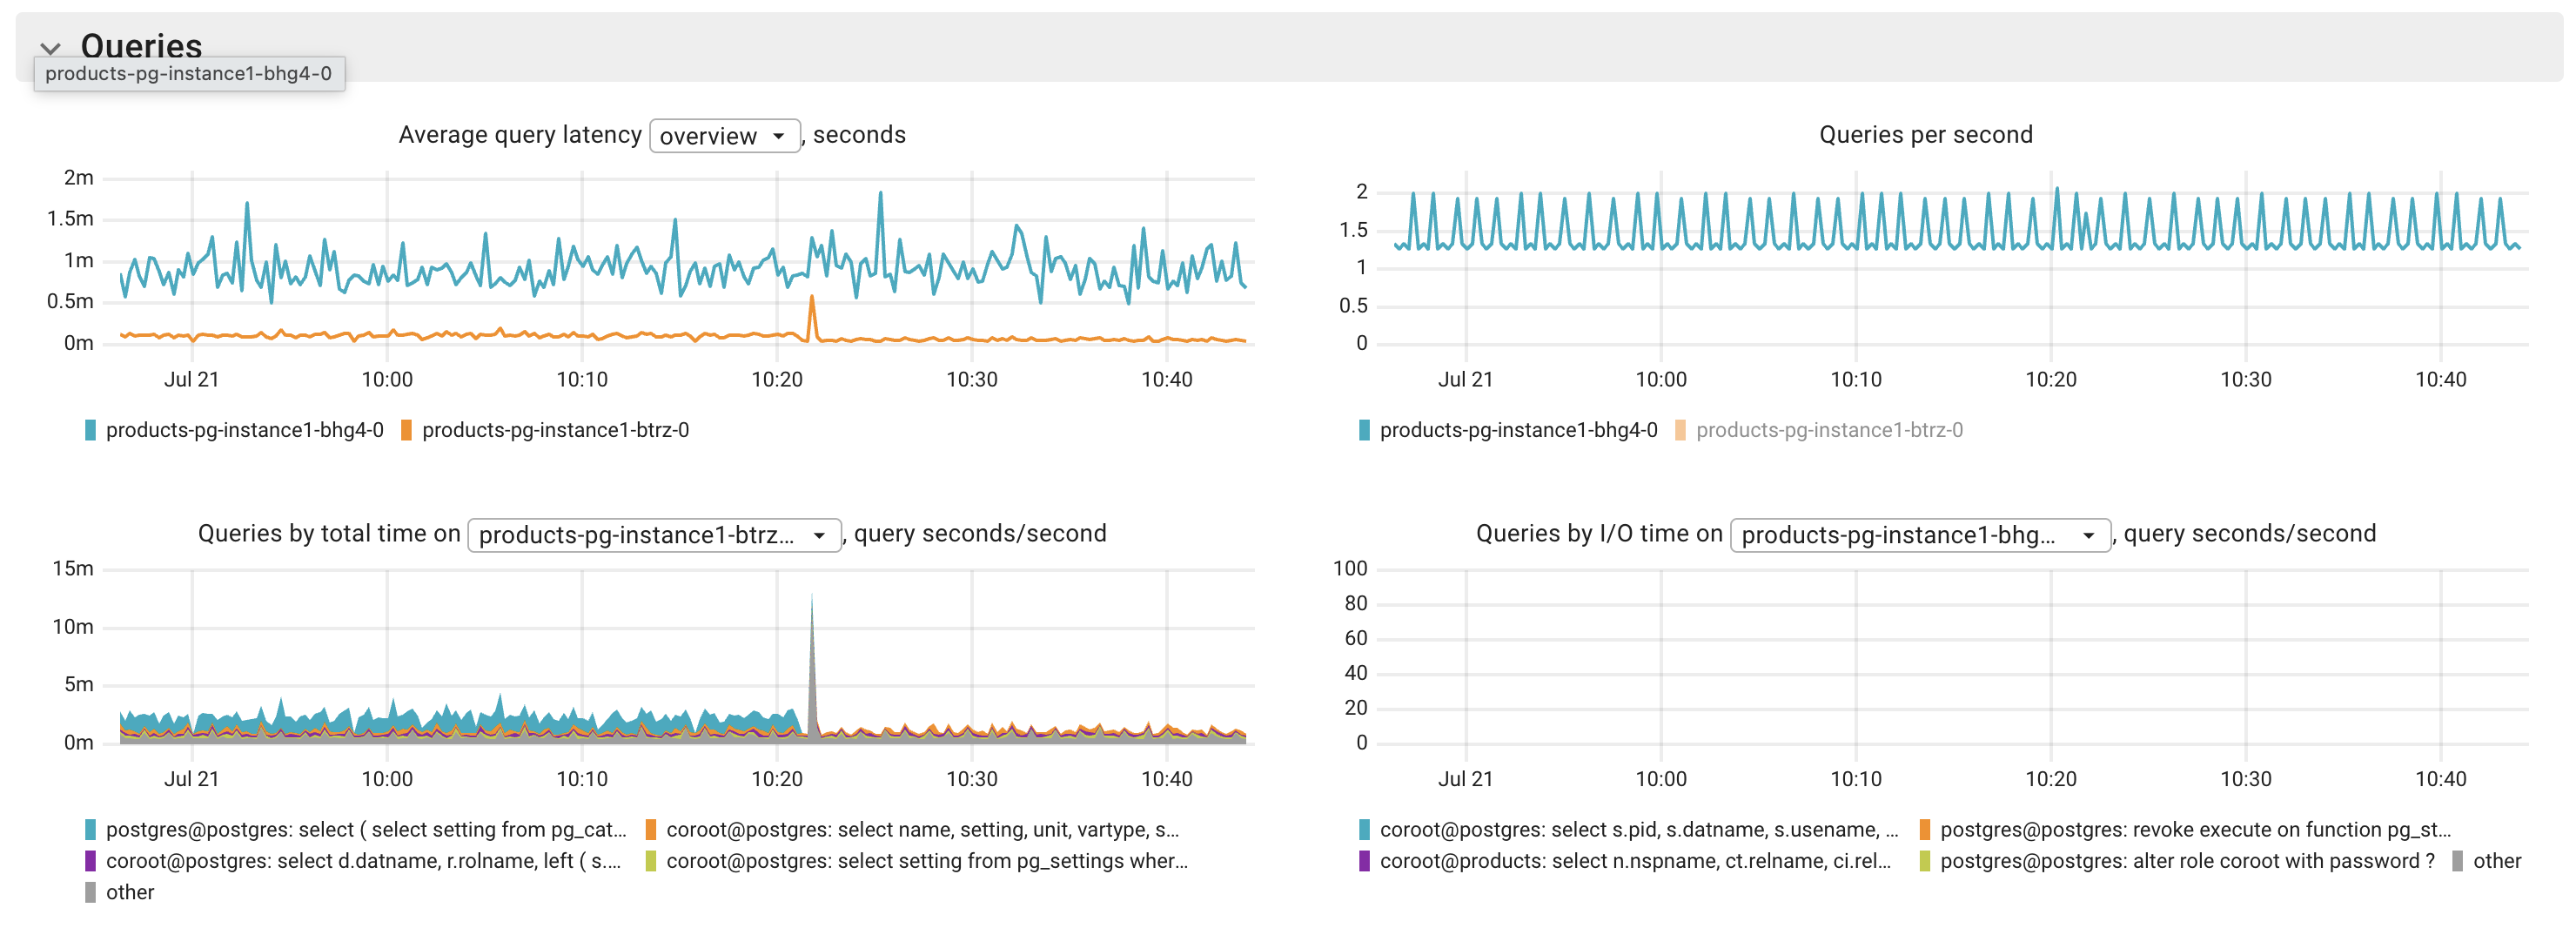
Flags instances whose average query latency exceeds the threshold (default 0.1s). Coroot
combines completed-query statistics from pg_stat_statements with in-flight queries from
pg_stat_activity, so slow queries are visible even before they finish.
Use the charts to pinpoint the cause:
- Average query latency (avg, p50, p95, p99). The spread tells you the shape of the slowdown. A rising p50 means everything got slower, while a rising p99 with a flat p50 means a few slow outliers. Switch instances with the selector to see whether it is cluster-wide or one node.
- Queries per second. Rules load in or out. If latency rose without more queries, the cause is inside the database (locks, I/O, a bad plan), not incoming traffic.
- Queries by total time. Ranks queries by the capacity they consume. The top query is usually the one to optimize, and a query that suddenly climbs here is often the regression.
- Queries by I/O time. If a slow query's time is mostly I/O, it is waiting on disk (a missing index or a cold cache) rather than CPU.
- Active connections by query and Idle transactions by query. Show what the busy backends
are actually running, and surface
idle in transactionsessions that hold locks and snapshots. - Locked queries and Blocking queries. When the slowdown is contention, these name the
query that is blocking the others (attributed via
pg_blocking_pids()).
Replication lag
Detects replicas that have fallen too far behind the primary (default 30s). Coroot separates the two stages of replication so you can tell shipping problems (network or WAL sender) from apply problems (a stuck or paused replay).
Use the charts to tell which stage is at fault:
- Replication lag, bytes. How far each replica trails the primary. Watch whether the gap is steady (keeping up, just behind) or climbing (falling further behind), and which replica it is.
- Replication stages. Splits the lag into shipping (WAL not yet received) and apply (WAL received but not yet replayed). If the shipping band dominates, WAL is not reaching the replica (network, or a slow or overloaded WAL sender). If the apply band dominates, WAL arrives but replay is stuck, typically a long query on the replica causing a recovery conflict, or a paused replay.
- WAL throughput. A burst of WAL generation on the primary explains a temporary lag spike: the replica simply has more to catch up on.
When a replica is stuck, Coroot also names the cause directly, such as a paused replay
(pg_wal_replay_paused), a disconnected WAL receiver, or a recovery conflict.

Connections
Raises an alert when an instance approaches its connection limit (default 90% of
max_connections). Exhausting connections prevents new clients, including failover tooling,
from connecting.
Use the charts to see what is consuming the connections:
- Connections. Stacked by state against the
max_connectionsline. Watch how close the total gets to the line and which state is growing. A wall ofidle in transactionmeans clients open transactions and never commit (usually an application bug or a leaked transaction), and those sessions also hold locks and snapshots that block vacuum and other queries. - Idle transactions by query. Names the queries whose sessions sit idle in transaction, so you can find the offending code path.
- Active connections by query. What the active backends are running when connections spike, which points at the workload driving the demand.

Checkpoints
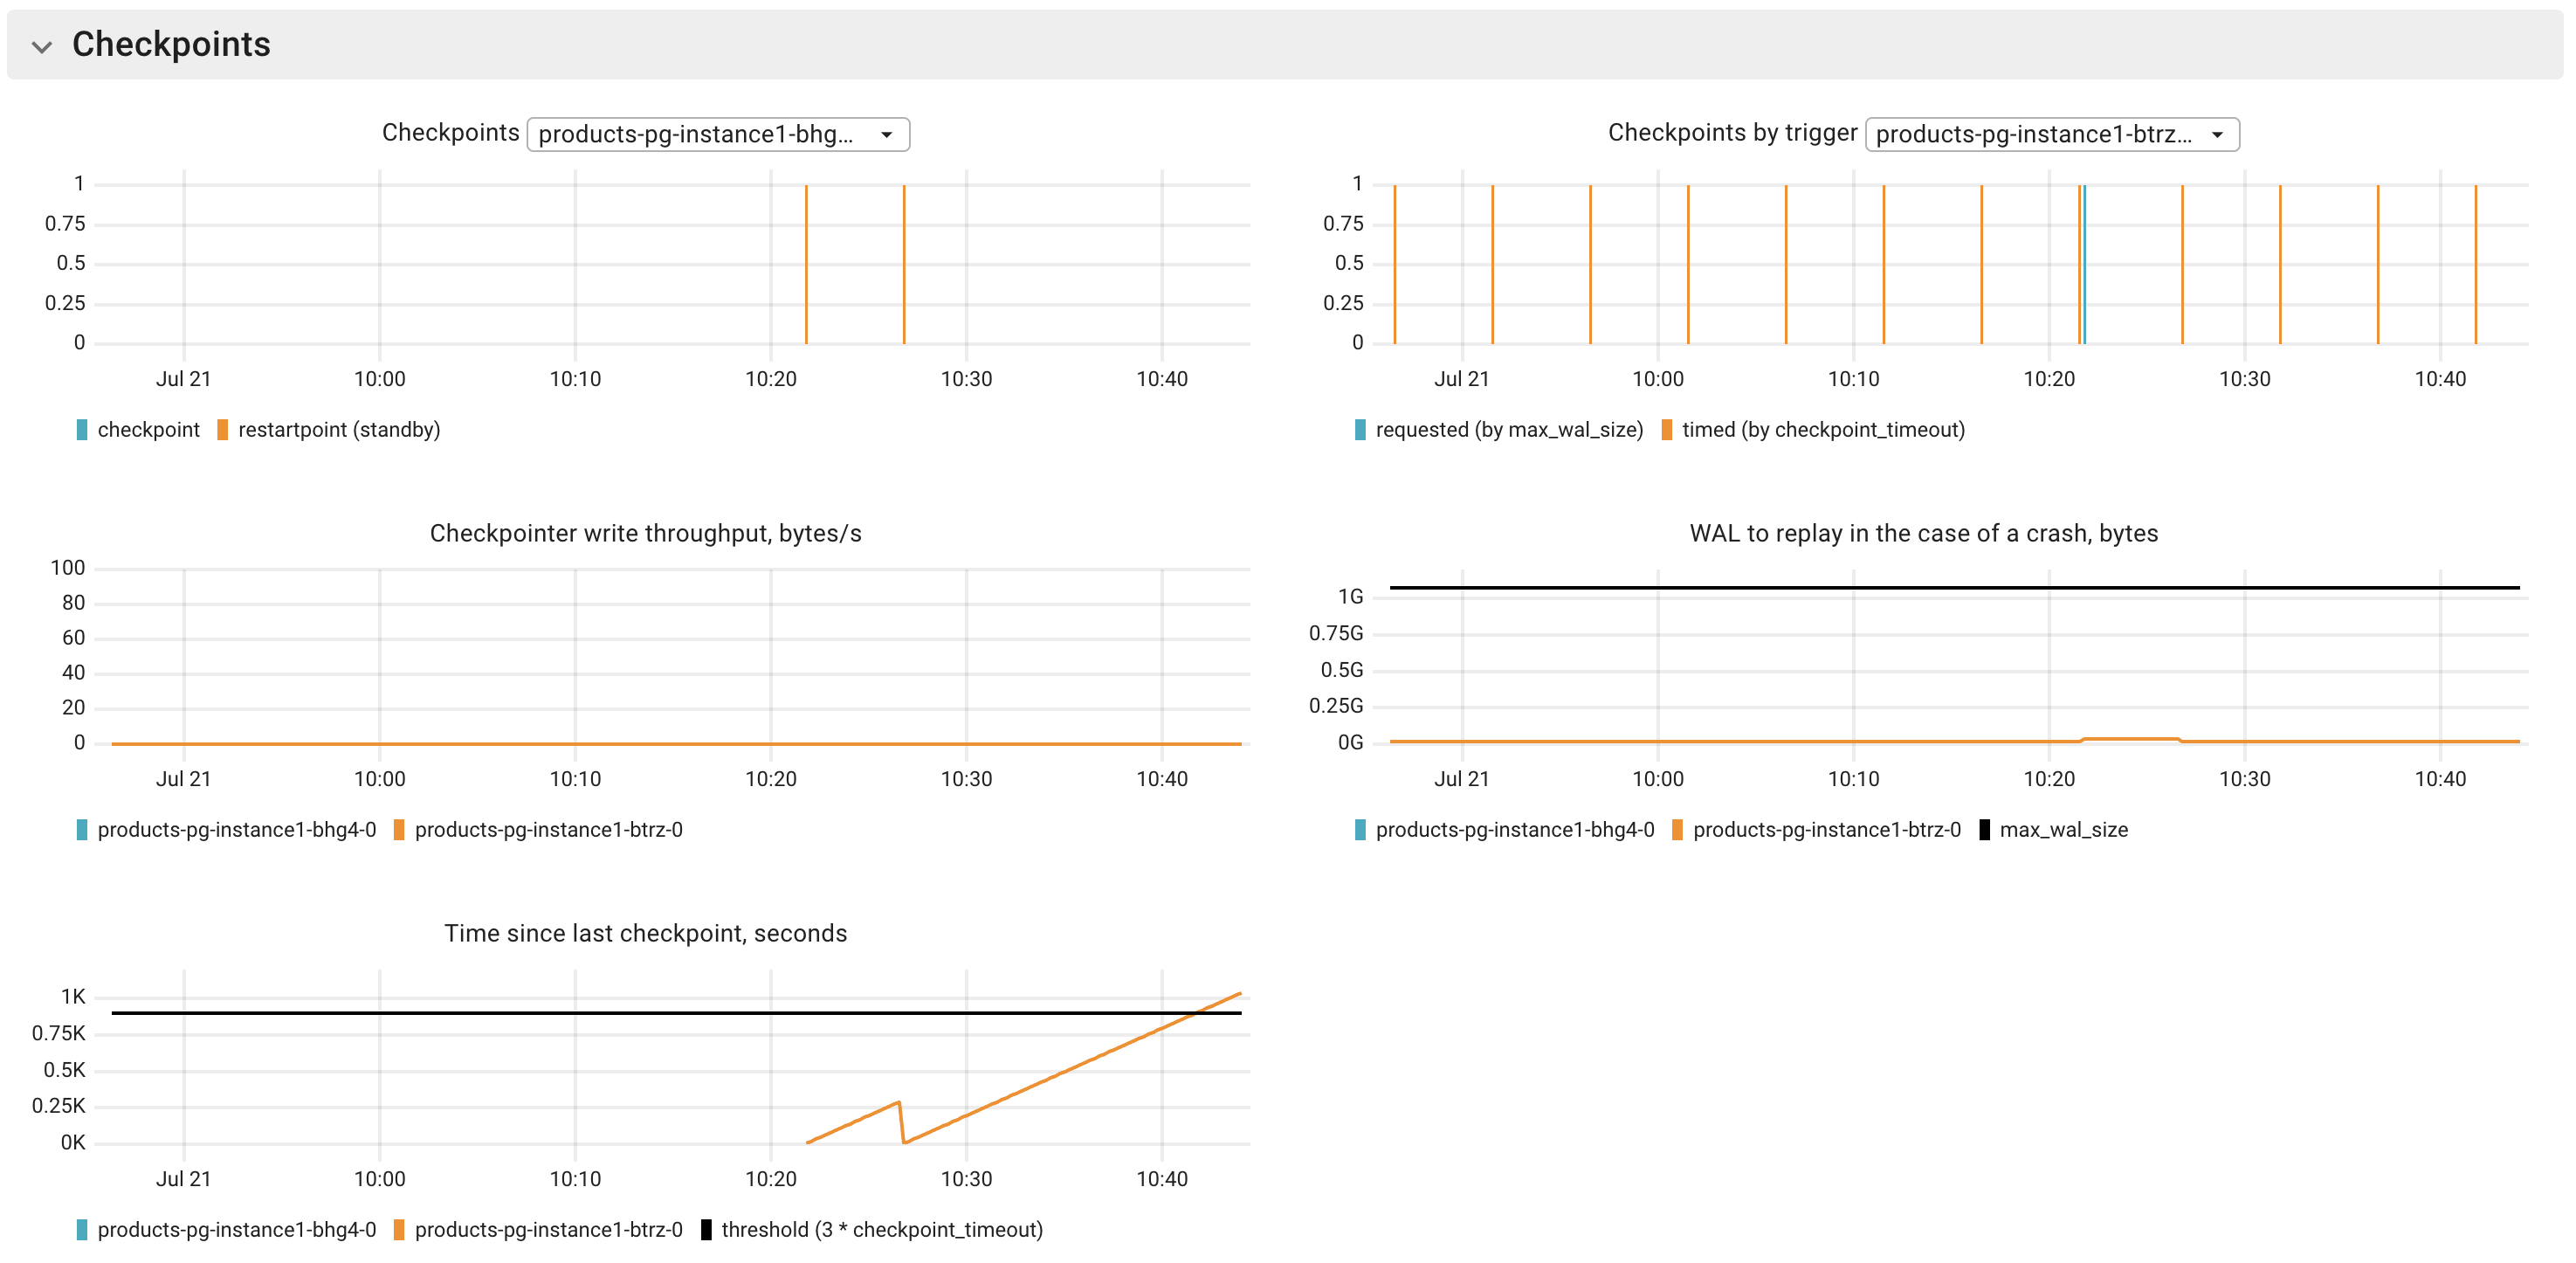
Flags a stalled or overdue checkpoint. A long time since the last completed checkpoint grows crash-recovery time and can indicate a stuck checkpointer or WAL pressure. Coroot shares its WAL-stall diagnosis with the replication check, for example a full disk, a stuck archiver, or a replication slot retaining WAL.
Use the charts to read the checkpointer's health:
- Time since last checkpoint. Plotted against the threshold line. If it keeps climbing past the line, checkpoints are not completing (the checkpointer is stalled or overdue).
- WAL to replay in the case of a crash. How much WAL a crash would need to replay, which is your recovery time. It should sawtooth down at each checkpoint. A steady climb confirms checkpoints are not finishing.
- Checkpoints and Checkpoints by trigger. Mostly
requestedcheckpoints (triggered bymax_wal_size) rather thantimedones meansmax_wal_sizeis too small for the write rate, forcing constant, expensive checkpoints. - Checkpointer write throughput. How hard the checkpointer is working to flush dirty buffers, useful to correlate checkpoint spikes with I/O pressure.
WAL archiving
Detects failing WAL archiving (archive_command). If WAL cannot be offloaded it accumulates on
disk and breaks point-in-time recovery. This works for any Postgres via pg_stat_archiver,
independently of the operator.
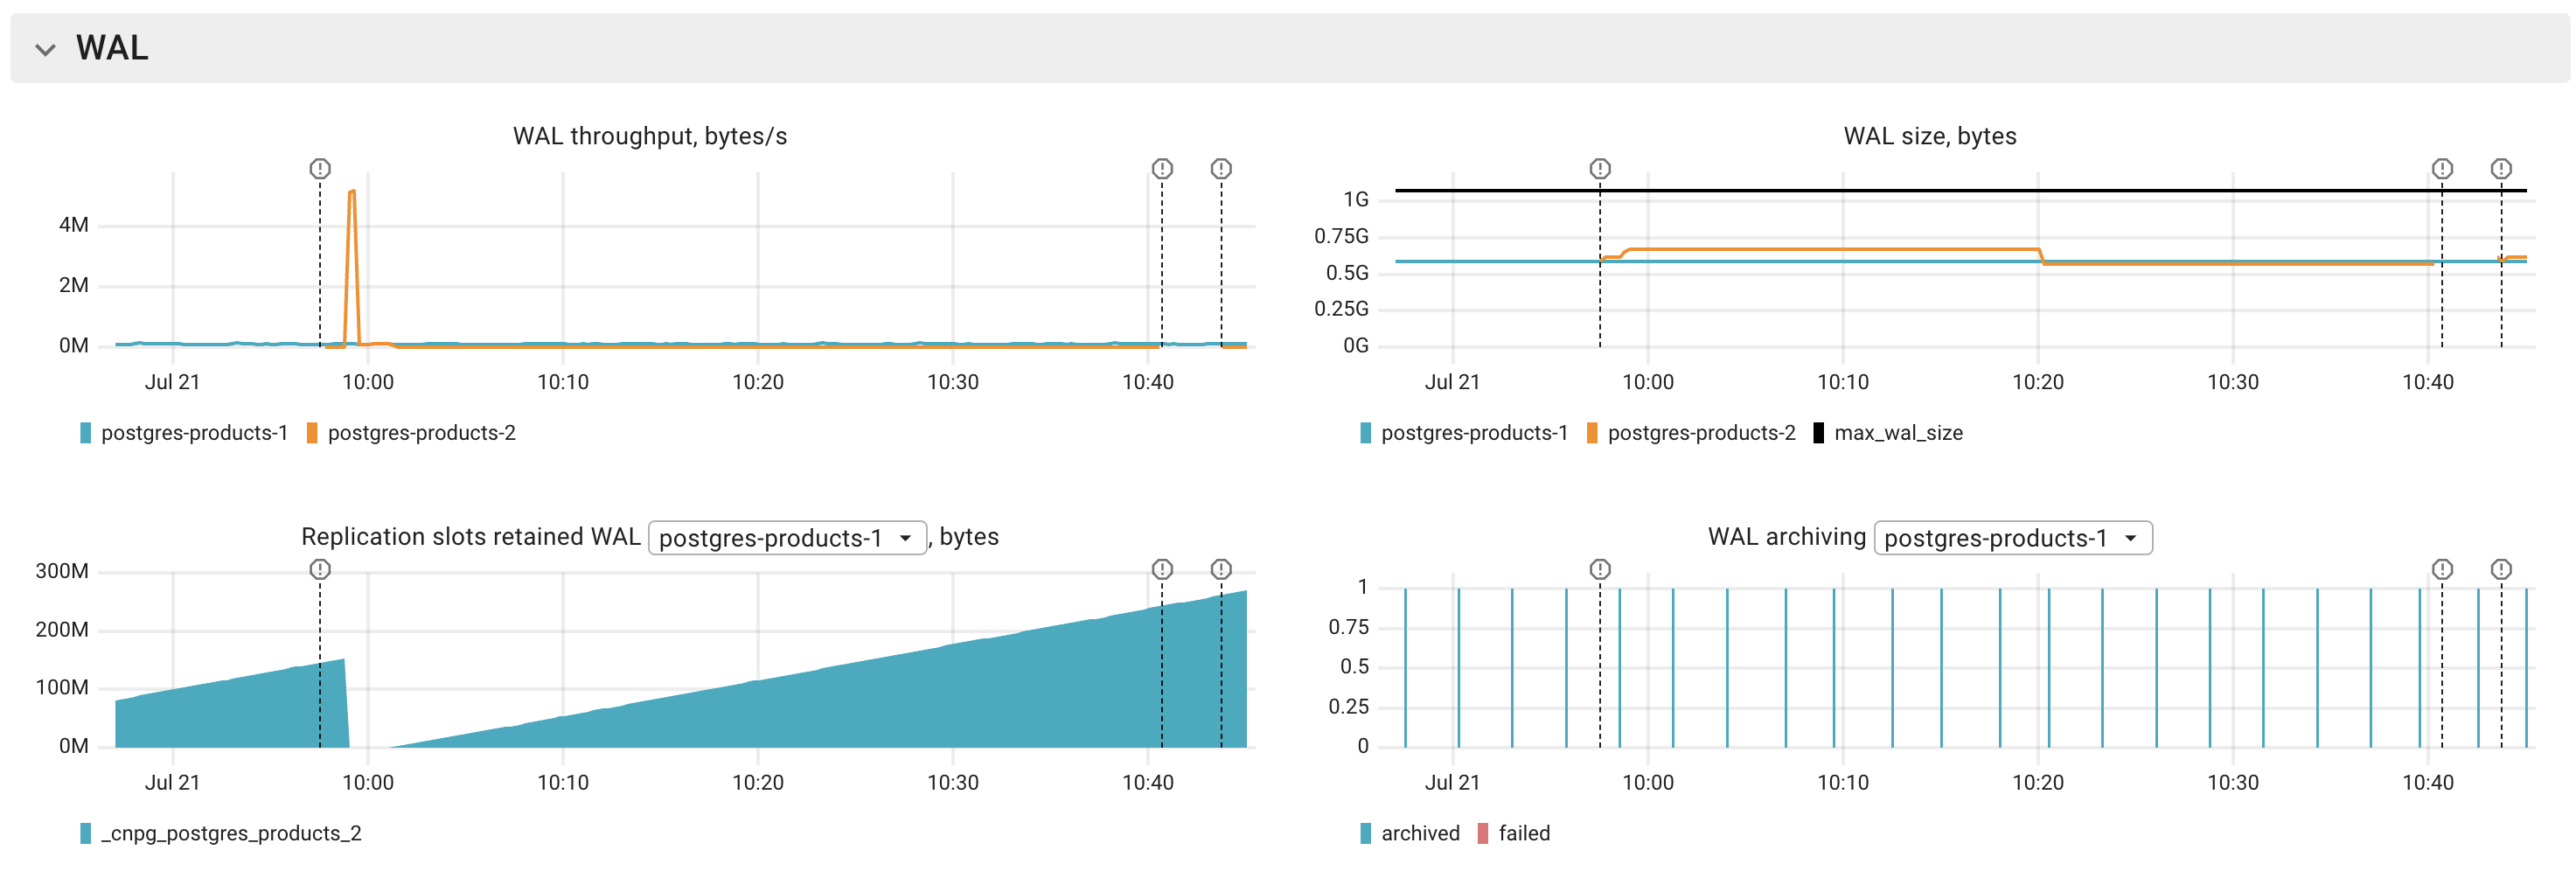
- WAL archiving. Archived versus failed segments per instance. Any bar in the
failedseries meansarchive_commandis erroring (bad credentials, unreachable storage, a full bucket). When archiving fails, WAL cannot be recycled and the WAL directory grows (see Storage & WAL), and point-in-time recovery no longer has a complete archive.
Transaction ID wraparound
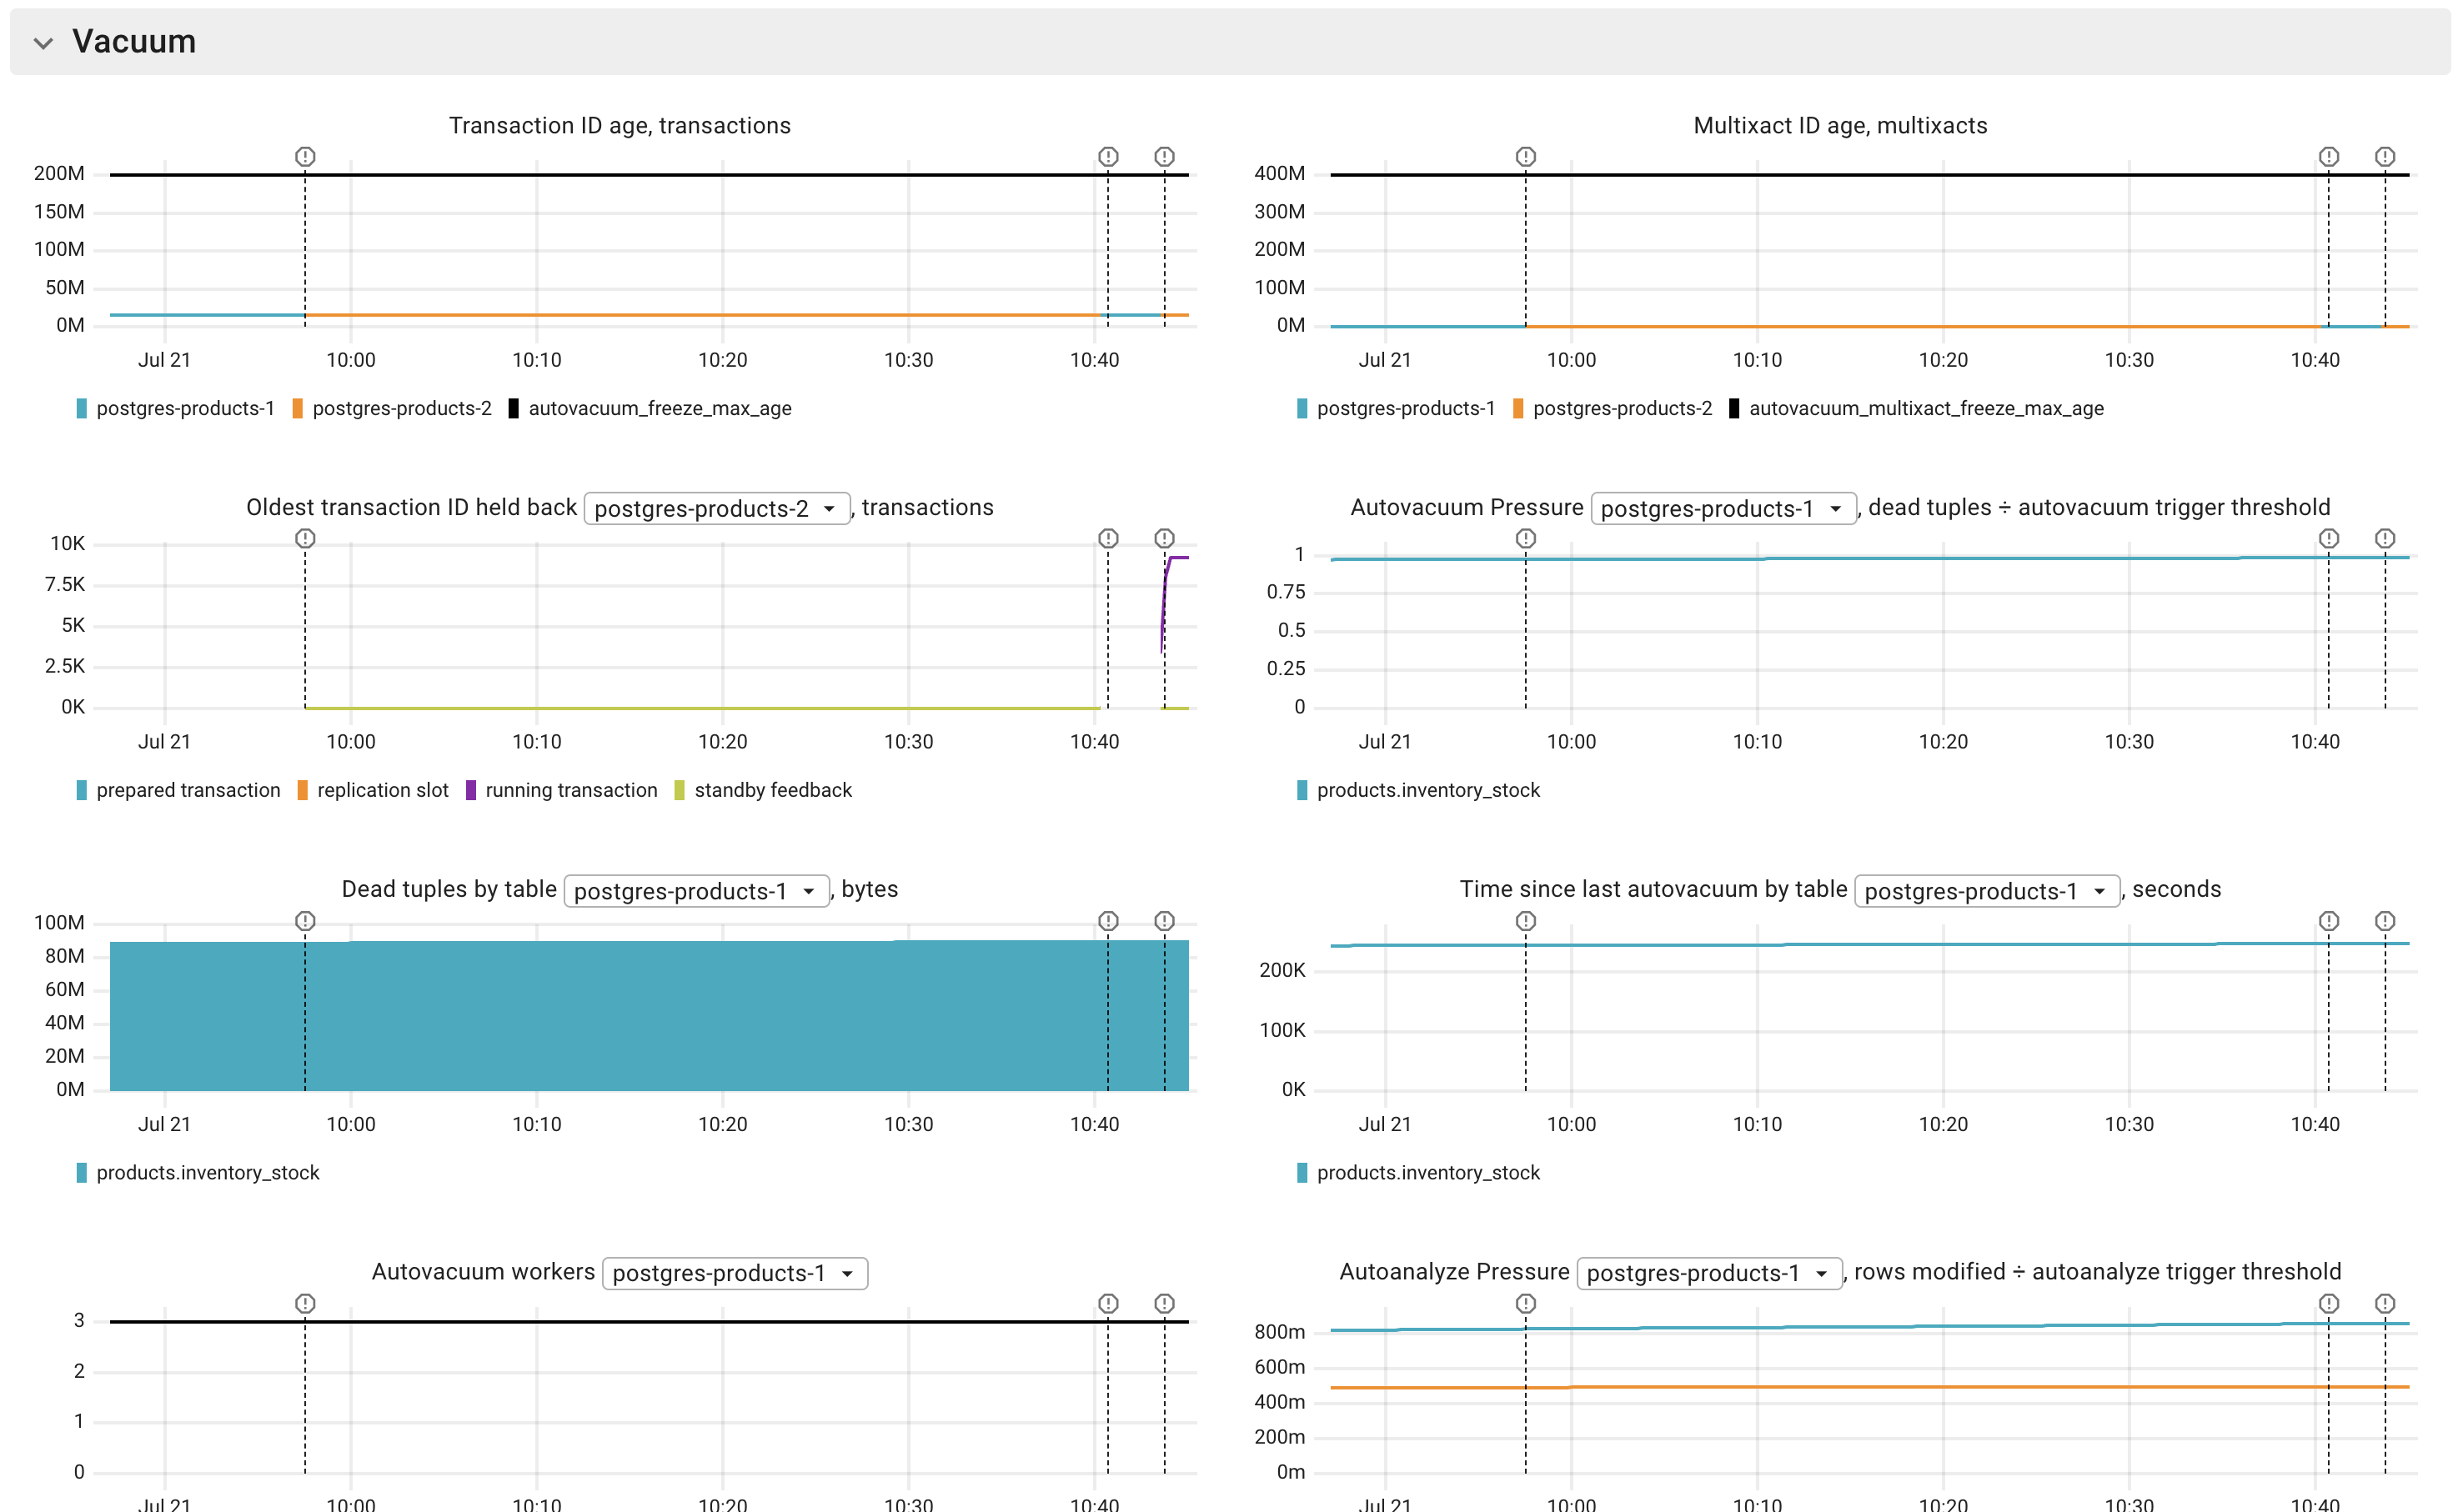
Warns when the oldest transaction or multixact age approaches the wraparound limit (default 50% of the 2-billion budget). Left unchecked, wraparound forces an emergency anti-wraparound vacuum and can ultimately shut the database down to protect data, so it is worth catching early.
Use the charts to see how close you are and what is to blame:
- Transaction ID age and Multixact ID age. Age per database against the
autovacuum_freeze_max_ageline. A database climbing toward the line is approaching a forced anti-wraparound vacuum. Steady growth on one database points to vacuum not freezing its tables. - Oldest transaction ID held back. Attributes the pinned freeze horizon to a holder: a running transaction, a replication slot, standby feedback, or a prepared transaction. This tells you exactly what to terminate or clean up so vacuum can advance the horizon again.
Autovacuum
Detects autovacuum falling behind (default: dead tuples at least 2x the autovacuum trigger). Bloat and wraparound risk grow when vacuum cannot keep up.
Use the charts to tell whether vacuum is behind and why:
- Autovacuum Pressure. Dead tuples divided by the table's own trigger threshold. Healthy tables sawtooth around 1 (crossing 1 is what triggers a vacuum), so a table that stays above 1 is not being serviced. Because it is normalized to the trigger, a large table's normal peak does not raise a false alarm.
- Dead tuples by table. The materiality in bytes, so you focus on the tables that actually hold a lot of reclaimable space rather than a tiny table far past its trigger.
- Time since last autovacuum by table. If the table was vacuumed long ago, autovacuum is not running it (disabled, starved, or mis-tuned). If it was vacuumed recently but dead tuples keep piling up, a snapshot is holding the vacuum horizon (a long-running transaction, prepared transaction, or replication slot). See the oldest-xmin holder above.
- Autovacuum workers and Throttled autovacuum workers. If all workers are busy, vacuum is
waiting for a free worker (raise
autovacuum_max_workers). If a worker is on the table but throttled, it is sleeping on the cost-based delay (raiseautovacuum_vacuum_cost_limitor lowerautovacuum_vacuum_cost_delay).
The vacuum charts, along with the transaction ID wraparound and autoanalyze pressure charts above, are grouped together in the report:
Stale statistics
Detects tables whose planner statistics are stale (default: rows modified at least 2x the autoanalyze trigger). Stale statistics lead the planner to pick bad plans, and are a common cause of a sudden latency regression after a bulk load or a burst of writes.
- Autoanalyze Pressure. Rows modified divided by the table's own autoanalyze trigger. A large table stuck above about 2x has not been analyzed recently, and the planner is working from stale row estimates.
- Time since last analyze by table. Confirms how long the statistics have been stale and
whether autoanalyze is disabled on the table. The fix is to run
ANALYZE.
Bloat
Estimates wasted space in tables and indexes and flags databases whose bloat exceeds the
threshold (default 50%). Bloat is space that only VACUUM FULL, pg_repack, or a REINDEX
returns to the OS, distinct from dead rows that ordinary vacuum reclaims for reuse.
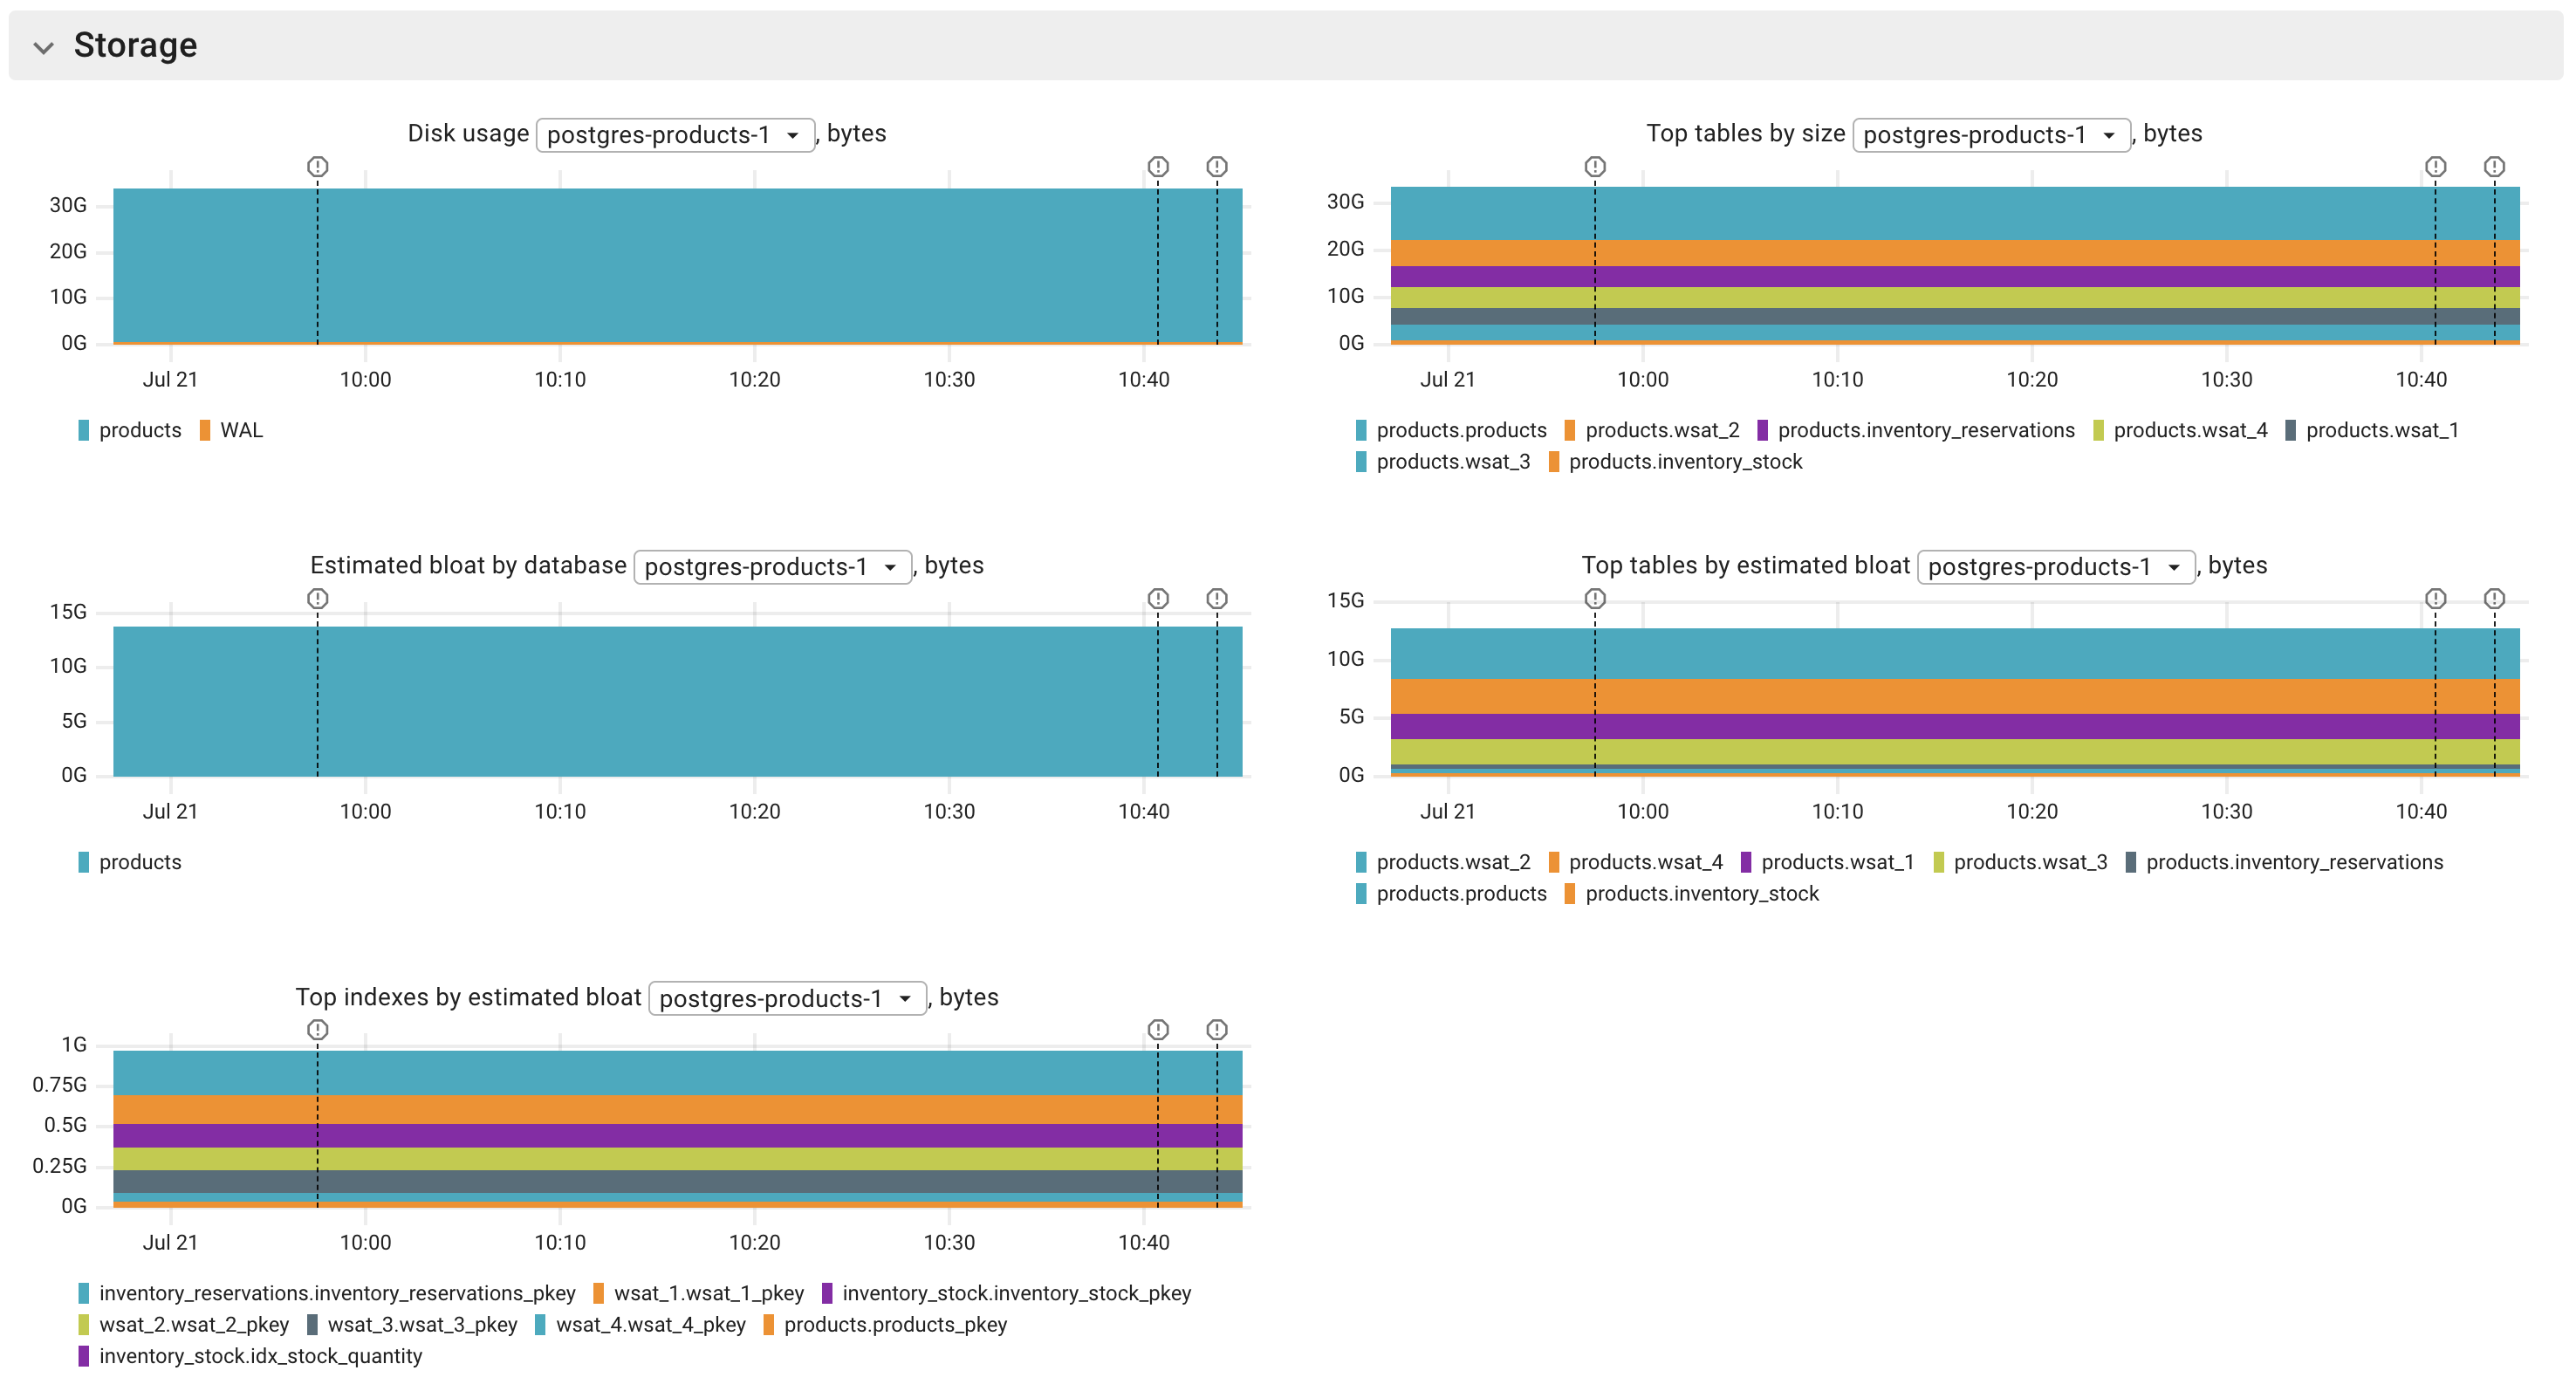
- Estimated bloat by database. The total estimated wasted space, to see which database is worst and whether it is trending up.
- Top tables by estimated bloat and Top indexes by estimated bloat. The specific relations
to target. Rewrite a bloated table with
VACUUM FULLorpg_repack, and rebuild a bloated index withREINDEX.
Bloat is shown alongside disk usage and the largest tables (see Storage & WAL):
Backups
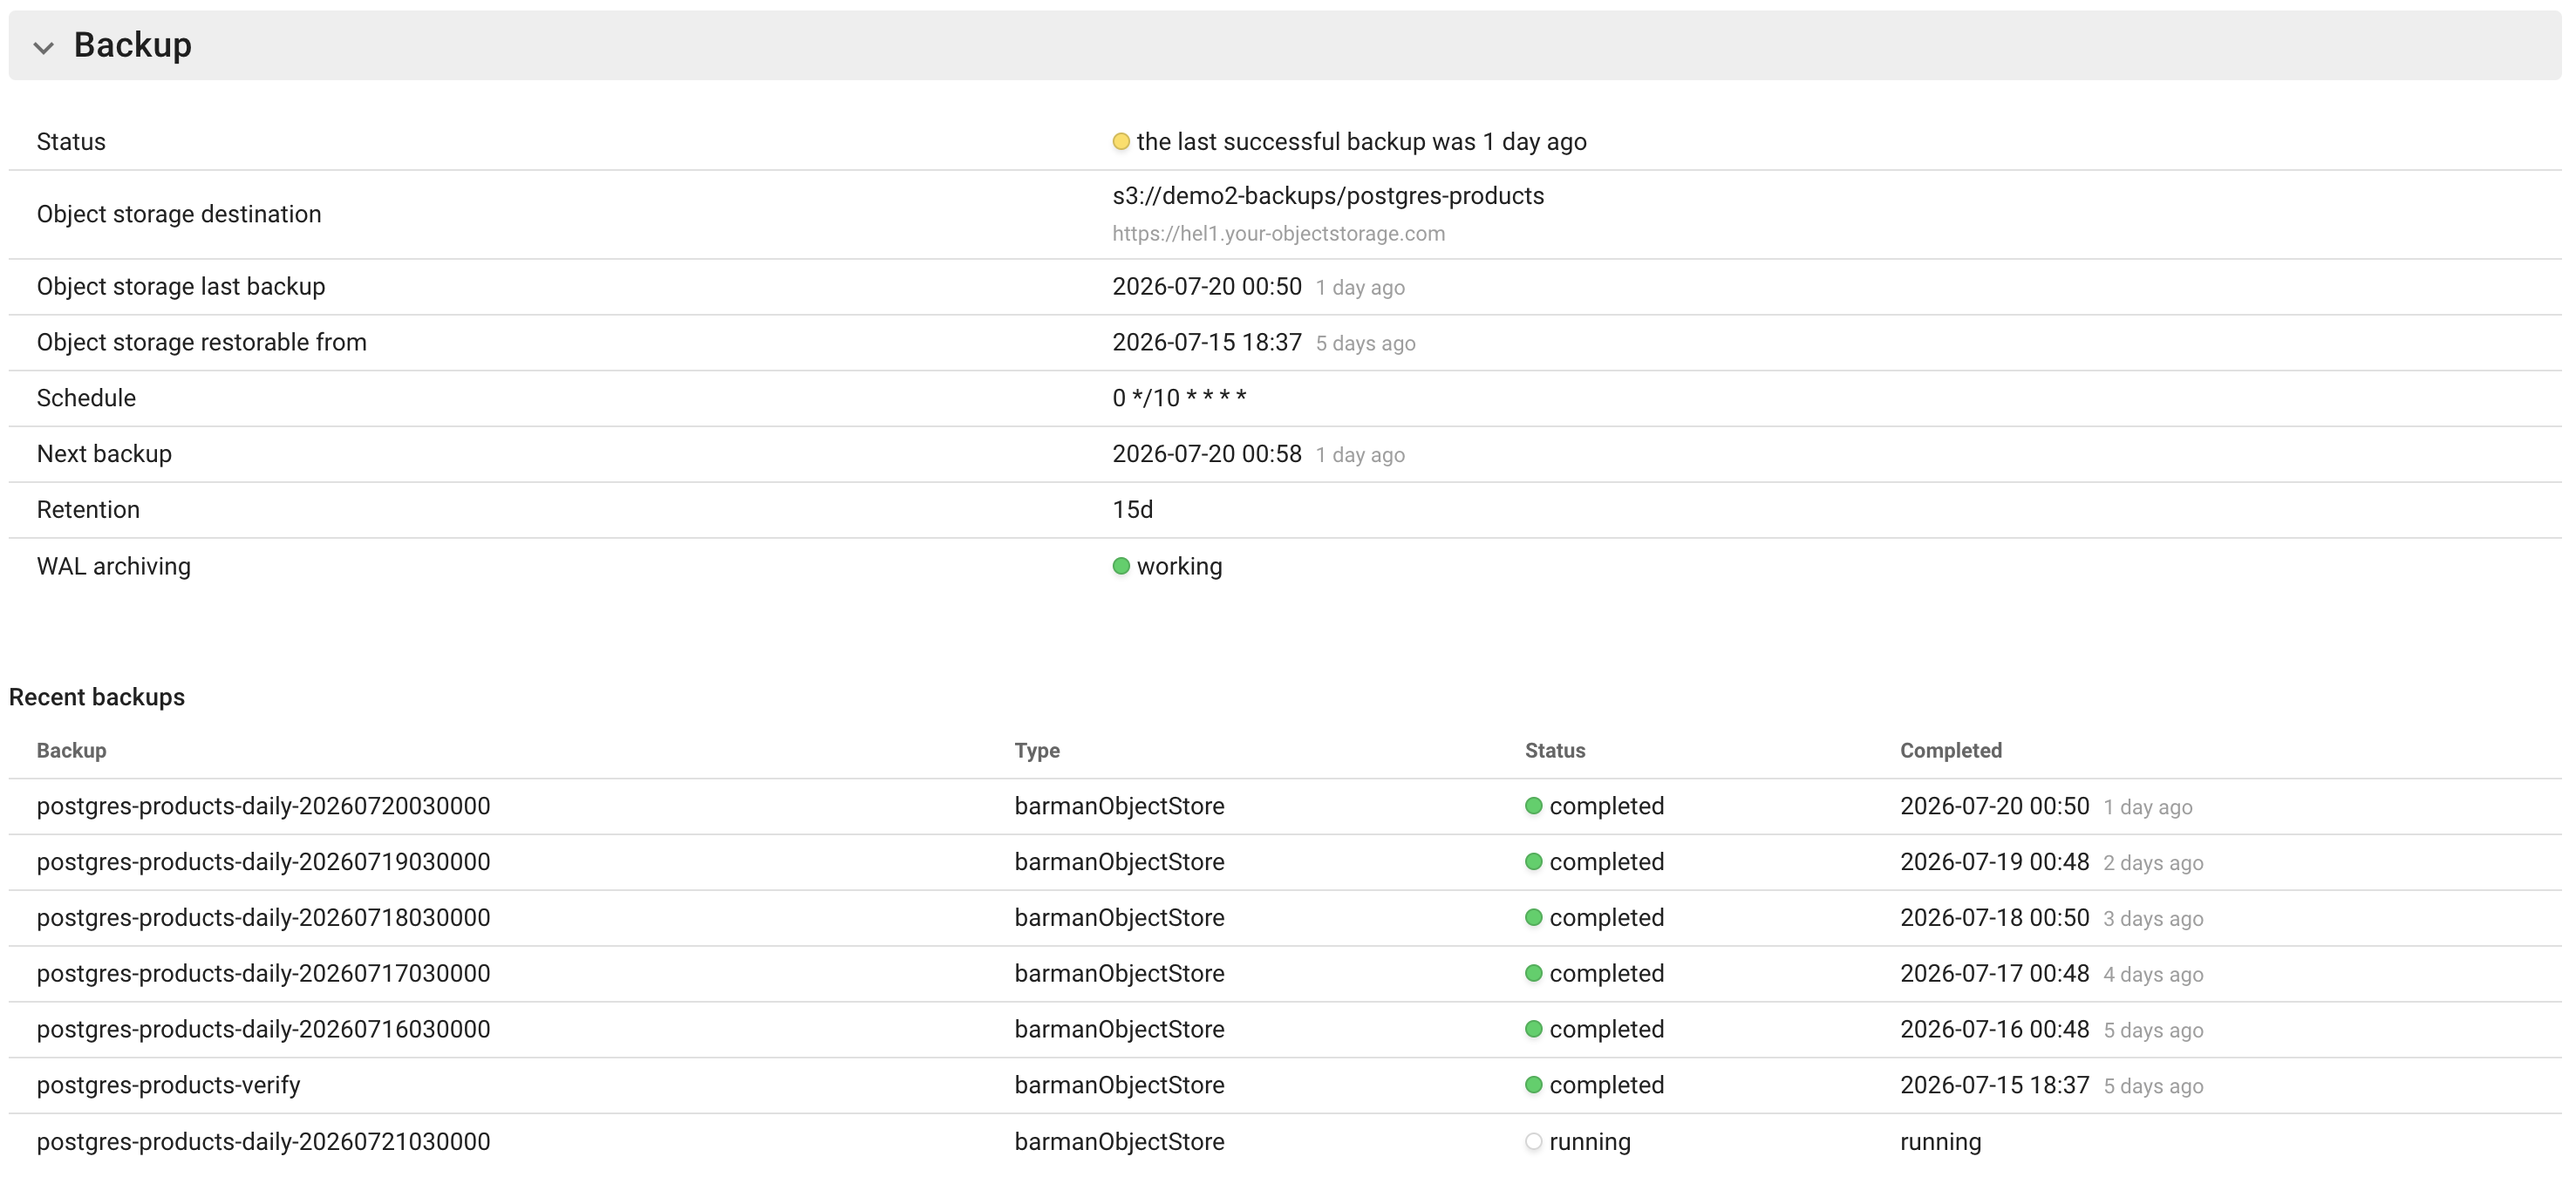
Reports whether cluster backups are healthy for clusters managed by CloudNativePG or the Percona Operator. It alerts when the last successful backup is older than the threshold (default 24h), when a backup fails, when continuous WAL archiving is broken, or when a scheduled backup is overdue (derived from the schedule and the last backup, so a stalled scheduler is caught). When backups are failing, Coroot surfaces the operator's condition reason, for example "the pgBackRest repository isn't initialized, check the backup storage and credentials".
The section shows the backup status, destinations, schedule, retention, last and next backup, recovery window, and a Recent backups list with each run's type, status, and completion time.
Storage & WAL
These charts help you find where disk space is going and, in particular, why WAL is not being freed:
- WAL size, bytes. The WAL directory size against
max_wal_size. A WAL directory growing well pastmax_wal_sizealmost always means WAL cannot be removed, either because archiving is failing or a replication slot is holding it back. - Replication slots retained WAL. WAL pinned per slot. An inactive slot whose retained WAL climbs steadily is a classic cause of a filling disk. Dropping the unused slot releases it.
- Disk usage and Top tables by size. Where space is going overall, and the largest tables driving it.