JVM
The following inspections are based on the JVM metrics automatically collected by coroot-node-agent for each JVM running on the node.
No configuration is needed for basic JVM monitoring.
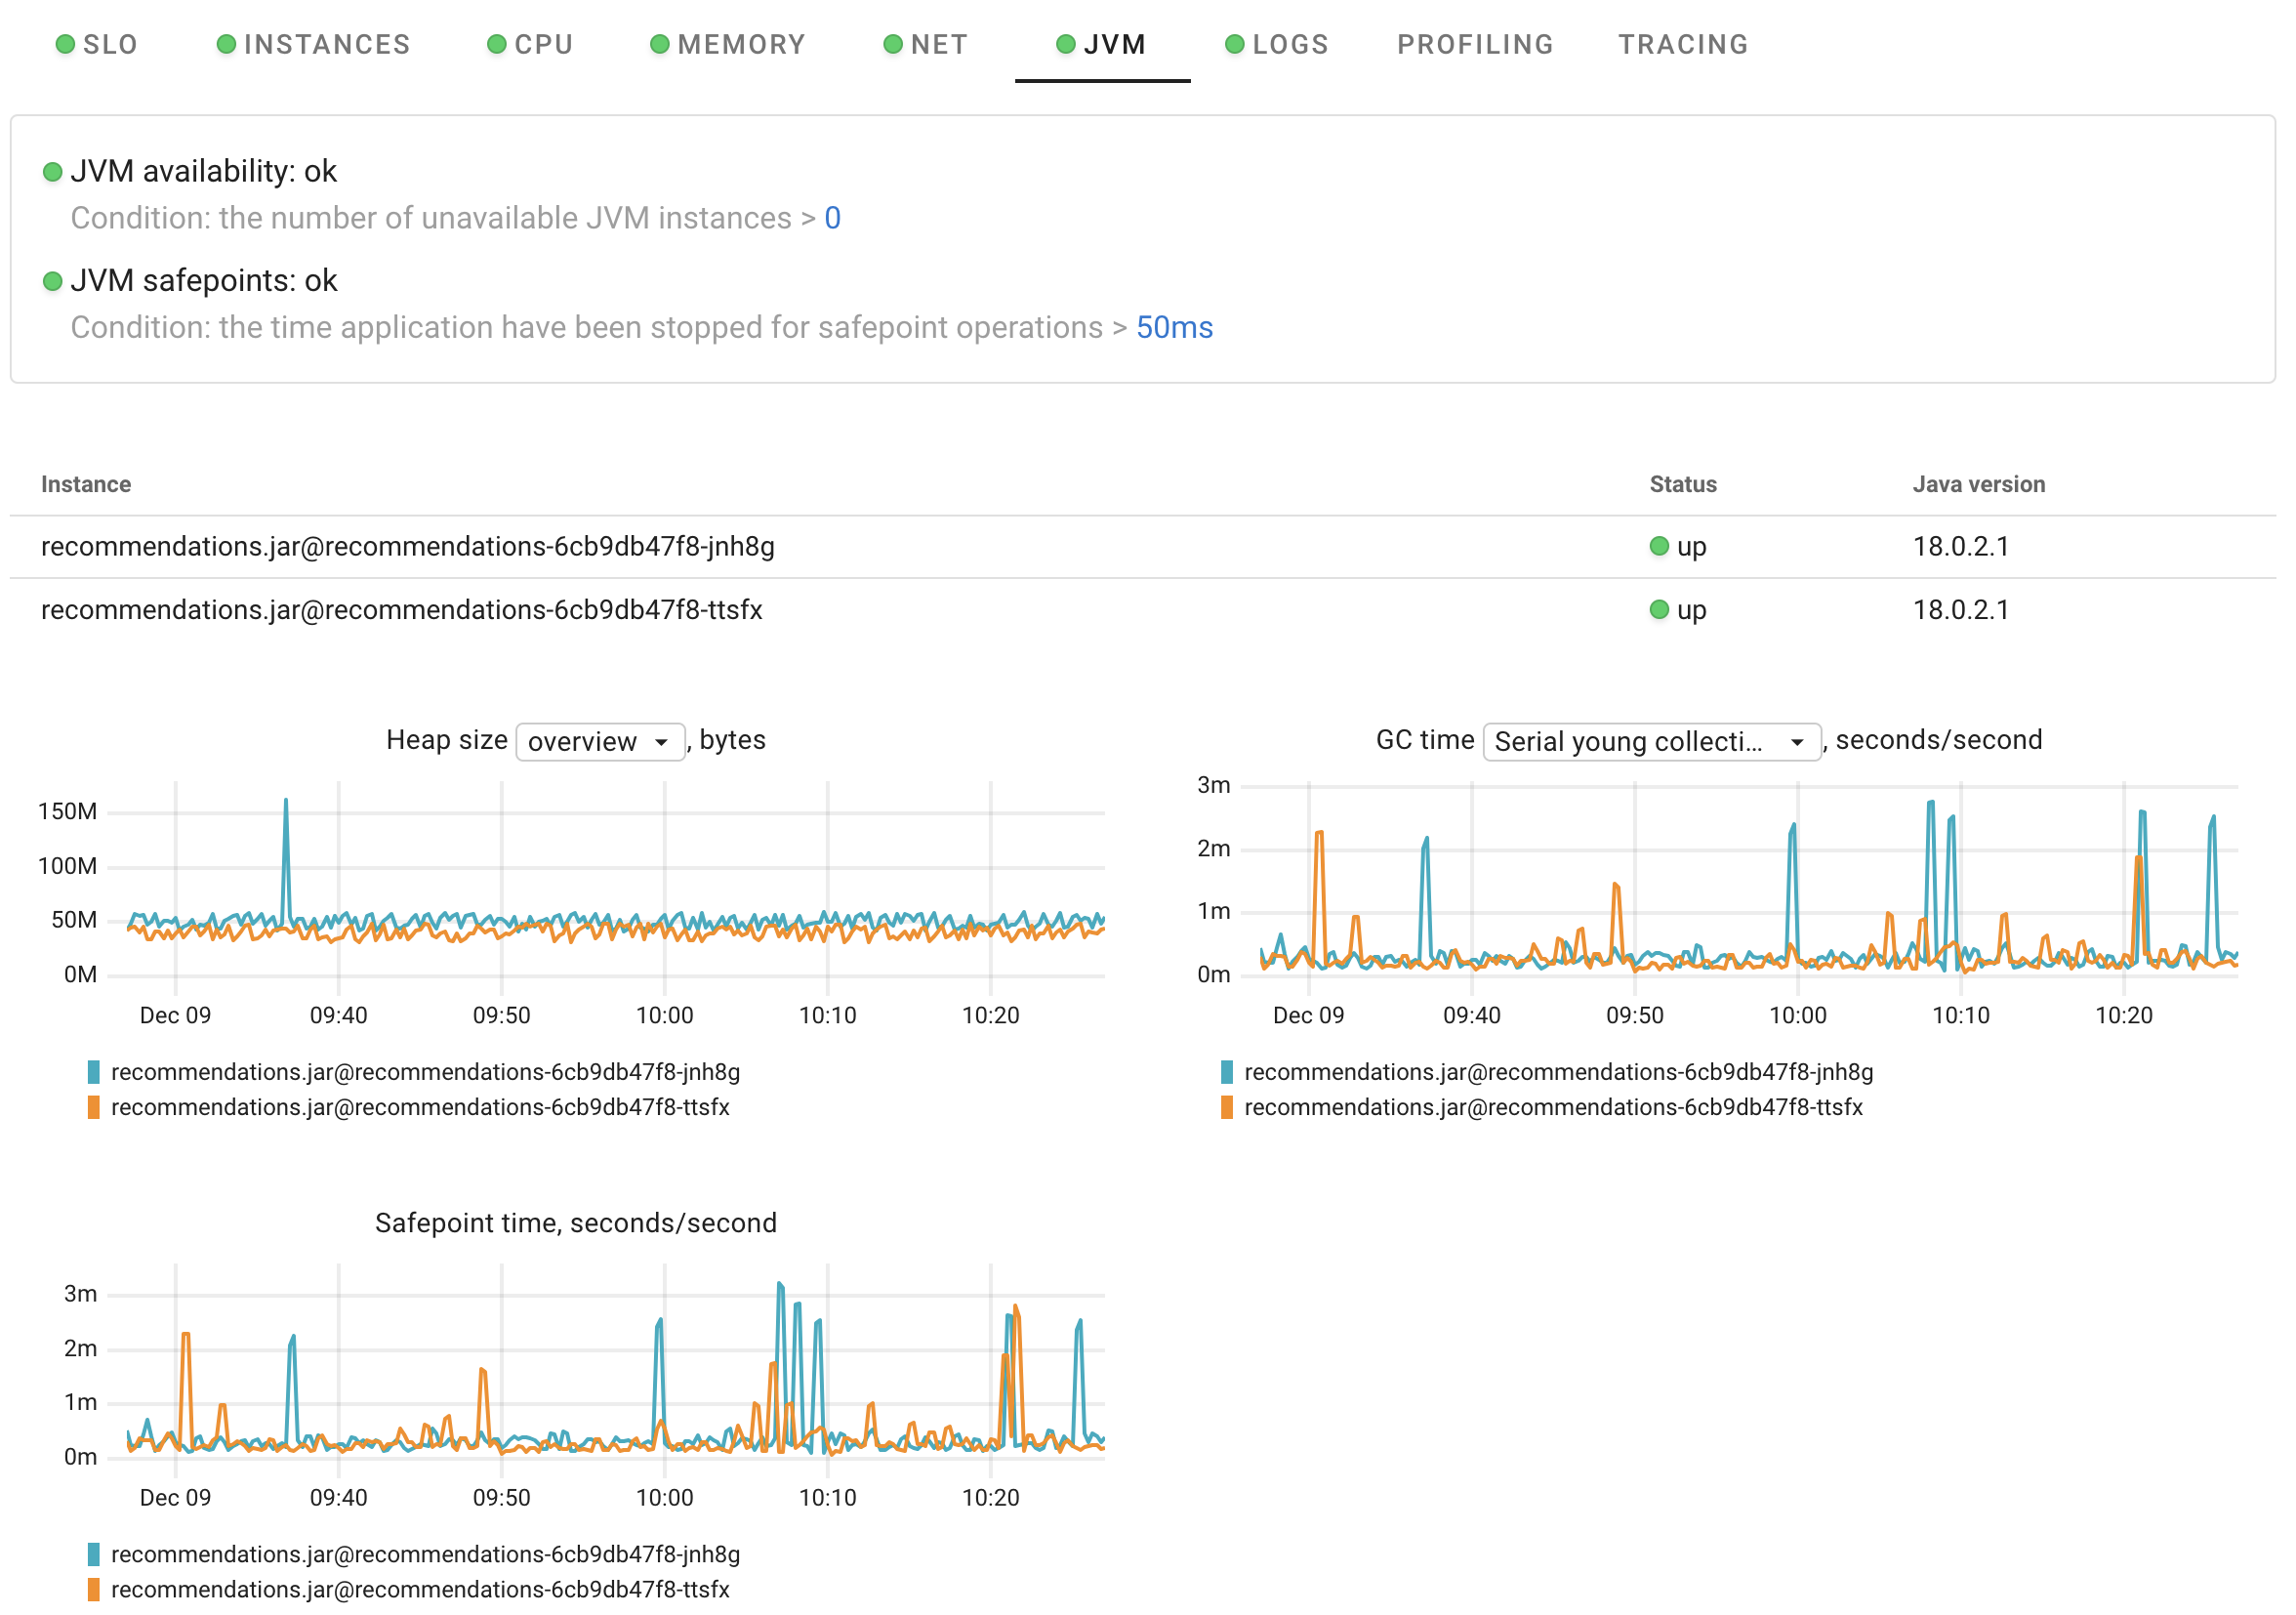
Checks
- JVM availability: checks that every JVM is up and running
- JVM safepoints: detects situations when a Java application has been stopped for a significant amount of time due to safepoint operations
Charts
The JVM report includes the following chart groups:
- Heap size: current heap usage and maximum heap size (
-Xmx) per JVM instance - GC time: time spent in garbage collection, broken down by collector
- Safepoint time: time the application is paused for safepoint operations
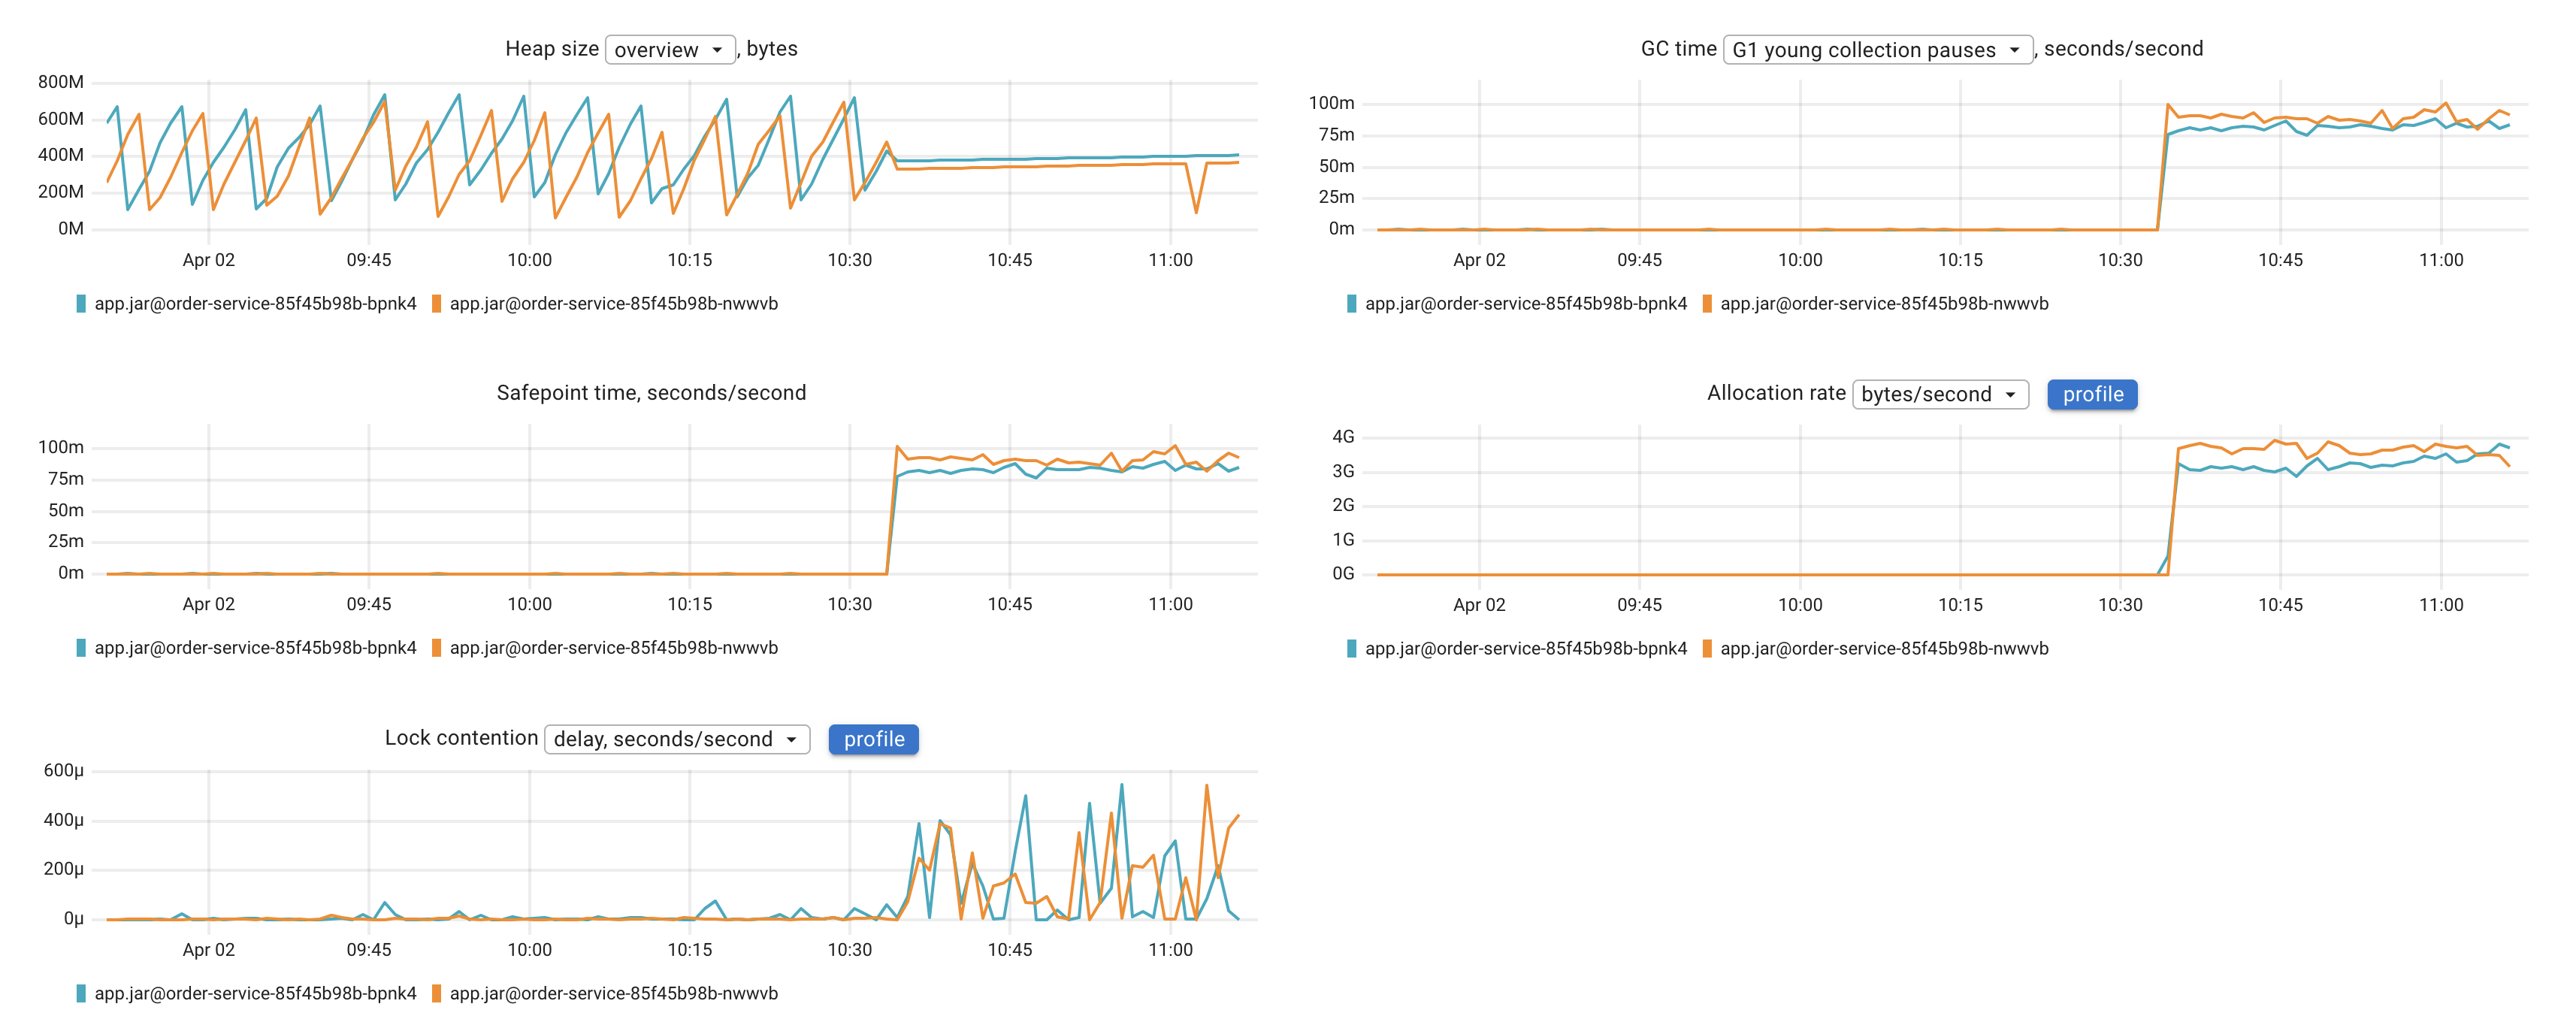
When async-profiler is enabled, two additional chart groups appear:
- Allocation rate: bytes/second and objects/second allocated per JVM instance. Each chart links to the memory allocation profile for deeper analysis.
- Lock contention: contentions/second and lock wait delay per JVM instance. Each chart links to the lock contention profile.
eBPF-based CPU profiling for Java
Coroot uses eBPF to capture CPU profiles at the kernel level with minimal overhead. However, because the JVM relies heavily on JIT compilation, the generated native code does not include symbolic information by default. To make the profiles readable, the JVM needs to expose symbol information via jcmd <pid> Compiler.perfmap.
Coroot automates this step by periodically calling jcmd in the background. However, the JVM must be started with the -XX:+PreserveFramePointer option. This allows for accurate stack traces and proper symbolization of JIT-compiled code, with only a small performance overhead (typically around 1-3%).
async-profiler for Java
For richer Java profiling (CPU without PreserveFramePointer, memory allocations, and lock contention),
see Java profiling with async-profiler.