GPU
Coroot provides real-time visibility into GPU usage across your applications, helping you understand performance bottlenecks, detect resource contention, and optimize workloads running on GPU-enabled nodes.
Overview
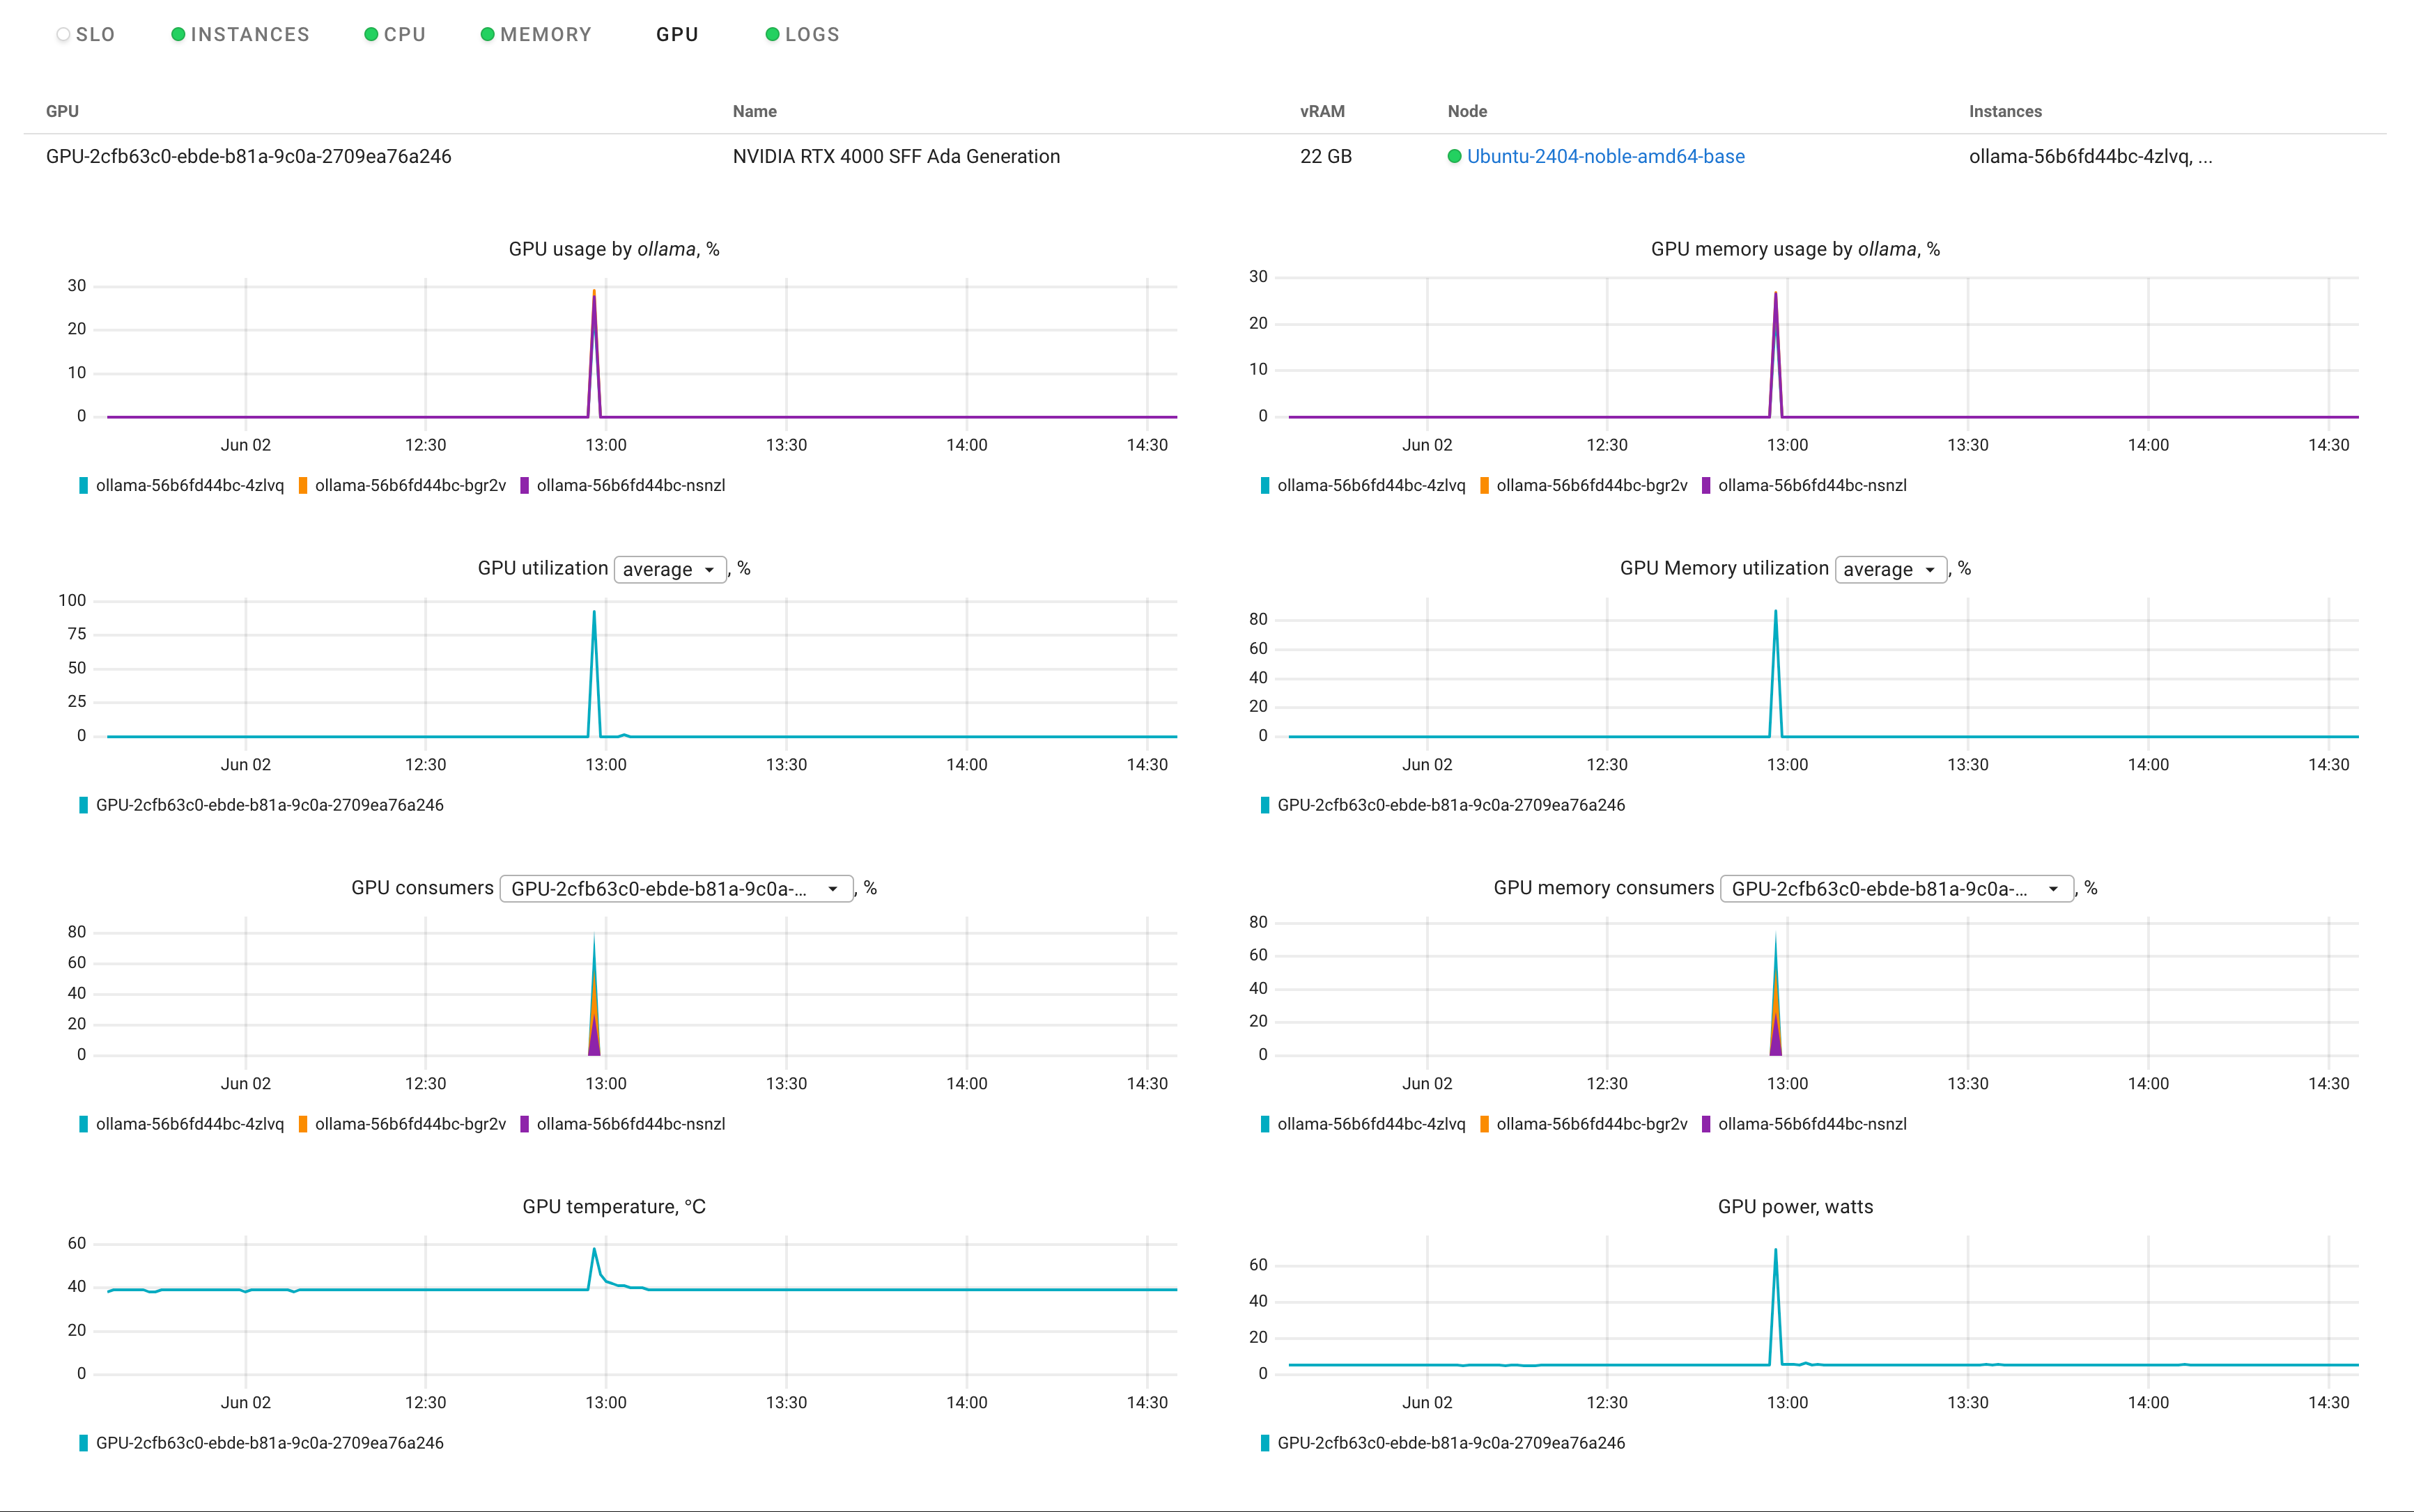
The GPU tab in the Application view (e.g., ollama) shows detailed metrics collected from NVIDIA GPUs used by your workloads.
These metrics include both per-application and global GPU stats, presented in easy-to-read time-series charts.
Dashboard
GPU Usage by Application (%)
Shows the percentage of GPU compute resources used by each instance of the application (e.g., ollama-56b6fd44bc-4zlvq).
This reflects SM (streaming multiprocessor) usage.
GPU Memory Usage by Application (%)
Tracks how much GPU memory is used by each application container, expressed as a percentage of total available memory.
GPU Utilization (%)
Displays the overall utilization of the GPU's compute resources, averaged across all consumers. This helps identify how busy the GPU is during the observed timeframe.
GPU Memory Utilization (%)
Indicates how much of the GPU memory is in use, averaged across the timeframe. Spikes here can indicate memory-heavy operations like loading large models.
GPU Consumers
Breaks down GPU utilization by each container using the GPU. This provides transparency into which workloads are actively consuming compute resources.
GPU Memory Consumers
Shows how GPU memory is distributed across running containers. Useful for detecting memory-hungry processes.
GPU Temperature (°C)
Reports the real-time operating temperature of the GPU. Overheating may suggest thermal throttling or cooling issues.
GPU Power Usage (Watts)
Displays the power consumption of the GPU in watts. Power spikes usually correlate with high GPU utilization or memory usage.