.NET
This inspection relies on .NET runtime metrics automatically collected by coroot-node-agent for every .NET runtime running on the node.
It works out of the box without any configuration but requires .NET diagnostic ports to be enabled.
This inspection helps troubleshoot various issues in your .NET applications, such as:
- Increased application latency due to GC (Garbage Collection) activity
- ThreadPool starvation, which might also cause increased service latency
- Performance degradation due to Large Object Heap (LOH) fragmentation
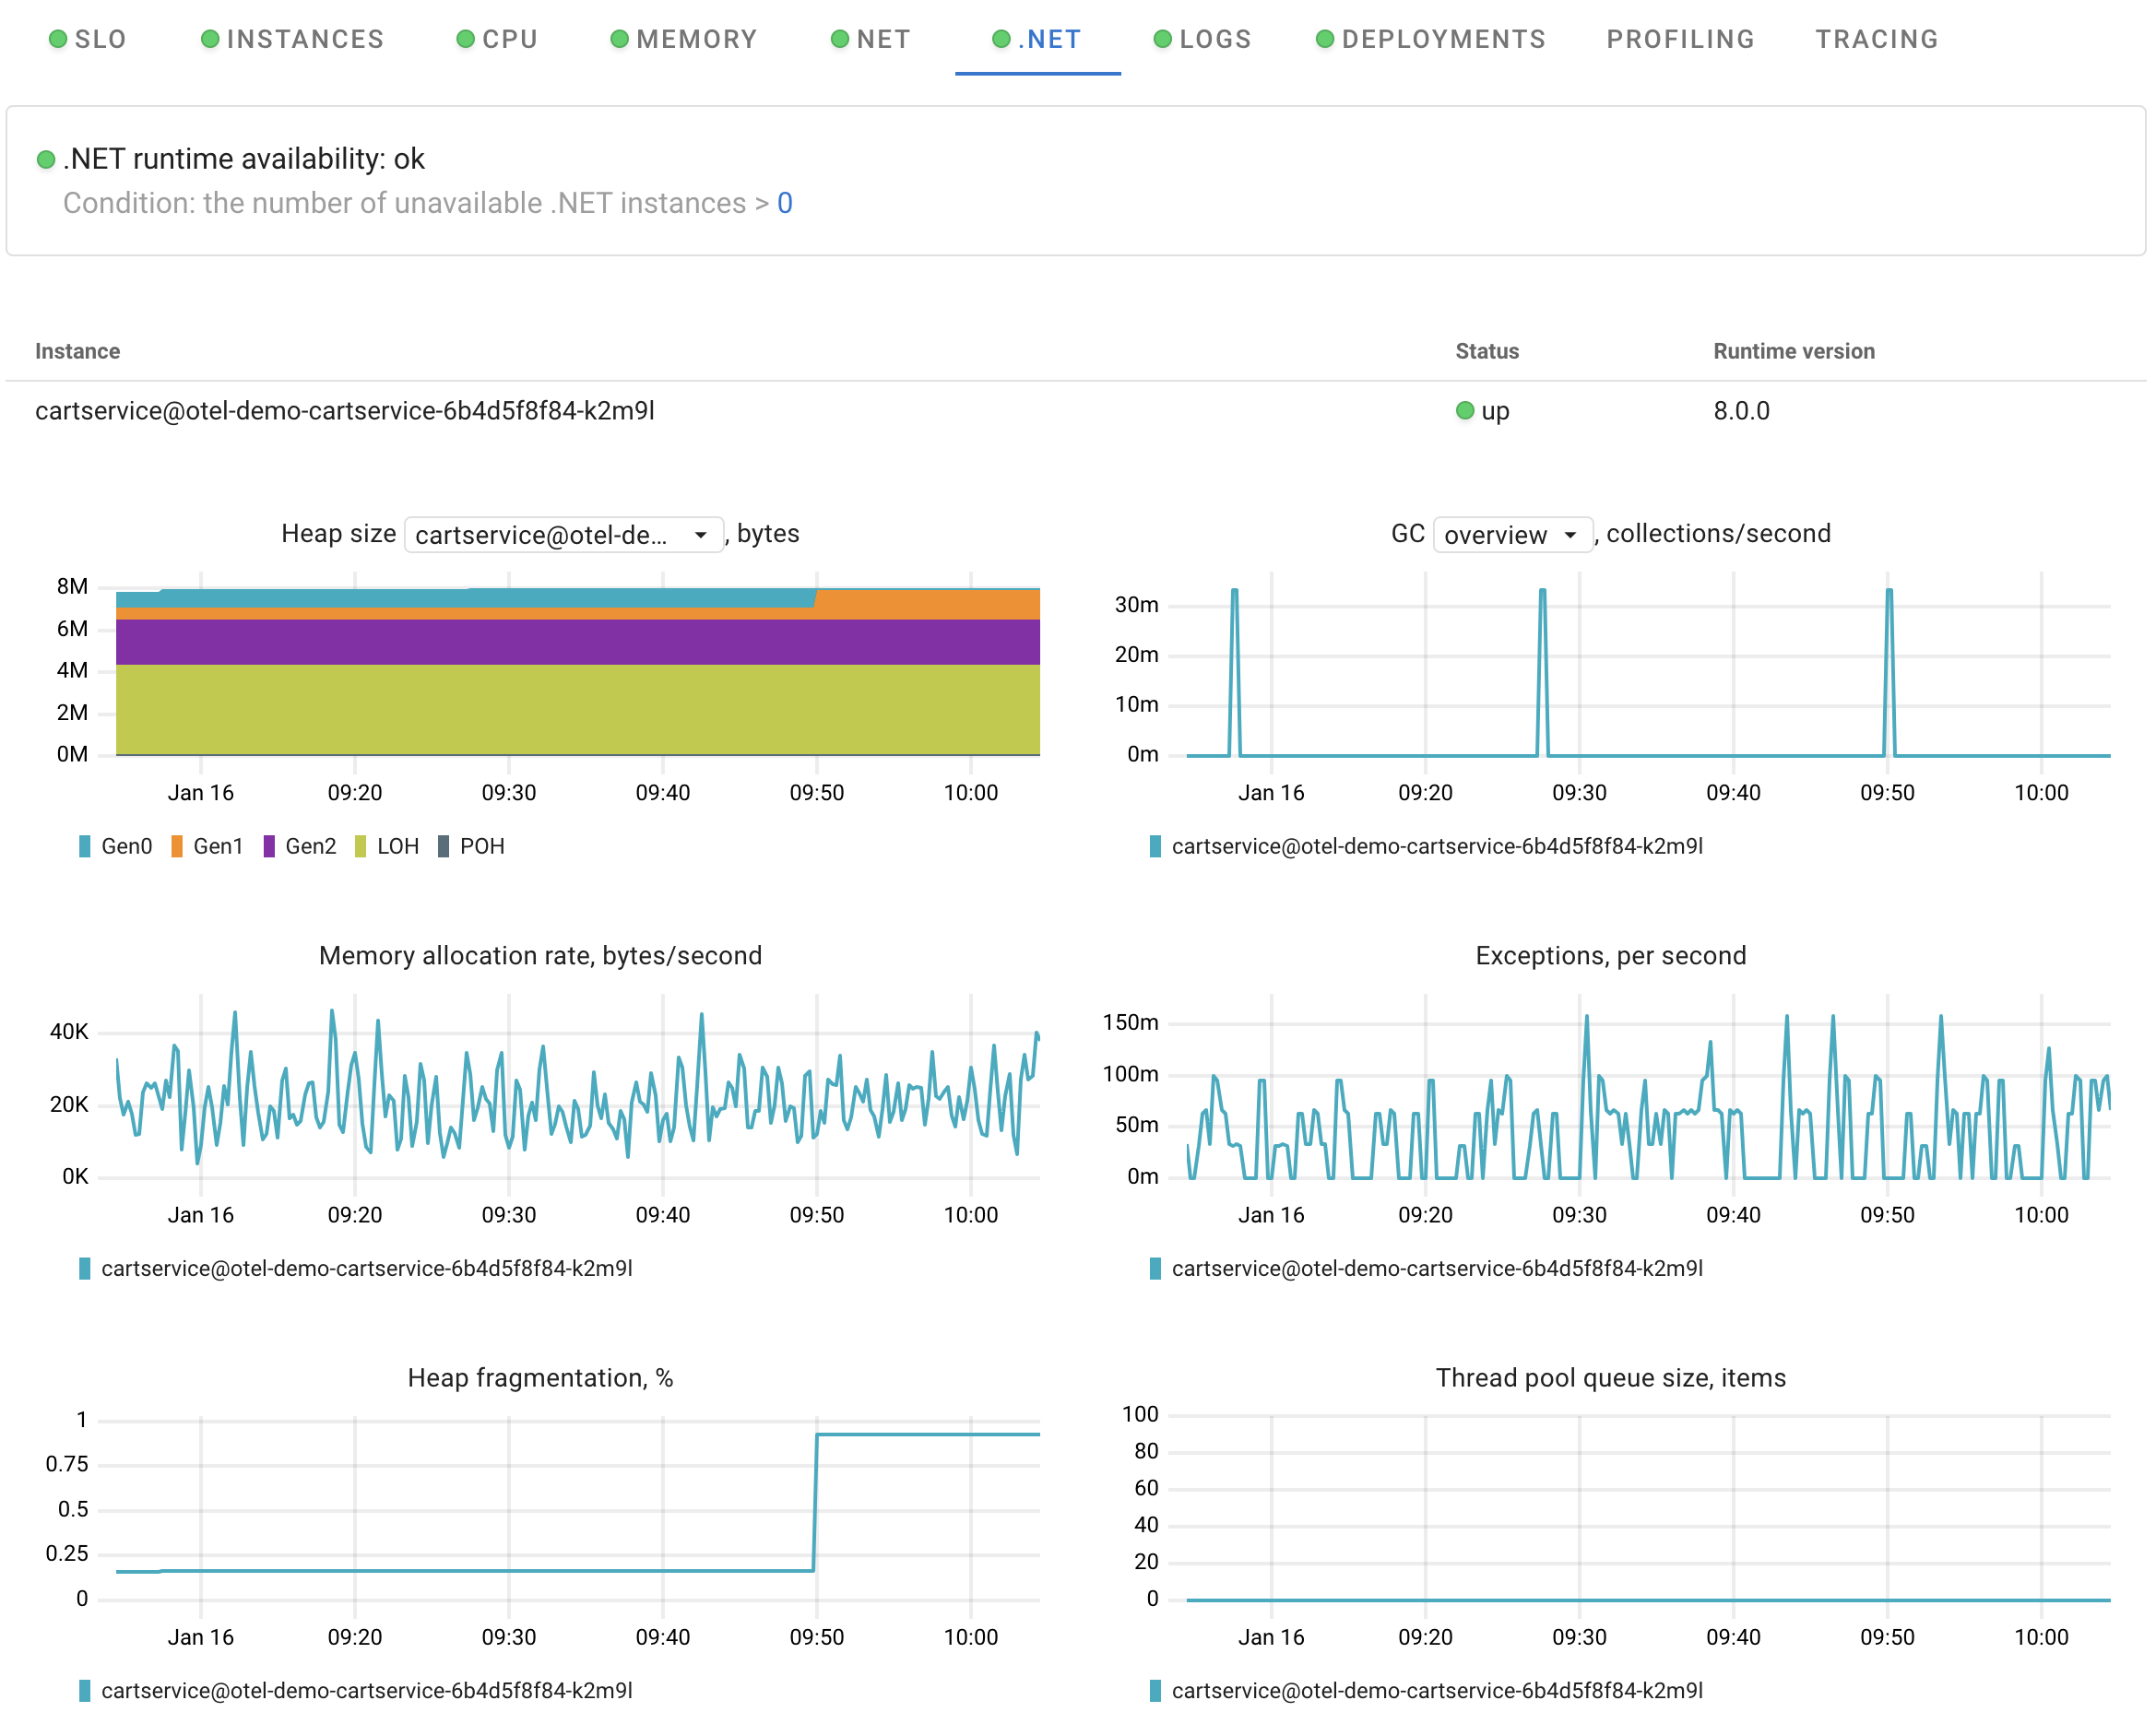
Dashboard
Heap size
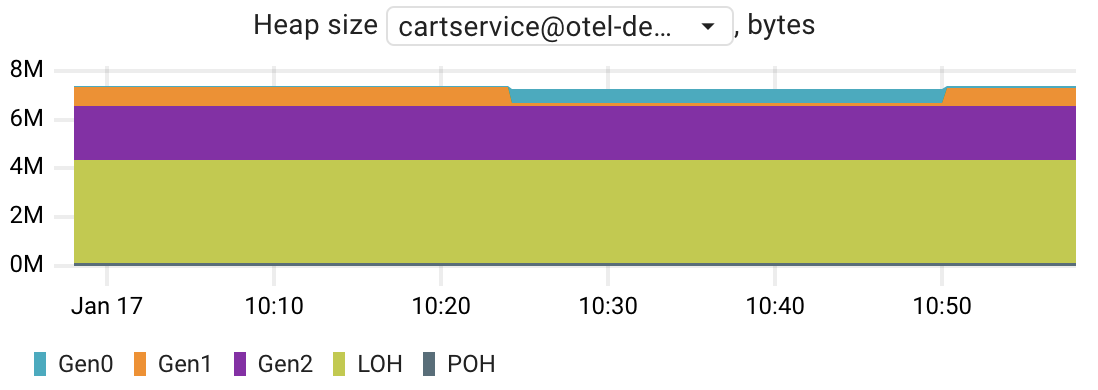
This chart shows the distribution of allocated objects across different heap "Generations" and can provide insights into the following questions:
- What percentage of allocated objects is found in each generation?
- How efficiently is memory released after garbage collection in each generation?
The Garbage Collection (GC) algorithm within .NET runtime is designed based on several key considerations to optimize performance. It divides the managed heap into three generations (0, 1, and 2) to handle short-lived and long-lived objects separately. Generation 0 is the youngest and mostly contains short-lived objects, undergoing frequent collections. Generation 1 acts as a buffer for short-lived and long-lived objects, and Generation 2 holds long-lived objects.
Newly allocated objects start in Generation 0, and if they survive collections, they are promoted to higher generations. This strategy allows the GC to release memory more efficiently, as it's faster to compact portions of the heap than the entire heap. If Generation 0 collections do not reclaim enough memory, the GC proceeds to Generation 1 and then Generation 2.
Generation 2 consists of long-lived objects, and objects surviving its collection remain there until determined unreachable. Large objects on the Large Object Heap (LOH) are also collected in Generation 2. This multi-generational approach enhances the efficiency of garbage collection in managing memory in the .NET runtime environment.
The Heap Size chart is based on the container_dotnet_memory_heap_size_bytes metric.
GC activity
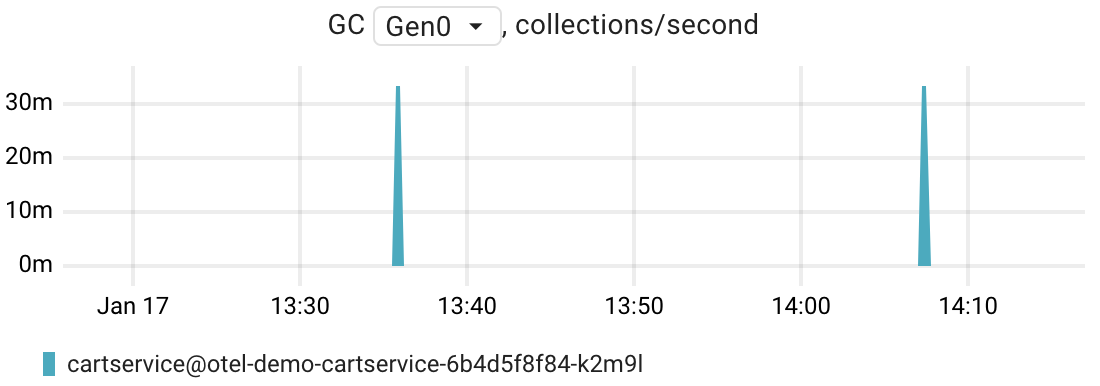
This chart displays the frequency of Garbage Collection (GC) occurrences in each generation, enabling you to find answers to questions such as:
- When did GC occur within each generation for a specific application instance?
- How frequently does the garbage collector collect objects in a particular generation?
Garbage collection is triggered in two scenarios: when the system experiences low physical memory, and when the memory occupied by allocated objects on the managed heap exceeds a dynamically adjusted threshold throughout the runtime of the process.
The chart is based on the container_dotnet_gc_count_total metric.
In addition to per-generation views, it offers an "overview" presenting all Garbage Collection (GC) activities within each application instance.
Memory allocation rate
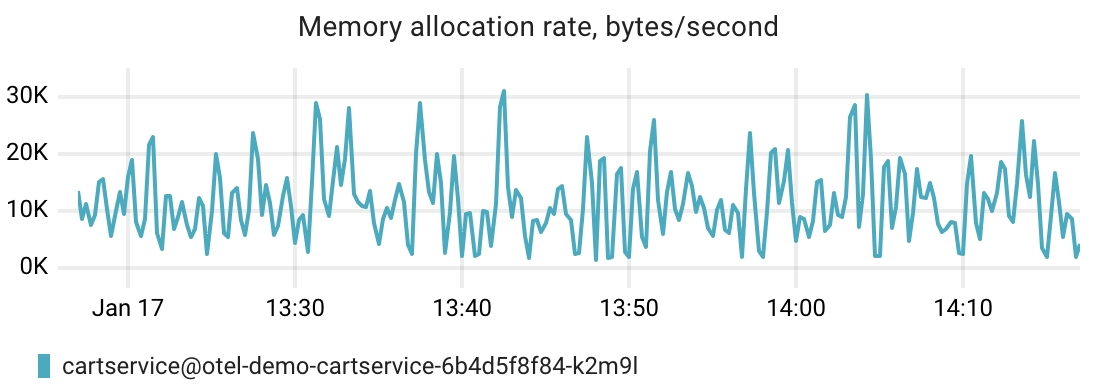
This chart displays memory allocation rate at the runtime level, specifically within the managed heap of the .NET application. It reflects the rate at which new memory is allocated for objects within the application during a specific period.
The underlying container_dotnet_memory_allocated_bytes_total metric is useful for tracking memory allocation behavior and can be valuable in optimizing memory usage,
identifying memory leaks, and assessing the impact of code changes on memory consumption within the managed environment.
Exceptions
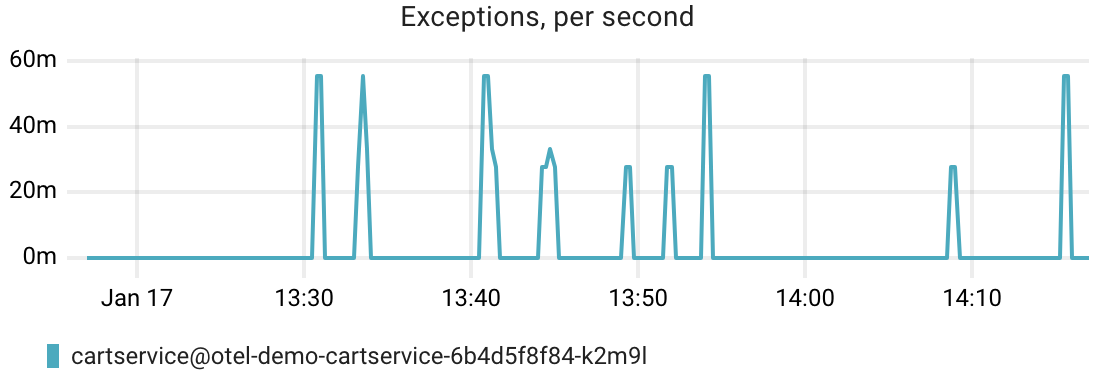
This chart can be helpful in troubleshooting by providing insights into the occurrence of exceptions within an application. Here are several ways this metric can assist in the troubleshooting process:
- Identifying Exception Frequency: the underlying
container_dotnet_exceptions_totalmetric indicates how many exceptions have occurred. A sudden spike or a consistently high count may point to potential issues in the application. - Spotting Trend Changes: monitoring changes in this metric over time can help identify periods of increased exception occurrences, allowing you to correlate these spikes with changes in code, deployments, or system conditions.
Heap fragmentation
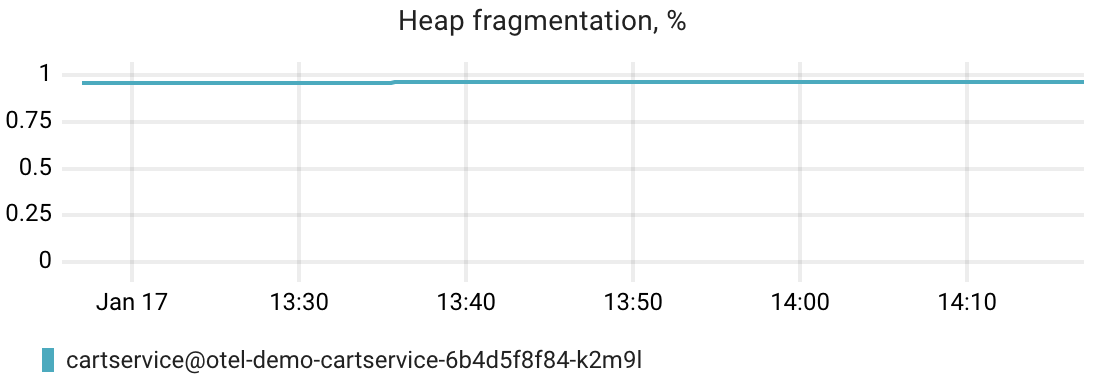
Large Object Heap (LOH) fragmentation in a .NET application can lead to various performance issues and failure scenarios. The Large Object Heap is a special heap in the .NET Common Language Runtime (CLR) that is dedicated to storing large objects, typically those that are 85,000 bytes or larger. Here are some potential failure scenarios and issues that can arise due to LOH fragmentation:
-
Out-of-Memory Exceptions: fragmentation in the LOH can lead to inefficient memory utilization, causing the application to encounter out-of-memory exceptions even when there is technically enough free memory in the process. This is because the LOH may not have a contiguous block of free memory large enough to satisfy the allocation request.
-
Garbage Collection Overhead: frequent large object allocations and deallocations can result in increased garbage collection overhead. If the LOH is heavily fragmented, the garbage collector may spend more time trying to compact the heap, impacting the application's overall performance.
-
Performance Degradation: fragmentation can lead to slower memory allocations and deallocations, affecting the overall performance of the application. Large object allocations may take longer, and the garbage collector may need to work harder to manage memory.
The underlying container_dotnet_heap_fragmentation_percent metric
is calculated as the ratio of free space over the total allocated memory for the LOH generation.
ThreadPool queue length
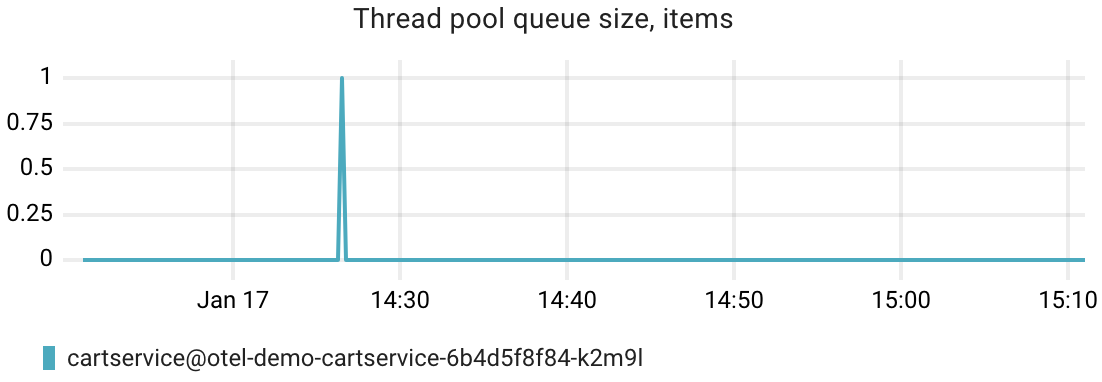
The container_dotnet_thread_pool_queue_length metric can help you identify ThreadPool saturation, where the ThreadPool struggles to efficiently process
incoming work items due to a bottleneck in available threads.
Given the heavy reliance of .NET web frameworks on the ThreadPool for handling incoming web requests,
its saturation can significantly impact application latency.
If the queue of pending work items becomes too long, the application experiences delays in task execution because there aren't enough available threads to pick up and process the queued tasks.
ThreadPool saturation often indicates resource contention, where threads are competing for resources such as CPU time or shared locks.
ThreadPool size
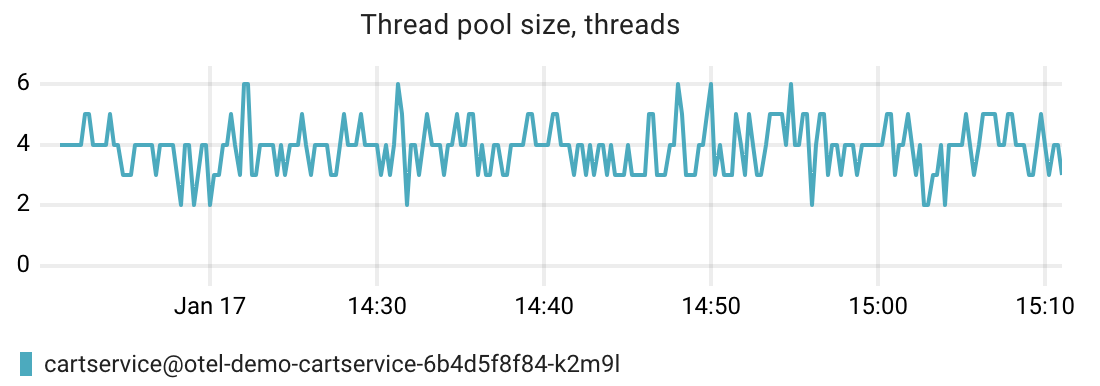
The container_dotnet_thread_pool_size metric provides information
about the current number of worker threads in the ThreadPool.
A consistent or sudden increase may indicate high demand, potential saturation, or even thread leaks.
As per the .NET documentation, the default size of the thread pool for a process depends on various factors, including the size of the virtual address space.
ThreadPool completed work items
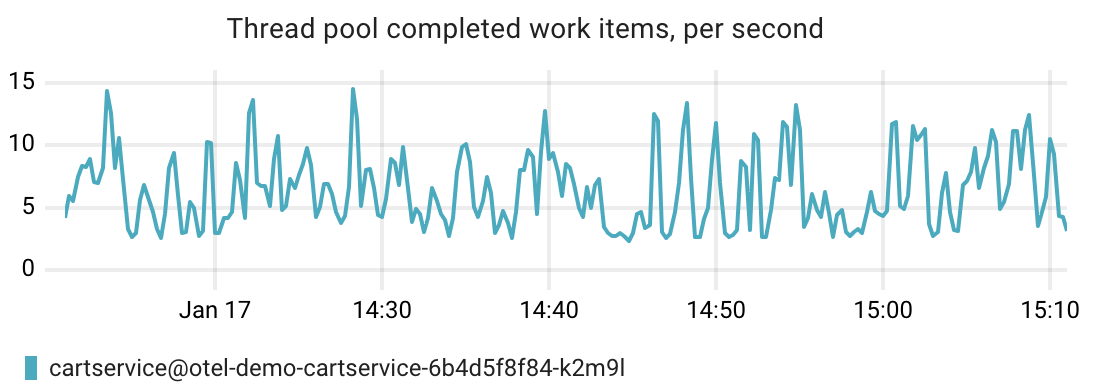
The container_dotnet_thread_pool_completed_items_total metric
provides information about the number of completed work items in the ThreadPool.
It allows you to assess the performance of an application and compare workloads over time.
Monitor's lock contentions
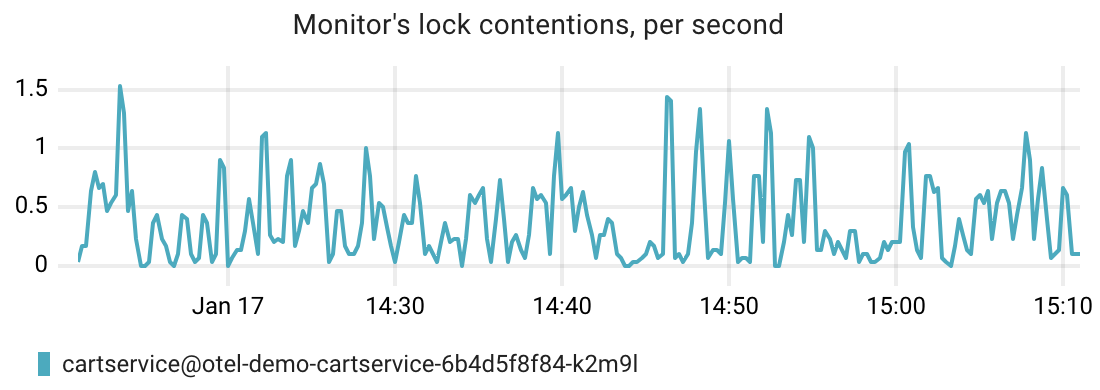
The container_dotnet_monitor_lock_contentions_total metric
provides insight into the level of contention that occurs when multiple threads are attempting to acquire a monitor lock.
In multithreaded programming, a monitor is a synchronization primitive that is often associated with a lock. It ensures that only one thread can execute a critical section of code (protected by the lock) at any given time. This is crucial for maintaining data consistency and avoiding race conditions.
Lock contention occurs when multiple threads attempt to acquire the same lock simultaneously, but only one of them can succeed. The remaining threads must wait until the lock becomes available. Contention can lead to performance issues such as increased response times, and decreased throughput.