Service Level Objectives (SLOs)
These inspections allow you to monitor the Availability and Latency SLOs (Service Level Objectives) for every application. By default, Coroot tracks the application layer metrics gathered by coroot-node-gent, but you can replace them with your custom Prometheus metrics.
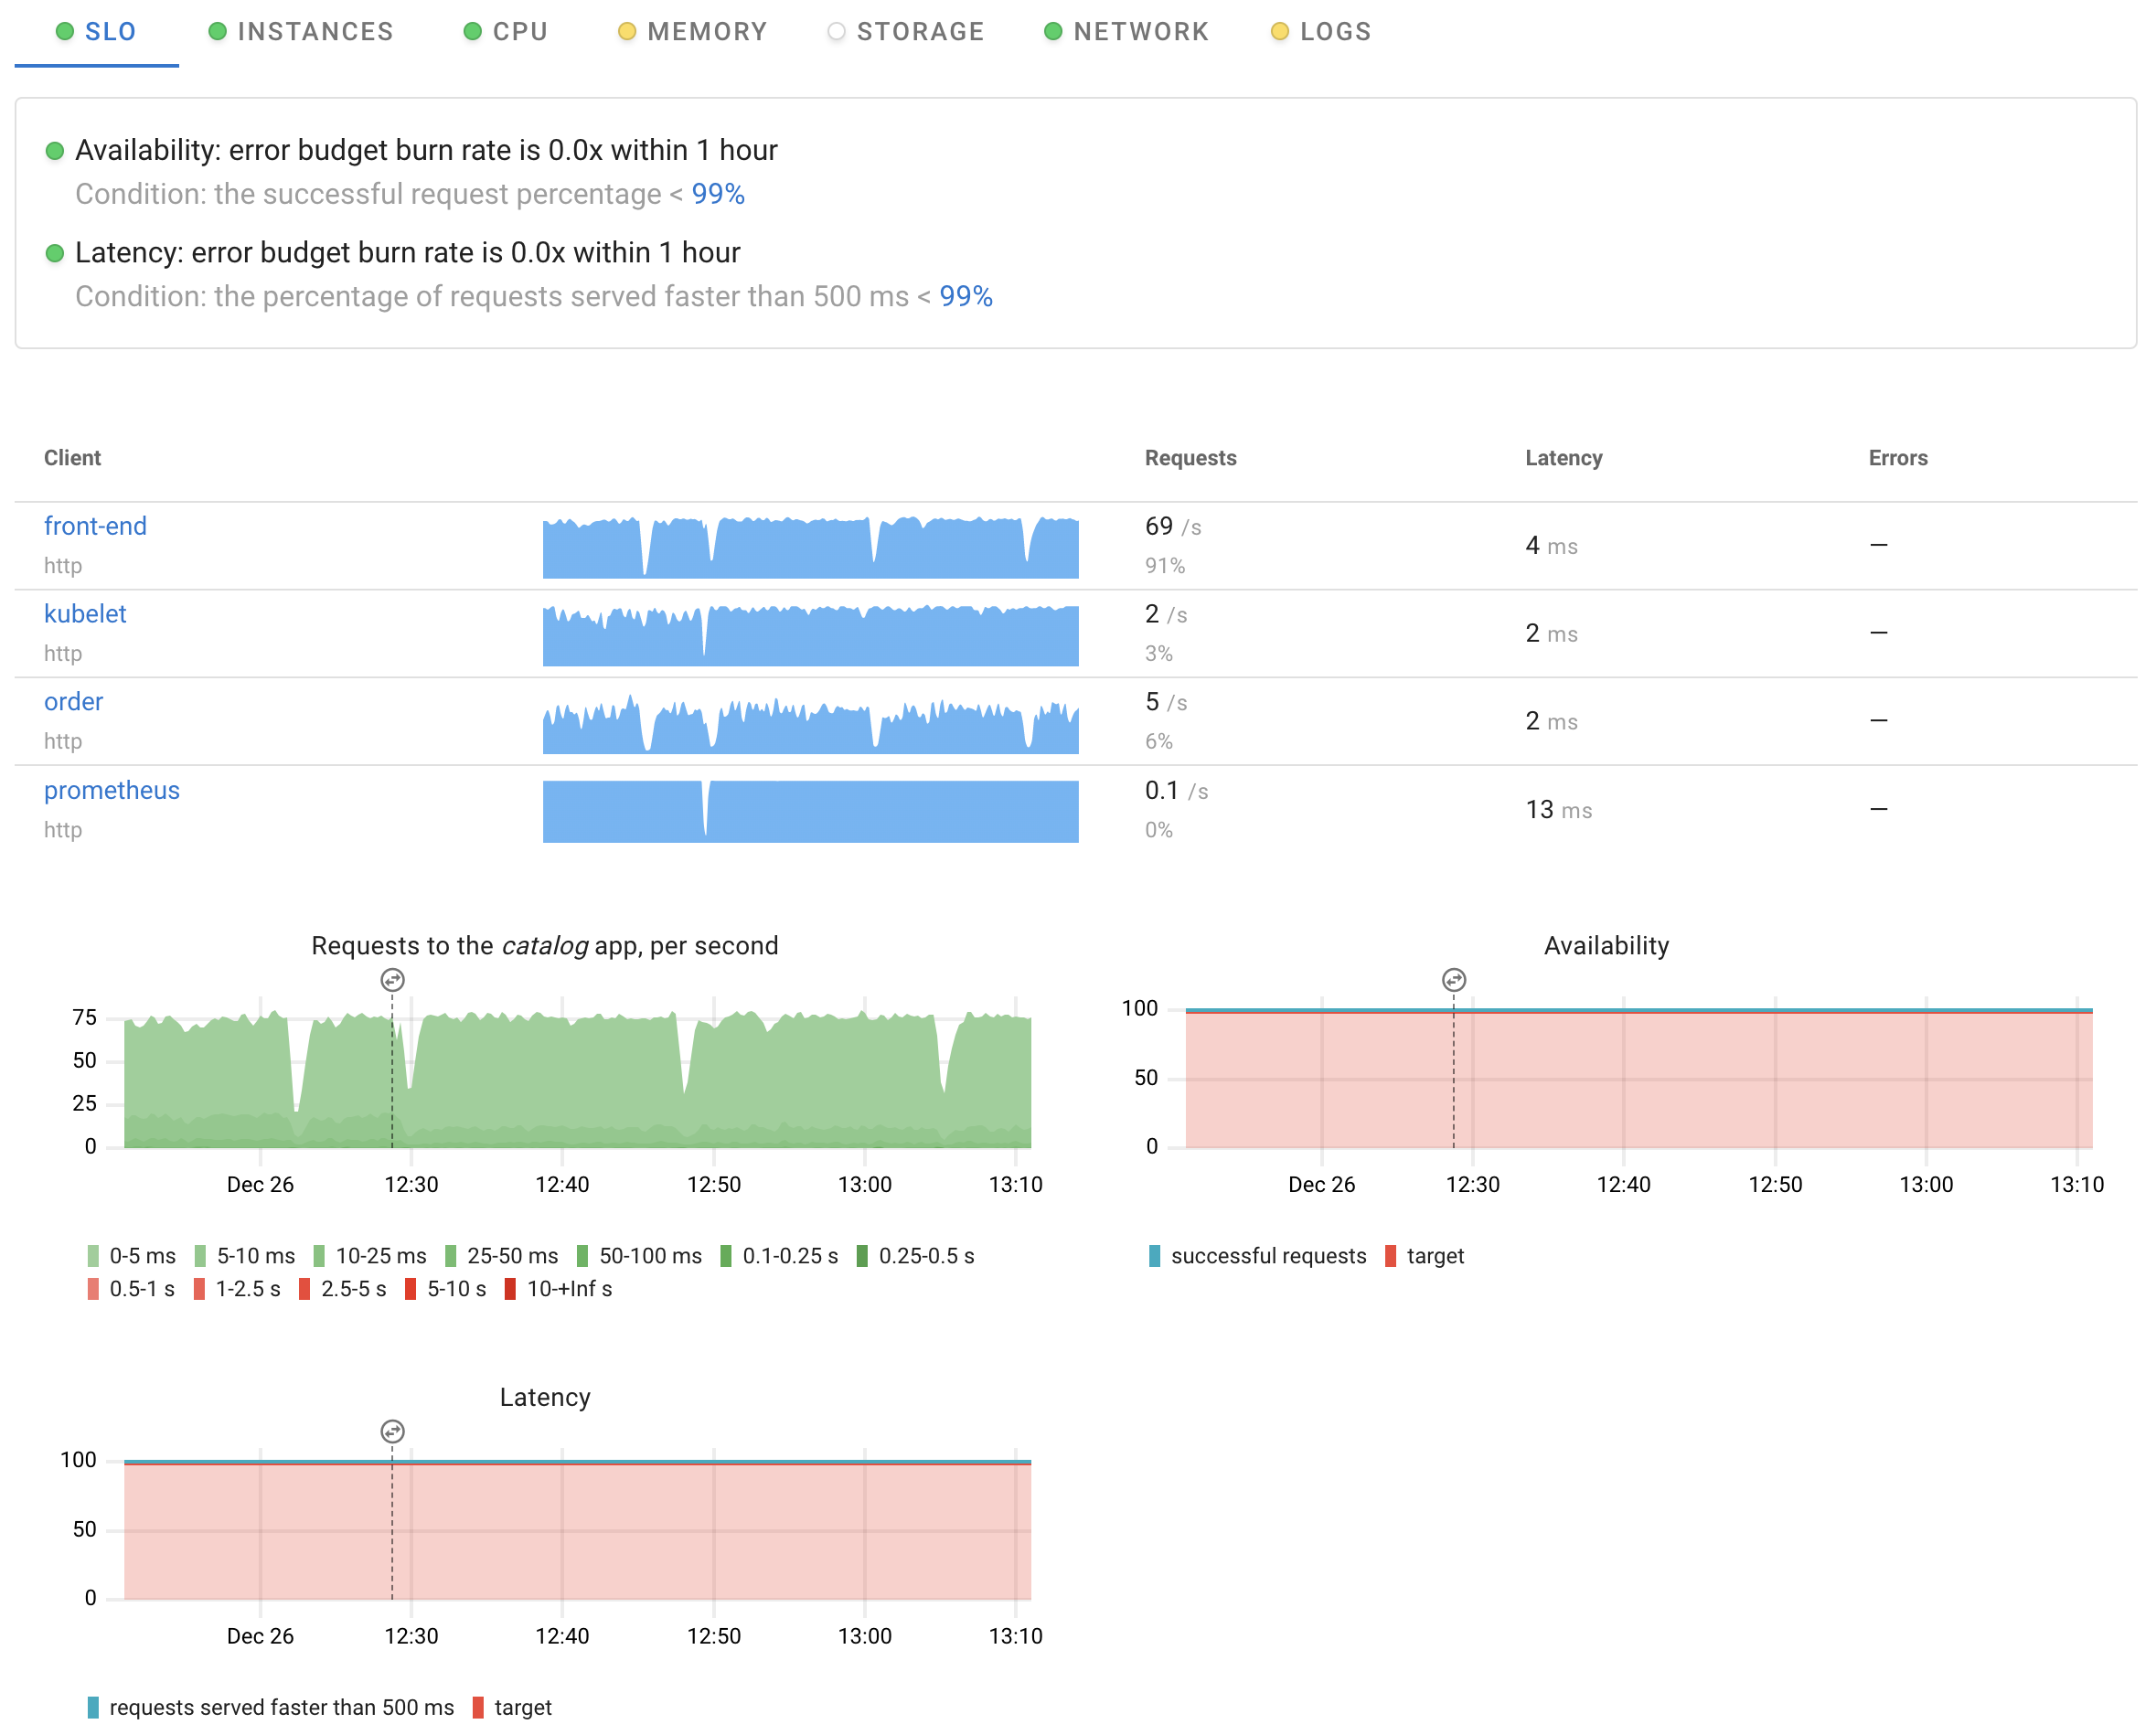
Availability
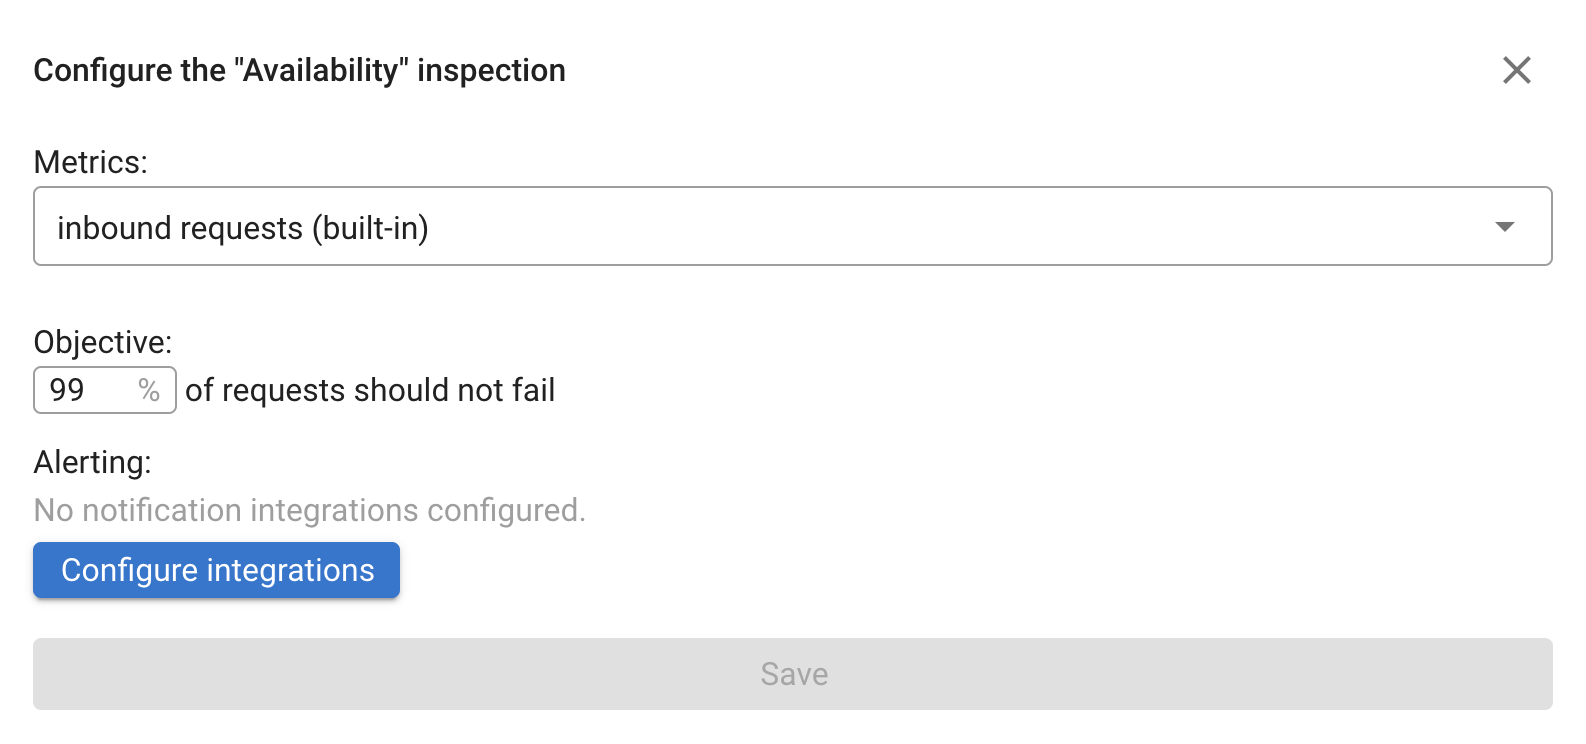
The predefined Availability SLO: 99% of requests should be server without errors.
You can easily adjust the objective:
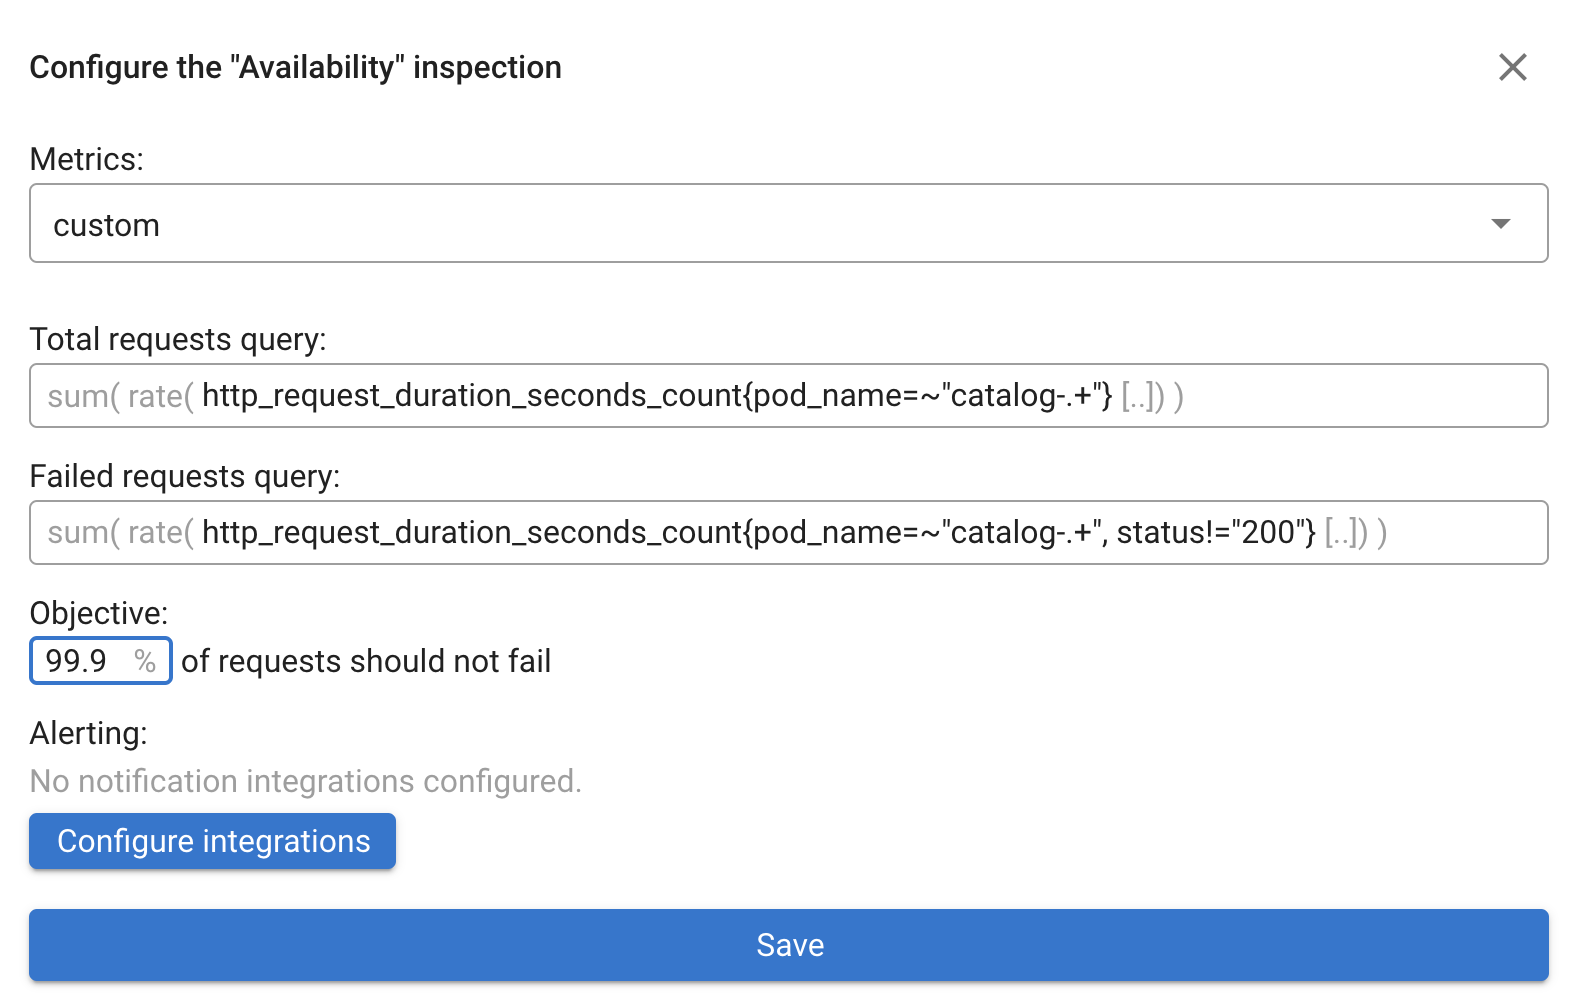
...or configure Coroot to rack your custom Prometheus metrics:
Latency
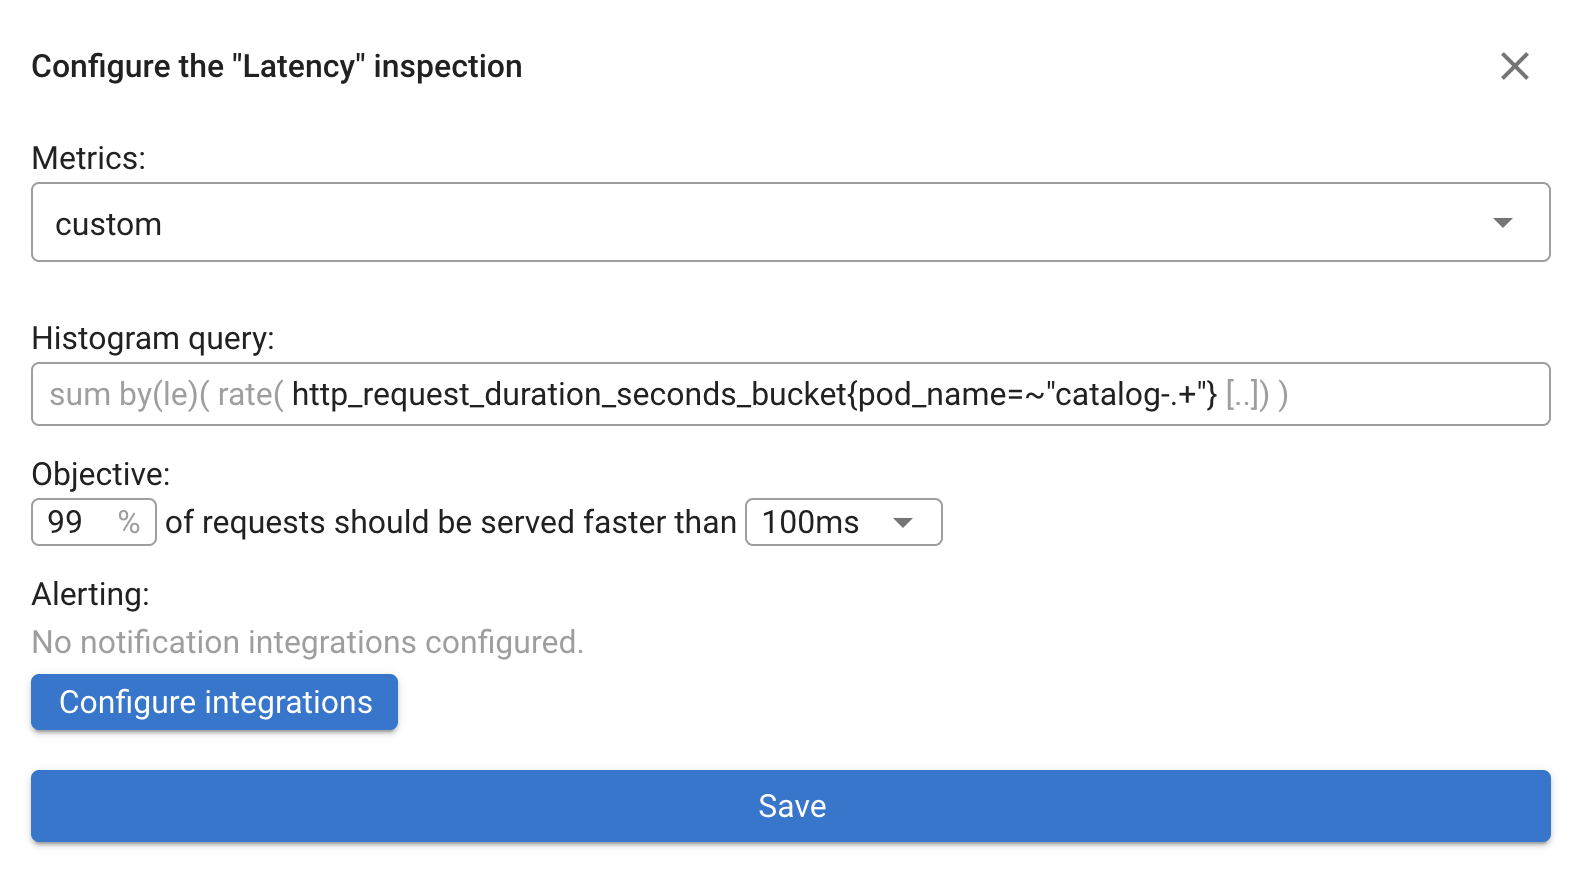
The predefined Latency SLO: 99% of requests should be served in less that 500ms.
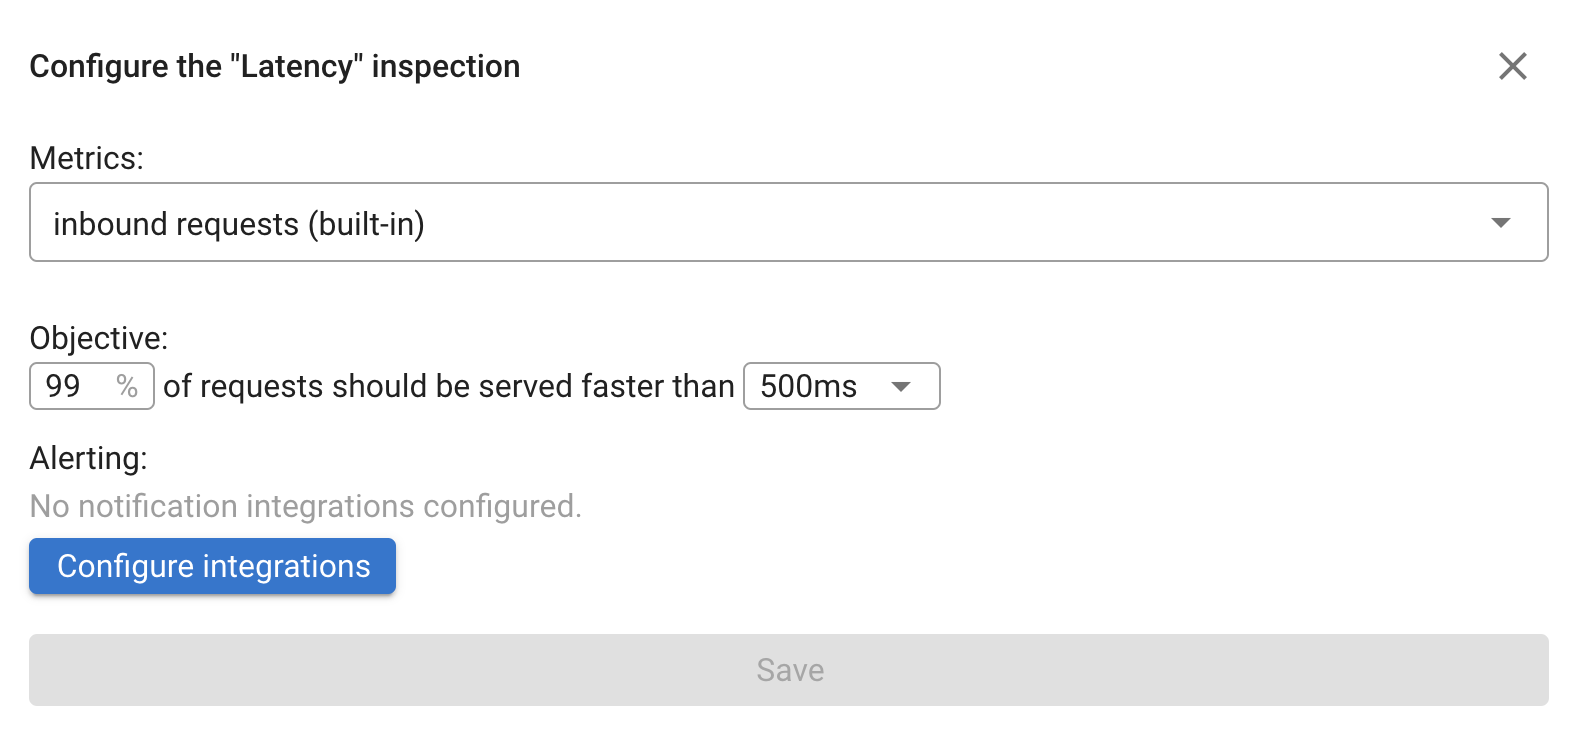
You can also define any Prometheus histogram to be used instead of the built-in metrics:
Kubernetes annotations
You can define Service Level Objectives (SLOs) using annotations on Kubernetes objects such as Deployment, StatefulSet, DaemonSet, or CronJob. Only SLO thresholds are defined via annotations — Coroot uses its eBPF-based metrics to calculate the corresponding Service Level Indicators (SLIs).
Application latency in Coroot is represented as a histogram with a fixed set of buckets: 5ms, 10ms, 25ms, 50ms, 100ms, 250ms, 500ms, 1s, 2.5s, 5s, 10s.
When evaluating SLO compliance, Coroot compares the number of requests that meet the latency objective to the total number of requests.
Therefore, the slo-latency-threshold value must match one of the predefined buckets.
apiVersion: apps/v1
kind: Deployment
metadata:
  name: some-app
  namespace: default
  annotations:
    coroot.com/slo-availability-objective: 99.9%
    coroot.com/slo-latency-objective: 99.9%
    coroot.com/slo-latency-threshold: 100ms
Once SLOs are defined through annotations, they cannot be edited in the UI.
To disable a specific SLO for an application, set its objective to 0%:
apiVersion: apps/v1
kind: Deployment
metadata:
  name: some-app
  namespace: default
  annotations:
    coroot.com/slo-availability-objective: 99%
    coroot.com/slo-latency-objective: 0% # Latency SLO is disabled
Defining custom SLI metrics via annotations is not supported yet.