Overview
When you look at any dashboard, you are mentally evaluating whether the metrics are within their acceptable range of values or not.
In order to automate this process, you can configure alerting rules to notify you when a metric exceeds a threshold. However, alerts usually have no context, so you have to manually extract issues relevant to a particular app from the alert stream.

Coroot turns the conventional metric analysis inside out. It uses a distributed system model to evaluate every inspection within an application's context. For instance, the Network round-trip time inspection checks the network latency between a particular app and the services it depends on.

From a UI/UX perspective, each dashboard at the application level has a status which is calculated by checking the corresponding metrics.

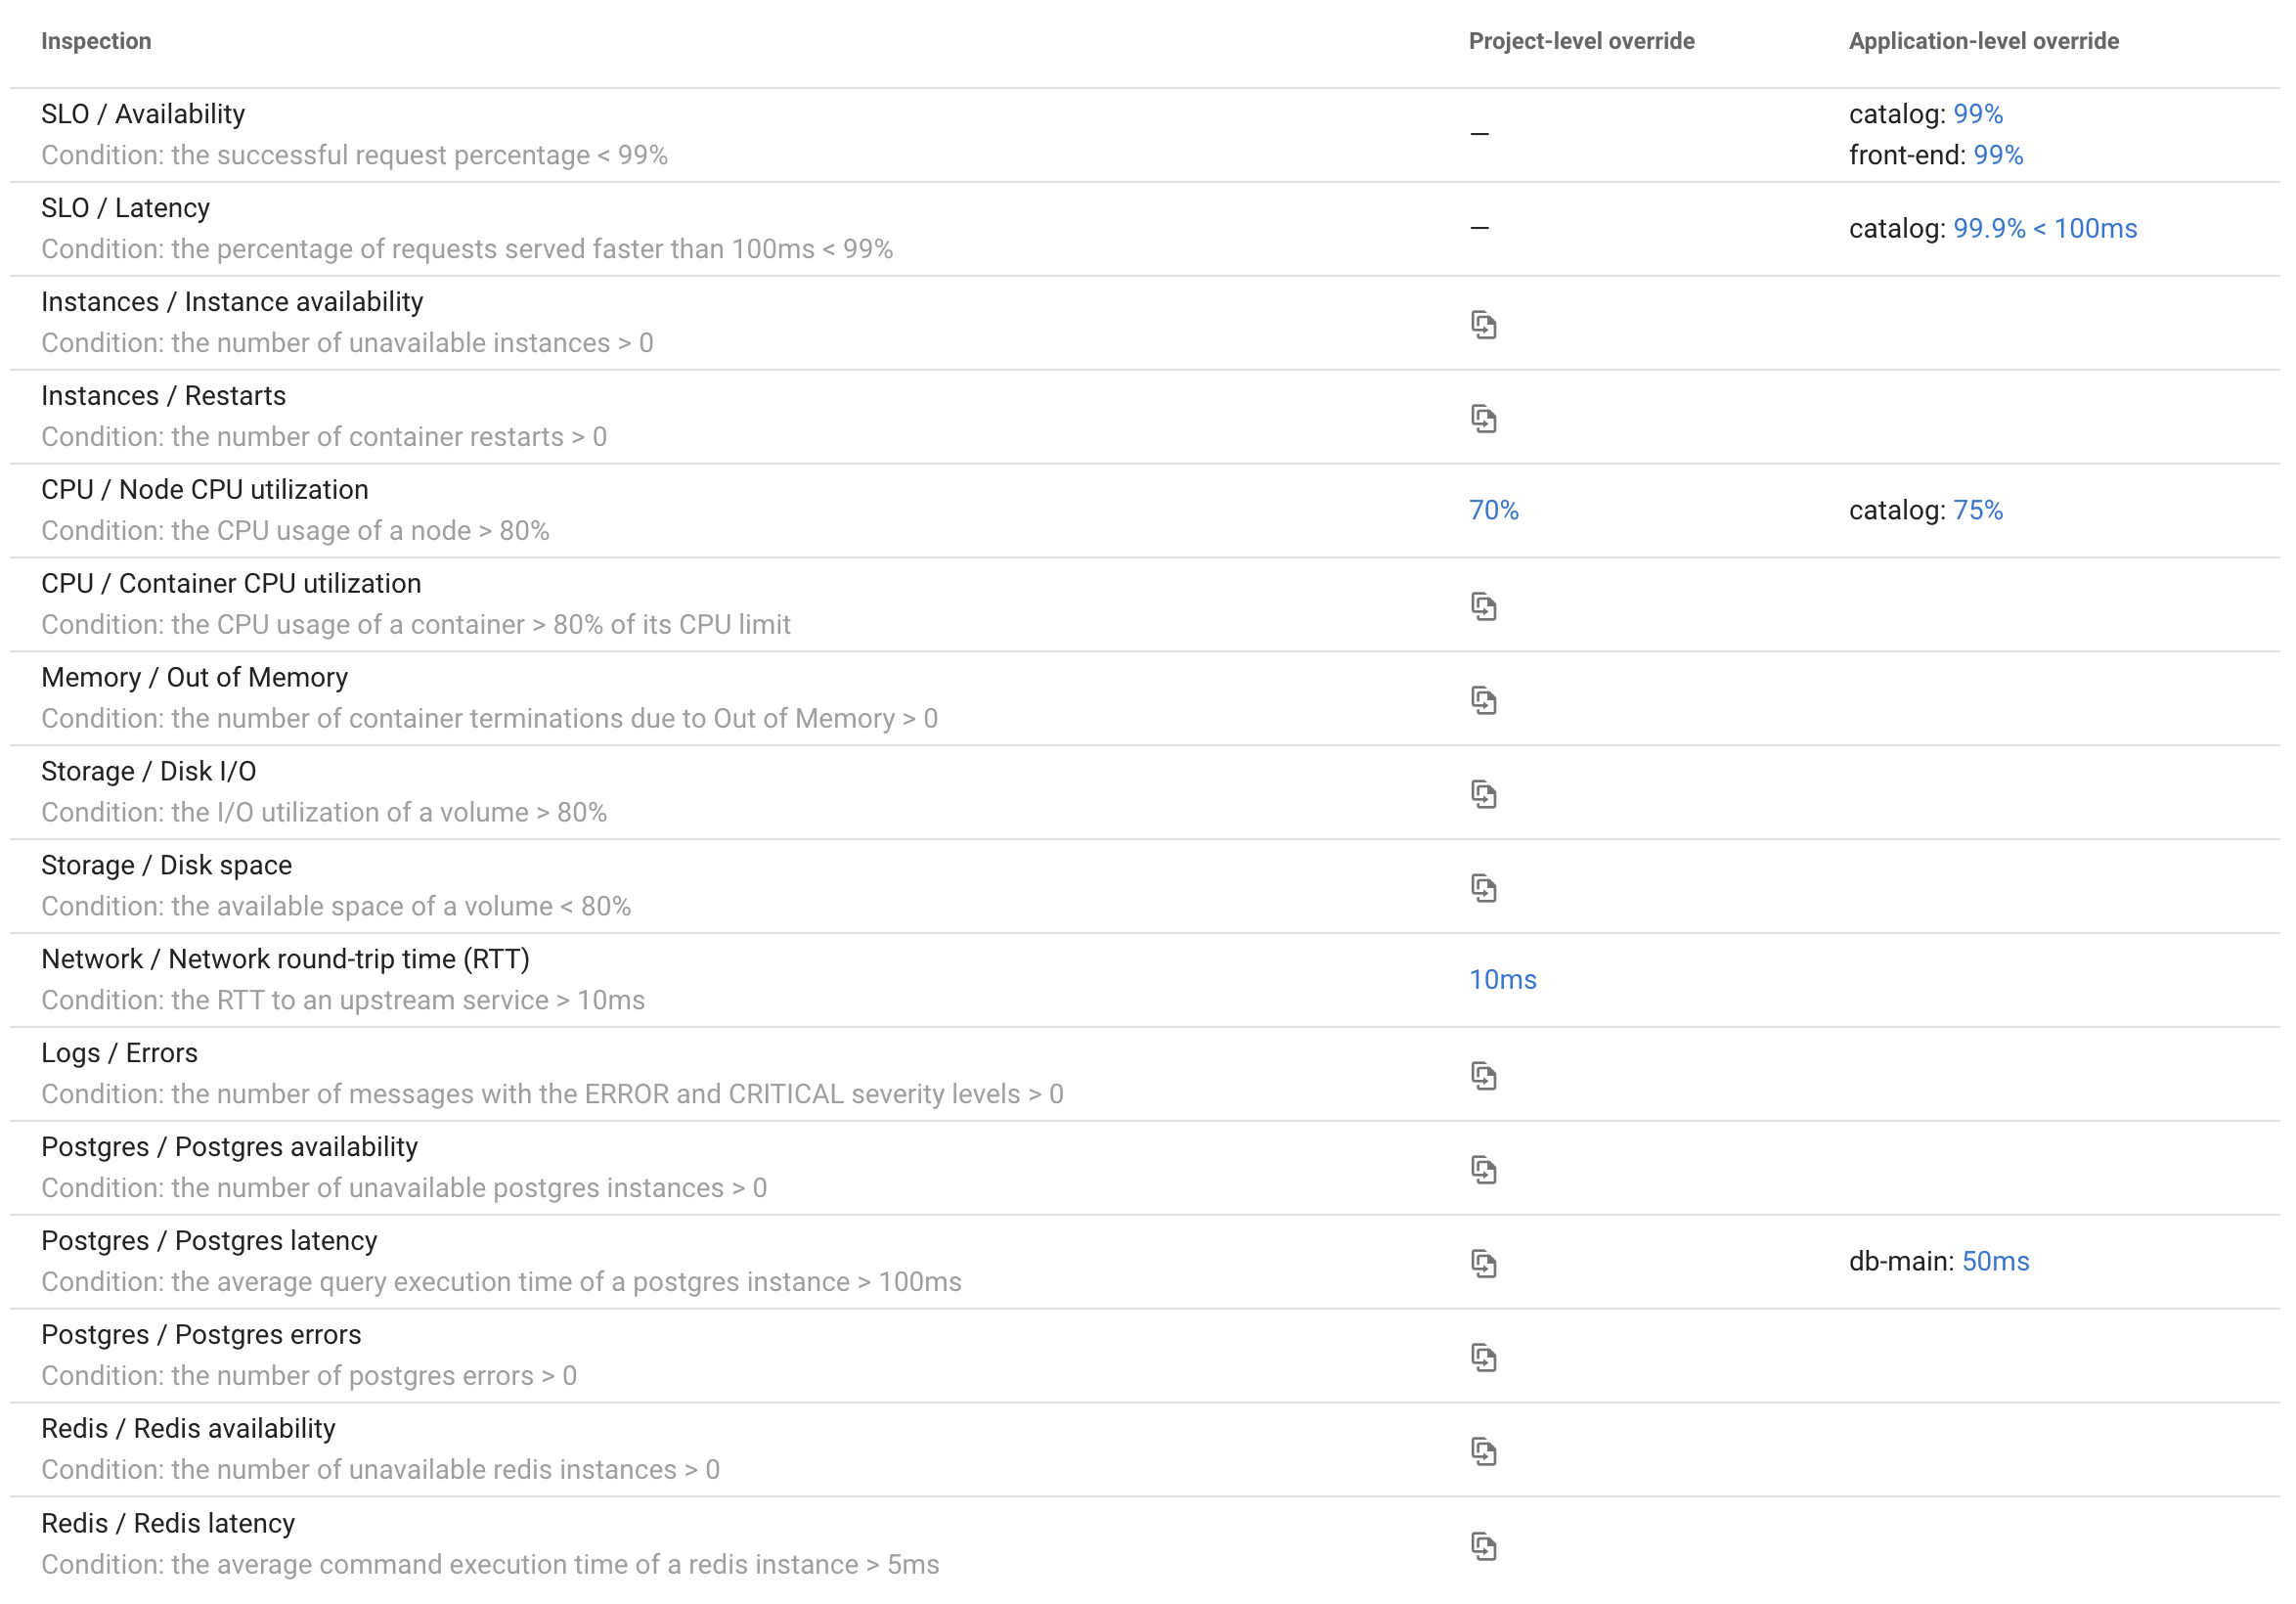
Each inspection threshold can be easily overridden for a specific application or the entire project.

Application status
To highlight the status of each application on the overview page, Coroot takes the status of the SLO inspection.
