Monitoring a database shared by several Kubernetes clusters
A database often outlives the cluster boundaries around it: one MySQL server on a dedicated host, with applications in several Kubernetes clusters connected to it. Each cluster is a separate project in Coroot, so each team sees its own services, but the database is just an external endpoint for all of them: you can see that queries are slow, but not why.
This guide shows how to monitor such a database once and make it a part of every project that depends on it:
- each cluster reports to its own project,
- the database reports to a dedicated project,
- multi-cluster projects join an application project with the database project, so the service map and the MySQL metrics cover the whole path from the application to the database.
Architecture overview
The setup used in this guide:
- Cluster 1 runs Coroot and the
app1application (storefront→orders). - Cluster 2 runs the
app2application (backoffice→billing). - Database host runs MySQL with two databases,
app1andapp2, used byordersandbilling.
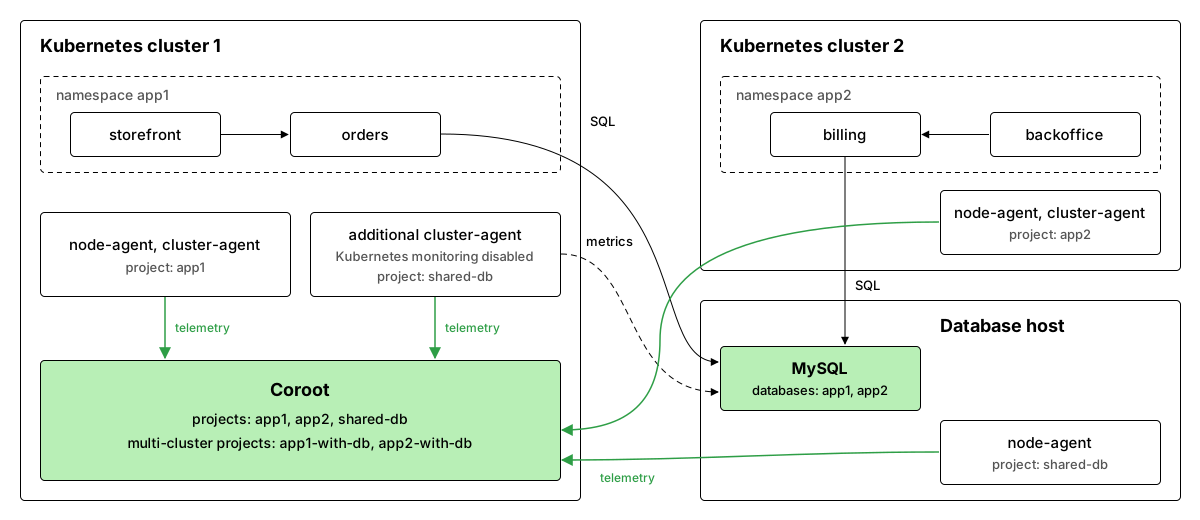
The database is monitored by two agents:
- coroot-node-agent on the database host collects host metrics, logs, and the TCP connections of the MySQL process.
- An additional coroot-cluster-agent in cluster 1 connects to MySQL and collects database metrics: queries, locks, replication, table sizes, and so on. It is installed with Kubernetes monitoring disabled, so it reports nothing about the cluster it runs in: its only job is the database.
Both of them report to the shared-db project. Cluster 1 and cluster 2 keep reporting to app1 and app2.
Then two multi-cluster projects, app1-with-db and app2-with-db, combine each
application project with shared-db:
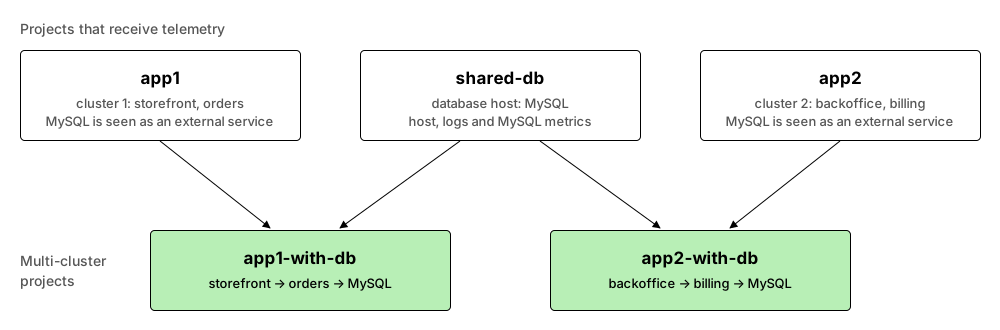
A multi-cluster project stores nothing: it's a view over its member projects. When Coroot builds it, the external
endpoint that orders connects to is replaced with the actual MySQL instance from shared-db, because that instance
listens on the same address.
Prerequisites
- Two Kubernetes clusters with
kubectlcontexts (the examples below usecluster-1andcluster-2) and Helm 3. - Coroot 1.27.1 or later, Coroot Operator 1.10.6 or later, coroot-cluster-agent 1.11.5 or later.
- Network access:
- from cluster 2 and from the database host to Coroot in cluster 1 (the examples use the node port
30001on10.10.0.2), - from cluster 1 to the database (
10.10.0.4:3306).
- from cluster 2 and from the database host to Coroot in cluster 1 (the examples use the node port
Step 1: Install Coroot in cluster 1
Install the Coroot Operator:
kubectl config use-context cluster-1

helm repo add coroot https://coroot.github.io/helm-charts
helm repo update coroot
helm install -n coroot --create-namespace coroot-operator coroot/coroot-operator
Create the Coroot custom resource with three projects, one per telemetry source:
apiVersion: coroot.com/v1
kind: Coroot
metadata:
  name: coroot
  namespace: coroot
spec:
  service:
    type: NodePort
    nodePort: 30001 # cluster 2 and the database host reach Coroot through this port
  apiKeySecret: # the agents of this cluster report to the app1 project
    name: coroot-api-keys
    key: app1
  projects:
    - name: app1
      apiKeys: # if the secret doesn't exist, the operator creates it and generates the keys
        - description: agents in cluster 1
          keySecret:
            name: coroot-api-keys
            key: app1
    - name: app2
      apiKeys:
        - description: agents in cluster 2
          keySecret:
            name: coroot-api-keys
            key: app2
    - name: shared-db
      apiKeys:
        - description: agents monitoring the shared database
          keySecret:
            name: coroot-api-keys
            key: shared-db
kubectl apply -f coroot.yaml
The operator installs Coroot, its storage, and the agents for cluster 1, and generates an API key for each project
in the coroot-api-keys secret:
kubectl get pods -n coroot
NAME                                    READY   STATUS    RESTARTS   AGE
coroot-clickhouse-keeper-0              1/1     Running   0          2m
coroot-clickhouse-keeper-1              1/1     Running   0          2m
coroot-clickhouse-keeper-2              1/1     Running   0          2m
coroot-clickhouse-shard-0-0             1/1     Running   0          2m
coroot-cluster-agent-5cd7bfdff8-zpng9   1/1     Running   0          2m
coroot-coroot-0                         1/1     Running   0          2m
coroot-node-agent-gl2vv                 1/1     Running   0          2m
coroot-operator-5bf4b74445-ljpkw        1/1     Running   0          3m
coroot-prometheus-57c7c4d449-dss7c      1/1     Running   0          2m
Step 2: Install the agents in cluster 2
Cluster 2 only needs the agents. Copy the API key of the app2 project there:
kubectl config use-context cluster-1
APP2_KEY=$(kubectl get secret -n coroot coroot-api-keys -o jsonpath='{.data.app2}' | base64 -d)

kubectl config use-context cluster-2
helm install -n coroot --create-namespace coroot-operator coroot/coroot-operator
kubectl create secret generic -n coroot coroot-api-key --from-literal=app2="$APP2_KEY"
Create the custom resource in the agentsOnly mode:
apiVersion: coroot.com/v1
kind: Coroot
metadata:
  name: coroot
  namespace: coroot
spec:
  agentsOnly:
    corootURL: http://10.10.0.2:30001 # Coroot in cluster 1
  apiKeySecret: # report to the app2 project
    name: coroot-api-key
    key: app2
kubectl apply -f agents.yaml
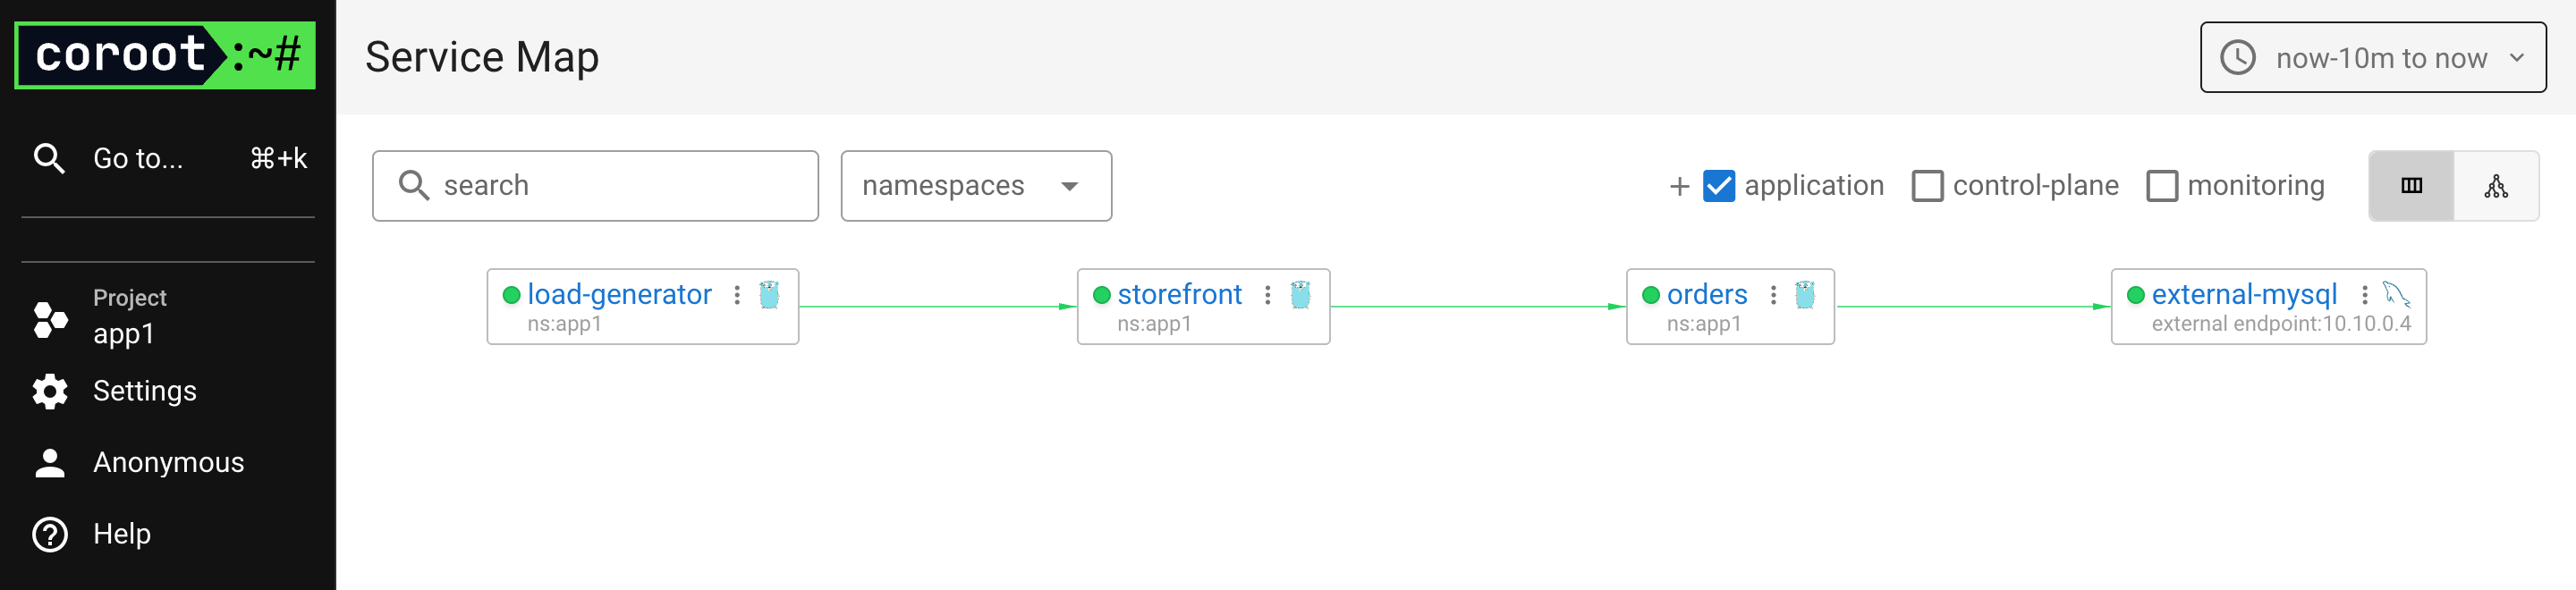
At this point each cluster has its own project. In both of them the database is an external service: Coroot knows
that orders talks to MySQL at 10.10.0.4:3306 and measures these requests on the client side, but has no data from
the database itself.
Step 3: Install the node-agent on the database host
Get the API key of the shared-db project:
kubectl config use-context cluster-1
kubectl get secret -n coroot coroot-api-keys -o jsonpath='{.data.shared-db}' | base64 -d
Install coroot-node-agent on the database host and point it to Coroot using this key:
curl -sfL https://raw.githubusercontent.com/coroot/coroot-node-agent/main/install.sh | \
  COLLECTOR_ENDPOINT=http://10.10.0.2:30001 \
  API_KEY=<the API key of the shared-db project> \
  SCRAPE_INTERVAL=15s \
  sh -
The agent discovers the MySQL process and the address it listens on. This is what lets Coroot recognize later that
the external endpoint 10.10.0.4:3306 seen from the clusters and this MySQL instance are the same thing.
Step 4: Add a cluster-agent for the database
Database metrics are collected by coroot-cluster-agent over a regular MySQL connection. Create a user for it on the database, limited to the network the agent connects from (see MySQL for what each privilege is used for):
CREATE USER 'coroot'@'10.10.0.%' IDENTIFIED BY '<PASSWORD>';
GRANT SELECT, PROCESS, REPLICATION CLIENT ON *.* TO 'coroot'@'10.10.0.%';
Store the credentials in a secret in cluster 1:
kubectl config use-context cluster-1
kubectl create secret generic -n coroot shared-db-mysql \
  --from-literal=username=coroot \
  --from-literal=password='<PASSWORD>'
The cluster-agent that is already running in cluster 1 reports to the app1 project, so the database needs
an agent of its own that reports to shared-db. Add a second Coroot custom resource to the same cluster:
apiVersion: coroot.com/v1
kind: Coroot
metadata:
  name: shared-db # must differ from the name of the main custom resource
  namespace: coroot
spec:
  agentsOnly:
    corootURL: http://coroot-coroot.coroot:8080 # Coroot runs in the same cluster
  apiKeySecret: # report to the shared-db project
    name: coroot-api-keys
    key: shared-db
  nodeAgent:
    enabled: false # the nodes of this cluster are already monitored
  clusterAgent:
    kubernetes:
      enabled: false # collect nothing from this cluster: its only job is the database
    databases:
      - type: mysql
        host: 10.10.0.4
        port: "3306"
        credentials:
          usernameSecret:
            name: shared-db-mysql
            key: username
          passwordSecret:
            name: shared-db-mysql
            key: password
kubectl apply -f shared-db.yaml
What these settings do:
agentsOnlyinstalls agents without another Coroot instance.nodeAgent.enabled: falseskips the node-agent DaemonSet: the one installed in Step 1 already covers the nodes.clusterAgent.kubernetes.enabled: falseturns off everything the cluster-agent normally collects from the cluster it runs in: Kubernetes state metrics, events, and the databases, custom metrics and profiles discovered from pods. Without it theshared-dbproject would get a second copy of cluster 1. The operator also doesn't grant this agent any access to the Kubernetes API.clusterAgent.databaseslists the databases to monitor. The credentials are read from the secret by the operator and passed to the agent as environment variables.
The operator creates a single Deployment:
kubectl get pods -n coroot -l app.kubernetes.io/part-of=shared-db
NAME                                       READY   STATUS    RESTARTS   AGE
shared-db-cluster-agent-6b657c9894-sqcp8   1/1     Running   0          1m
Its log confirms the mode it runs in and the database it monitors:
kubectl logs -n coroot deploy/shared-db-cluster-agent | grep -E 'kubernetes|new target'
k8s.go:50] kubernetes is disabled
scraper.go:143] kubernetes is disabled, disabling k8s service discovery
metrics.go:148] new target: mysql://10.10.0.4:3306 (10.10.0.4)
In a few minutes the shared-db project contains the database host and the MySQL instance with its metrics.
On its own this project is not very informative: none of the database clients report to it, so its Service Map
doesn't show who uses the database. That's what the next step is for.
Step 5: Create the multi-cluster projects
Add two more projects to coroot.yaml. They have no API keys, only the list of projects they combine:
spec:
  projects:
    # app1, app2, and shared-db stay as they are
    - name: app1-with-db
      memberProjects:
        - app1
        - shared-db
    - name: app2-with-db
      memberProjects:
        - app2
        - shared-db
kubectl apply -f coroot.yaml
The result
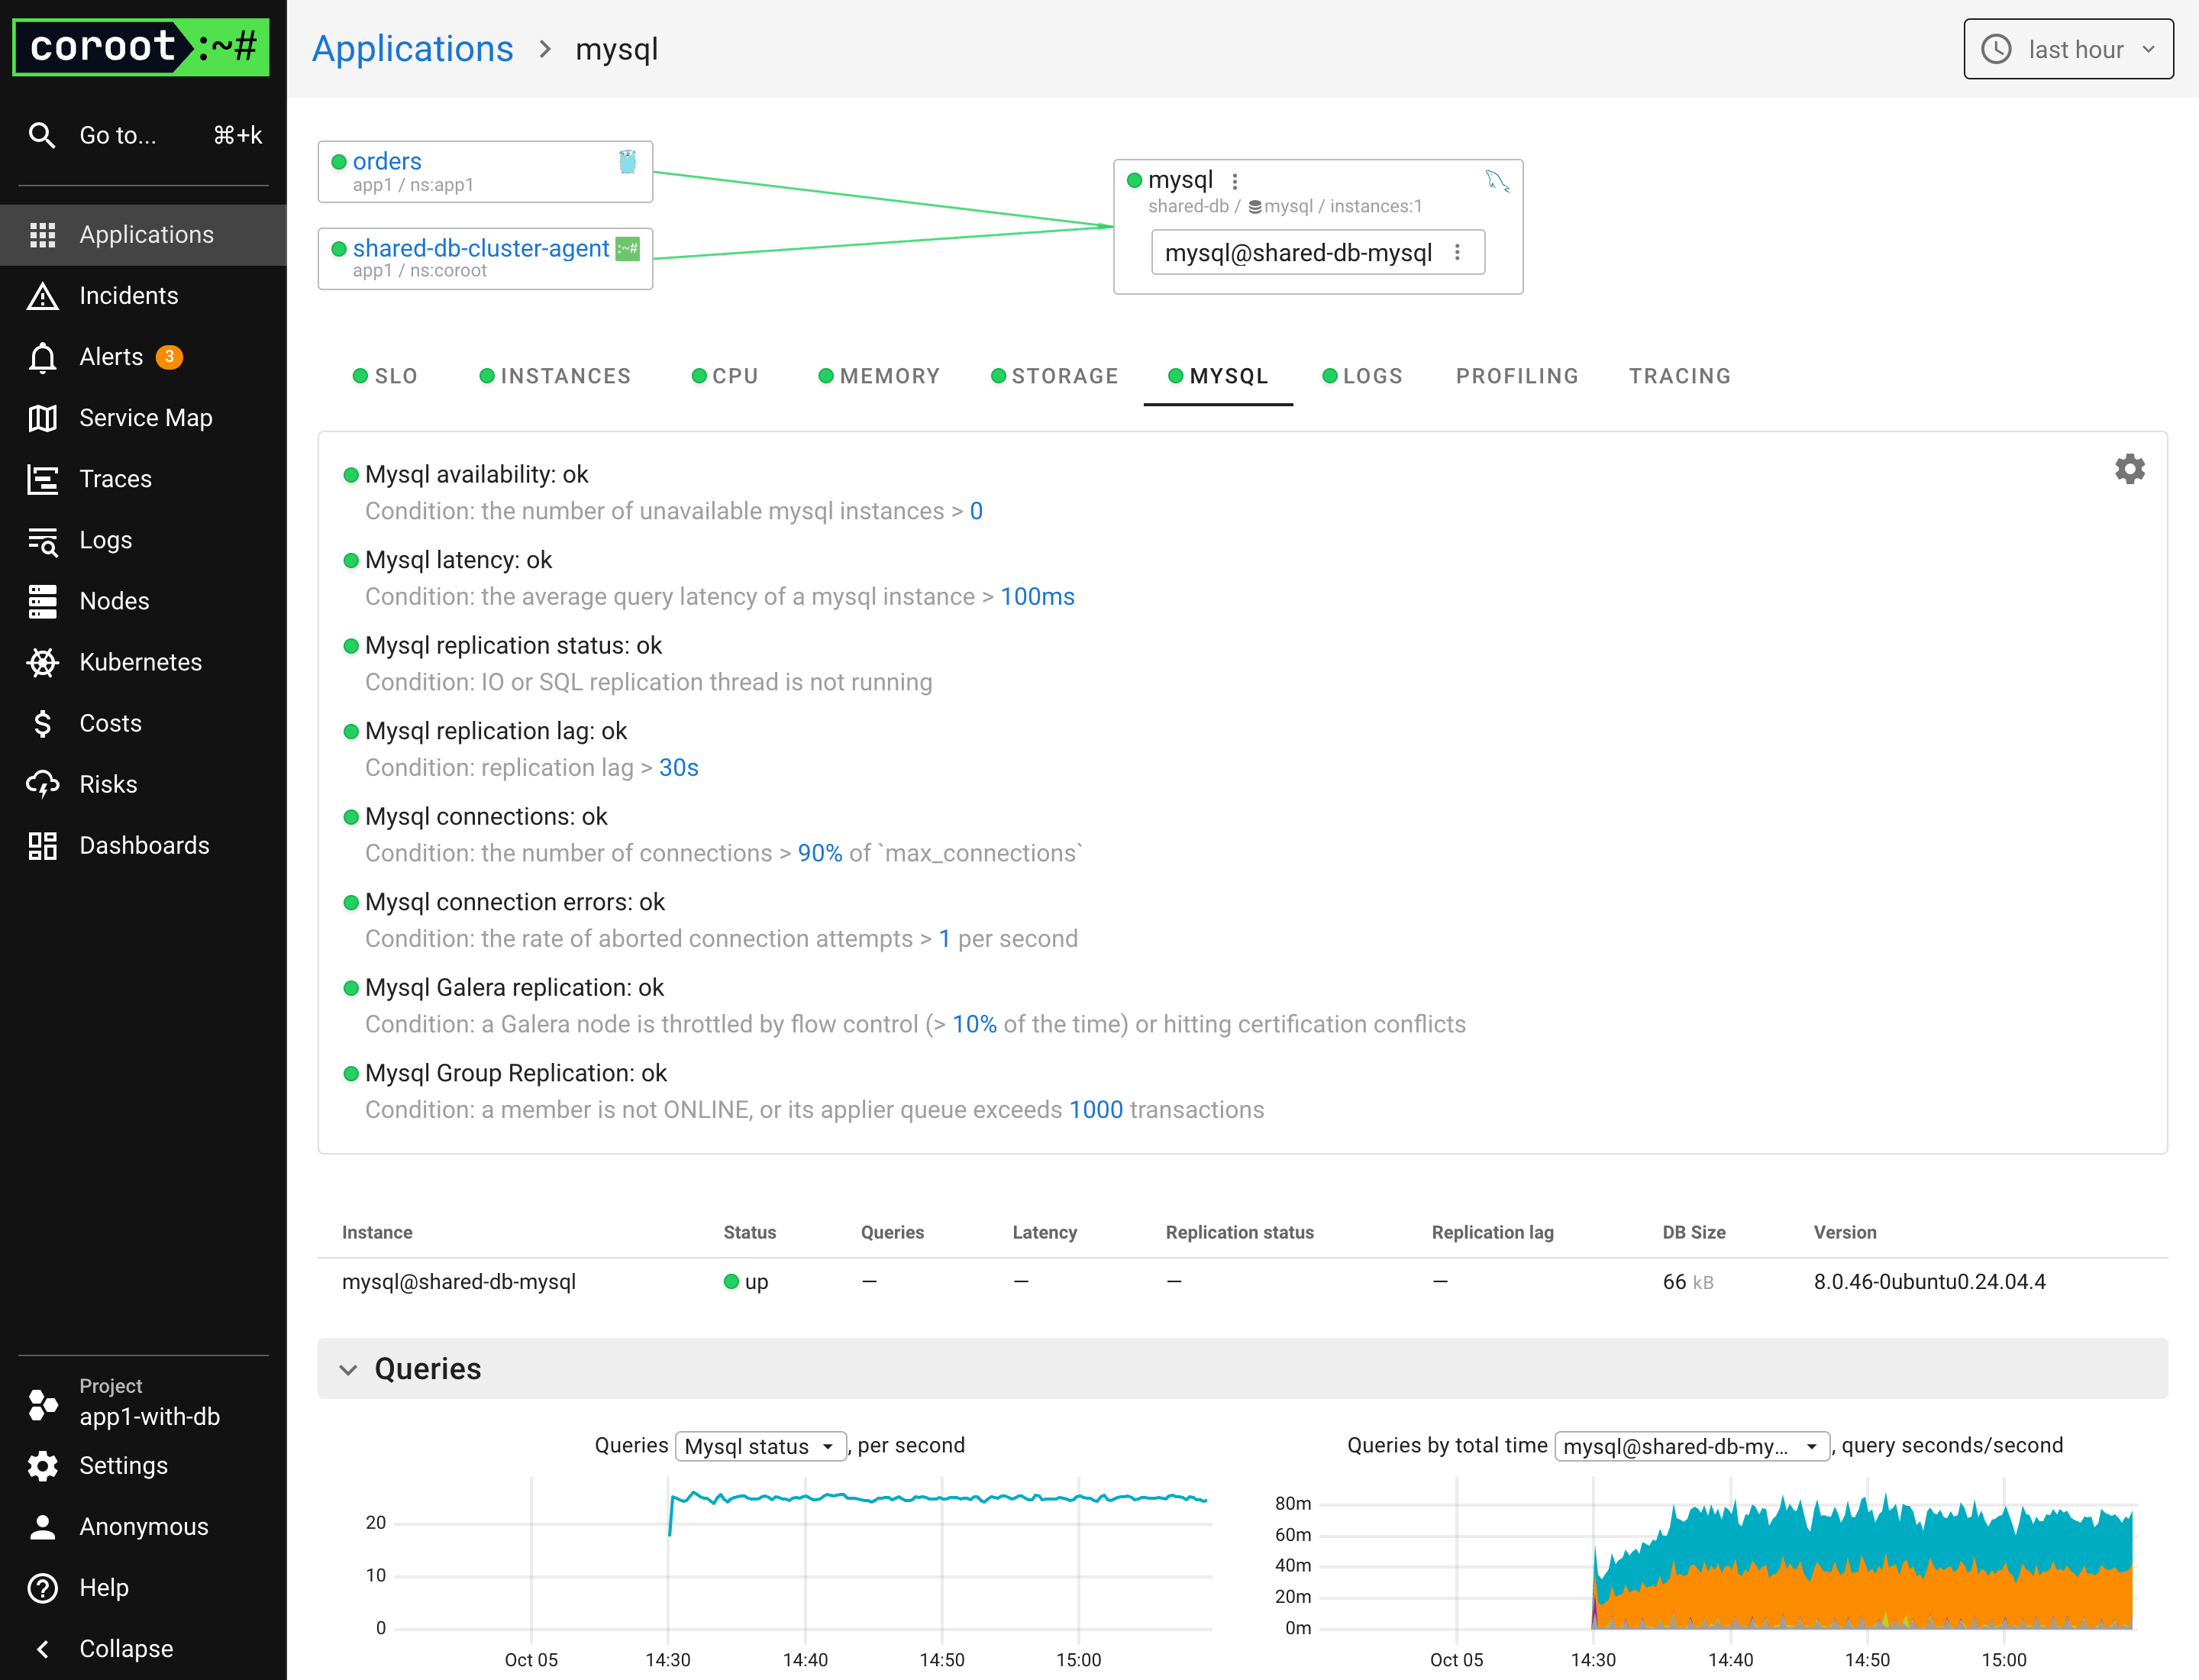
Open the app1-with-db project. On the Service Map the external endpoint is gone: orders now talks to the MySQL
instance from the shared-db project.
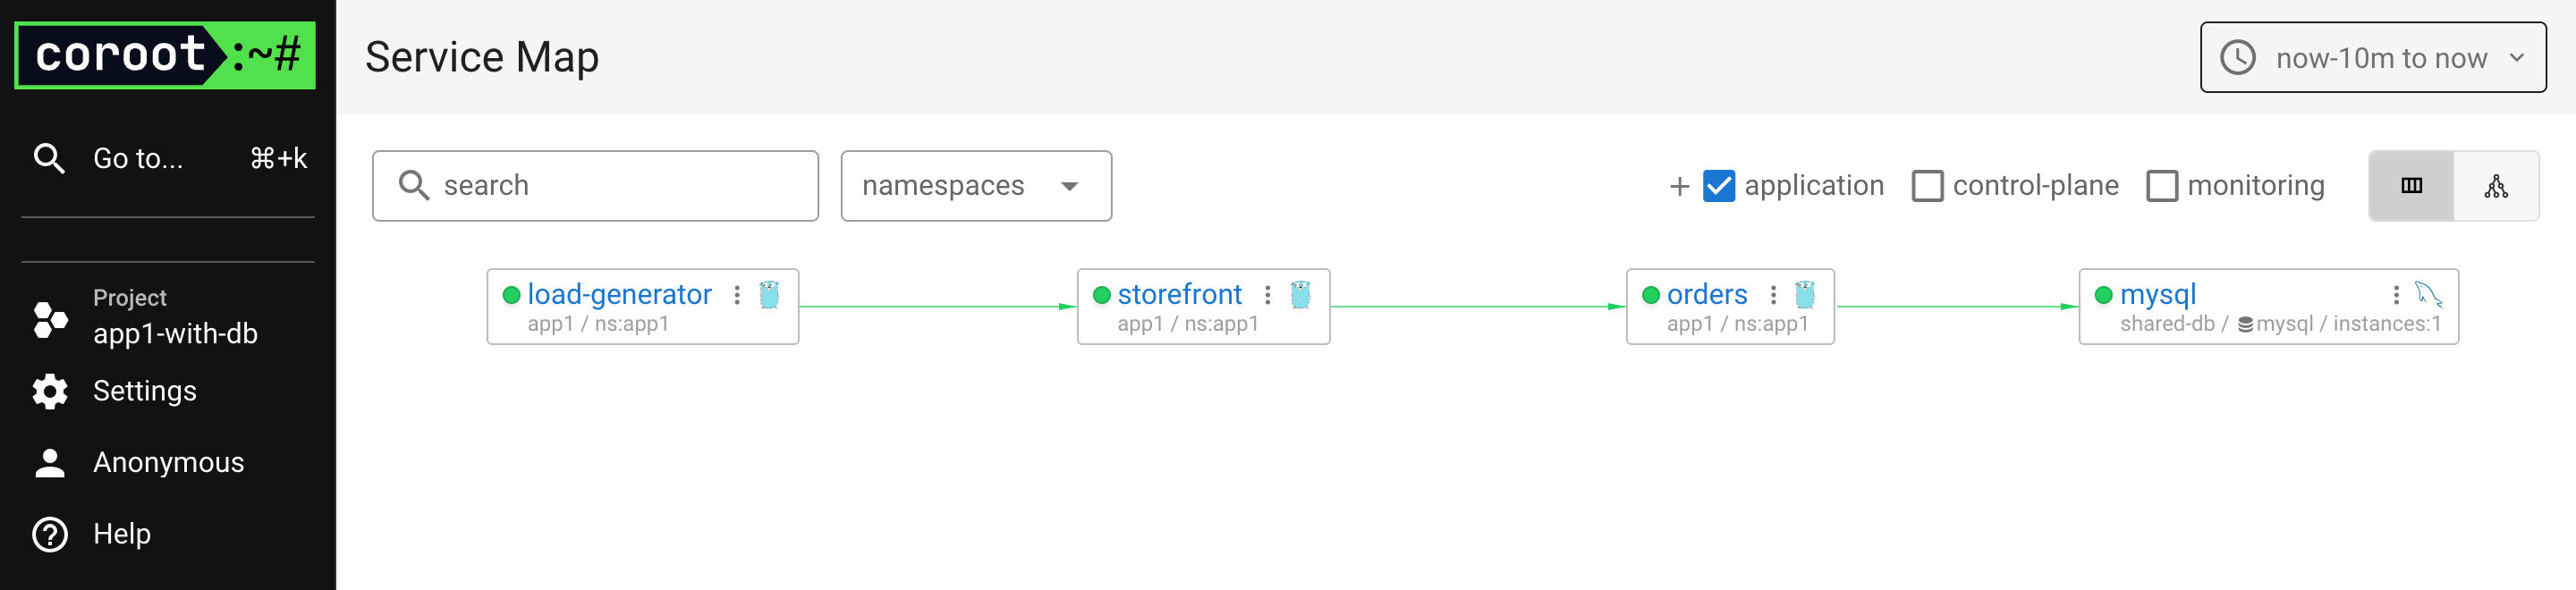
The database is a regular application here, with its clients, instances, host metrics, logs, and the MySQL dashboard built from the metrics of the additional cluster-agent. The agent itself is listed among the clients, since it runs in cluster 1 and connects to the database to collect these metrics:
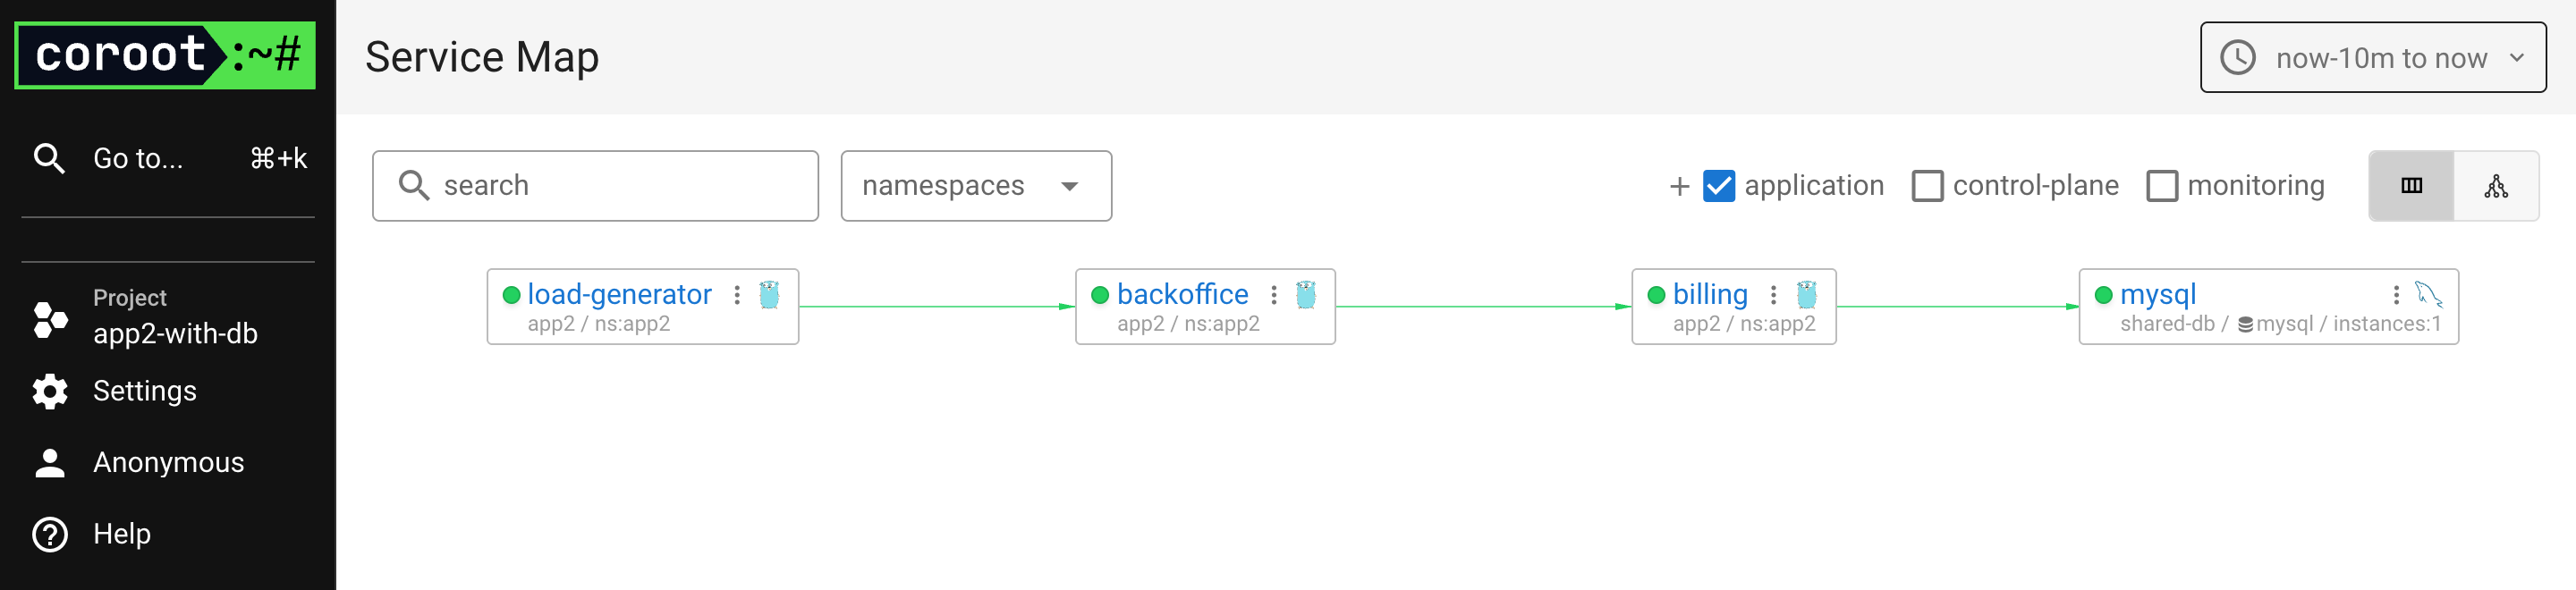
The app2-with-db project shows the same database from the other side: the services of cluster 2 and their
queries. Neither project contains anything from the other cluster.
Notes
- The database is monitored once. Adding another cluster that uses it takes a project for the cluster and
a multi-cluster project with
shared-dbas a member, with no changes on the database side. - The additional custom resource must be in the same namespace as the secrets it references and must have its own name: the names of the resources created by the operator are derived from it.
- To monitor several shared databases, add them to
clusterAgent.databasesof the same custom resource and install the node-agent on each database host.