MySQL
Coroot leverages eBPF to monitor MySQL queries between applications and databases, requiring no additional integration. While this approach provides a high-level view of database performance, it lacks the visibility needed to understand why issues occur within the database internals.
To bridge this gap, Coroot also collects statistics from the MySQL Performance Schema, complementing the eBPF-based metrics and traces.
Prerequisites
This integration requires a database user with the following permissions:
CREATE USER 'coroot'@'%' IDENTIFIED BY '<PASSWORD>';
GRANT SELECT, PROCESS, REPLICATION CLIENT ON *.* TO 'coroot'@'%';
Minimal permissions
If you don't need schema and size tracking for user databases, you can use narrower grants:
CREATE USER 'coroot'@'%' IDENTIFIED BY '<PASSWORD>';
GRANT PROCESS, REPLICATION CLIENT ON *.* TO 'coroot'@'%';
GRANT SELECT ON performance_schema.* TO 'coroot'@'%';
Query performance, table I/O waits, replication, cluster replication, InnoDB internals, binary log and undo sizes, and settings change detection will all work fully - performance_schema data is not filtered by database-level privileges, and the InnoDB views are gated by PROCESS rather than by database-level grants.
Schema and size tracking will not error but will only cover system databases, since MySQL filters information_schema views based on the user's privileges.
Required privileges explained
SELECT ON *.*
Coroot reads from:
performance_schematables (events_statements_summary_by_digest,table_io_waits_summary_by_table,data_lock_waits,threads,events_statements_current,variables_info) for query statistics, table I/O waits, lock contention, and settings change detection.information_schematables (tables,columns,statistics,key_column_usage) for schema and size tracking.
The grant must be ON *.* because MySQL filters information_schema views to only show objects the user has privileges on. A narrower grant would cause schema and size queries to return empty results for user databases. See Minimal permissions if you don't need schema or size tracking.
PROCESS
Allows SHOW GLOBAL STATUS to return the full set of server status counters (without it, some counters are hidden), and grants access to the InnoDB views in information_schema:
innodb_trxfor long-running transactions and lock holders.INNODB_METRICSfor deadlocks, lock-wait timeouts, and the undo history list length.INNODB_TABLESPACES(INNODB_SYS_TABLESPACESon MariaDB) for undo tablespace sizes.
Without PROCESS, these views return only the current session's rows or nothing at all, so the corresponding charts stay empty.
REPLICATION CLIENT
Allows SHOW REPLICA STATUS (or SHOW SLAVE STATUS on older versions) to monitor replication health and lag, and SHOW BINARY LOGS to track binary log size on disk.
This privilege is useful on every instance that has binary logging enabled, not only on replicas: binary logs accumulate on the primary too, and they are a common cause of a full data volume.
All access is read-only. Coroot never modifies any data, schema, or configuration on your MySQL server.
What data is collected
Server status and configuration
Always collected. Coroot runs SHOW GLOBAL VARIABLES and SHOW GLOBAL STATUS on each scrape to collect:
version,server_id,server_uuid- identify the instance and display server info.max_connections- the configured connection limit.Threads_connected,Connections,Aborted_connects- current, total, and failed connection counts.Bytes_received,Bytes_sent- network traffic to and from the server.Questions,Slow_queries- query throughput and slow query rate.
Settings change detection
Enabled by default. Controlled by --track-database-changes / TRACK_DATABASE_CHANGES (default: true).
Coroot compares successive SHOW GLOBAL VARIABLES snapshots to detect configuration changes (e.g., someone adjusts innodb_buffer_pool_size) and surfaces them in the change timeline. To determine which variables are writable it reads performance_schema.variables_info (MySQL) or information_schema.SYSTEM_VARIABLES (MariaDB).
Query performance
Always collected. Coroot reads performance_schema.events_statements_summary_by_digest to get per-query statistics:
SCHEMA_NAME- associate queries with a database.DIGEST,DIGEST_TEXT- normalized query text. MySQL's Performance Schema already replaces literal values with placeholders (e.g.,SELECT * FROM users WHERE id = ?), but Coroot performs additional obfuscation to ensure that sensitive query arguments never appear in the collected telemetry data.COUNT_STAR- query execution rate (calls/sec).SUM_TIMER_WAIT- total execution time rate (seconds/sec).SUM_LOCK_TIME- lock wait time rate (seconds/sec).
The top 20 queries by execution time are reported each scrape interval.
Lock waits
Always collected (MySQL only; skipped on MariaDB). On each scrape Coroot samples performance_schema.data_lock_waits, joining performance_schema.threads and performance_schema.events_statements_current on both the requesting (waiting) and blocking threads:
- victim query - the currently running statement of the thread waiting for a lock.
- blocking query - the currently running statement of the thread holding the lock.
This produces live gauges of how many queries are currently blocked (mysql_locked_queries) and which query is holding the locks they wait on (mysql_lock_awaiting_queries). Because it's a point-in-time sample of active contention rather than a cumulative counter, it reflects lock problems as they happen - useful for correlating client-side latency spikes with the exact query holding a lock. Waiters blocked by multiple holders are counted once (deduplicated by requesting transaction id), and query text is obfuscated like all other query metrics.
Table I/O waits
Always collected. Coroot reads performance_schema.table_io_waits_summary_by_table:
OBJECT_SCHEMA,OBJECT_NAME- the database and table.SUM_TIMER_READ,SUM_TIMER_WRITE- cumulative read and write I/O wait time.
The top 20 tables by total I/O wait time are reported, broken down by read and write operations.
Replication status
Always collected (requires the REPLICATION CLIENT privilege; safe to skip the privilege if the instance is not a replica).
Coroot runs SHOW REPLICA STATUS (falling back to SHOW SLAVE STATUS on MySQL < 8.0.22):
- IO/SQL thread running state and last error - whether the replica is receiving and applying events.
Seconds_Behind_Source- replication lag.- Source server ID and UUID - identify the replication source.
Cluster replication (Galera and Group Replication)
Always collected, when the instance is part of a cluster. Coroot detects the flavour automatically and collects only what applies.
For Galera (Percona XtraDB Cluster, MariaDB Galera) the wsrep_* counters already present in SHOW GLOBAL STATUS:
- Cluster size and status - how many nodes are in the component, and whether it has quorum (
Primary). - Local state (
Synced,Joining,Donor/Desynced, ...), readiness, and connectivity. - Flow control - how much of the time writes were paused because a node could not keep up.
- Receive and send queues - write-sets waiting to be applied or sent.
- Certification conflicts - transactions rolled back because the same rows were written on more than one node (
cert_failures,bf_aborts).
For Group Replication, from performance_schema.replication_group_members and replication_group_member_stats:
- Member state (
ONLINE,RECOVERING,ERROR,OFFLINE,UNREACHABLE) and the number of members online. - Certification and applier queues - transactions waiting to be certified or applied.
- Conflicts detected.
InnoDB internals
Always collected. Most of these come from the SHOW GLOBAL STATUS counters Coroot already reads, so they add no extra queries:
- Buffer pool - total, free, dirty and data pages (converted to bytes via
innodb_page_size), read requests vs disk reads (hit rate), waits for a free page, and pages flushed. - Row operations - rows read, inserted, updated, deleted.
- Row locking - lock waits, total lock wait time, and locks currently waited on.
- Disk I/O - reads, writes, bytes read/written, and fsyncs.
- Redo log - bytes written and log waits.
- Transactions - commits and rollbacks; plus sort merge passes and on-disk temporary tables.
A small additional query on information_schema.INNODB_METRICS (requires PROCESS) collects counters that SHOW GLOBAL STATUS does not expose:
- Deadlocks and lock-wait timeouts - transactions InnoDB rolled back; the application sees
ER_LOCK_DEADLOCK/ER_LOCK_WAIT_TIMEOUTand must retry. - History list length - undo records not yet purged. It grows while a long-running transaction holds them back, which bloats undo and slows reads.
Table-level lock waits (Table_locks_waited, Table_locks_immediate) are collected as well, covering LOCK TABLES, MyISAM tables, and DDL metadata locks.
Binary logs and undo tablespaces
Always collected. These artifacts grow independently of table data and are a common cause of a full data volume, so Coroot tracks them alongside table sizes:
- Binary logs - total size and file count from
SHOW BINARY LOGS(requiresREPLICATION CLIENT), plus the configured retention (binlog_expire_logs_seconds, orexpire_logs_dayson older MySQL and MariaDB). Coroot reports binary logs as a disk growth source, and calls out the case where retention is disabled and they are never purged automatically. - InnoDB undo tablespaces - total size from
information_schema.INNODB_TABLESPACES(INNODB_SYS_TABLESPACESon MariaDB; requiresPROCESS). When undo is growing and the history list is long, Coroot attributes the growth to lagging purge.
If binary logging is disabled, the binary log query is skipped and no error is reported.
Schema tracking
Enabled by default. Controlled by --track-database-changes / TRACK_DATABASE_CHANGES (default: true).
Coroot queries information_schema to reconstruct table DDL and detect schema changes over time:
information_schema.columns- column name, type, nullability, default, extra attributes.information_schema.statistics- index name, uniqueness, column list.information_schema.key_column_usage- foreign key name, columns, referenced table and columns.
Table and database sizes
Enabled by default. Controlled by --track-database-sizes / TRACK_DATABASE_SIZES (default: true).
Coroot reads information_schema.tables (data_length + index_length) to track per-table and per-database sizes and detect growth trends.
Common options for schema and size tracking
Both schema tracking and size tracking respect these additional flags:
--max-tables-per-database/MAX_TABLES_PER_DATABASE(default:1000) - skip databases with more tables than this limit, protecting against expensive queries on very large schemas.--exclude-databases/EXCLUDE_DATABASES(default:mysql,information_schema,performance_schema,sys) - databases to exclude from schema and size tracking.
Performance impact
All statistics are collected with regular SQL queries over a single persistent connection, so the agent can never occupy more than one MySQL thread.
We benchmarked the integration on a MySQL 8.4 server with 100 databases, 10,000 tables and 500 client connections executing 10,000 queries per second. With the default agent settings (15-second scrape interval, schema and size tracking enabled):
- the latency of application queries did not change (0.72ms on average with the instrumentation both disabled and enabled);
mysqldconsumed about 0.07 additional CPU cores (+2%), with no additional memory usage or disk I/O;- coroot-cluster-agent consumed about 0.01 CPU cores and less than 120MB of memory.
See Performance Impact for the lab setup and detailed results.
Kubernetes (pod annotations)
The Kubernetes approach to monitoring databases typically involves running metric exporters as sidecar containers within database instance Pods. However, this method can be challenging for certain use cases. Coroot has a dedicated coroot-cluster-agent that can discover and gather metrics from databases without requiring a separate container for each database instance.
Coroot-cluster-agent automatically discovers and collects metrics from pods annotated with coroot.com/mysql-scrape annotations.
Coroot can retrieve database credentials from a Secret or be configured with plain-text credentials.
coroot.com/mysql-scrape: "true"
coroot.com/mysql-scrape-port: "3306"

# plain-text credentials
coroot.com/mysql-scrape-credentials-username: "coroot"
coroot.com/mysql-scrape-credentials-password: "<PASSWORD>"

# credentials from a secret
coroot.com/mysql-scrape-credentials-secret-name: "mysql-secret"
coroot.com/mysql-scrape-credentials-secret-username-key: "username"
coroot.com/mysql-scrape-credentials-secret-password-key: "password"

# client TLS options: true, false, skip-verify, preferred (default: false)
coroot.com/mysql-scrape-param-tls: "false"

# TLS certificates from a secret: the server certificate is verified against the CA;
# the client certificate is presented to servers that require mutual TLS.
# Only the explicitly specified keys are read - set the ca key, the cert/key
# pair, or all three
coroot.com/mysql-scrape-tls-secret-name: "mysql-ca"
coroot.com/mysql-scrape-tls-secret-ca-key: "ca.crt"
coroot.com/mysql-scrape-tls-secret-cert-key: "tls.crt"
coroot.com/mysql-scrape-tls-secret-key-key: "tls.key"
Note that Coroot checks only Pod annotations, not higher-level Kubernetes objects like Deployments or StatefulSets.
Non-Kubernetes environments
In non-Kubernetes environments, the MySQL integration can be enabled via the Coroot UI. In this setup, coroot-cluster-agent retrieves MySQL instance credentials from the Coroot configuration storage.
To configure the integration, go to the MYSQL tab and click the Configure button.

Then, switch to Manual Configuration, complete the form, and click Save.
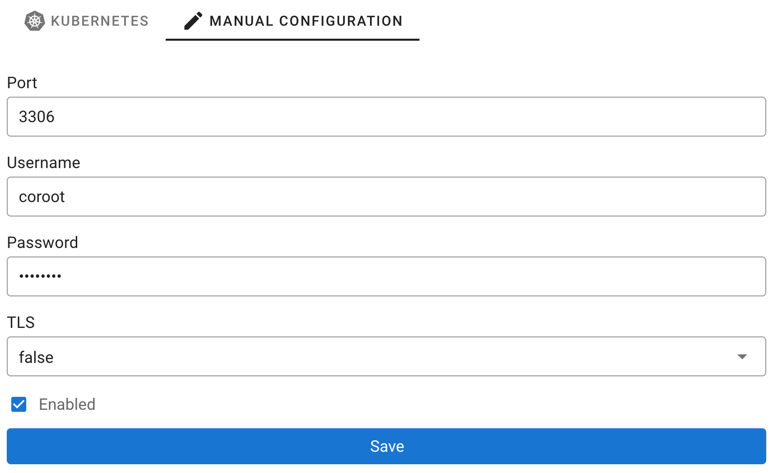
Coroot-cluster-agent updates its configuration every minute and also takes some time to collect metrics. Please wait a few minutes for telemetry to appear.
Configuration as code
When Coroot is deployed by the Kubernetes Operator, remote MySQL instances can be
declared in the clusterAgent.databases section of the Coroot custom resource instead of the UI, with credentials
referenced from a Kubernetes Secret. A hostname is re-resolved on every configuration update, and every resolved IP
address is monitored, so DNS-based failover and multi-address names work without changes:
spec:
  clusterAgent:
    databases:
      - type: mysql
        host: db.example.internal        # or `rds: <DBInstanceIdentifier>` (AWS integration) / `cloudsql: <instance name>` (GCP integration) / `ocidb: <display name>` (OCI integration)
        port: "3306"
        credentials:
          usernameSecret: {name: mysql-coroot, key: username}
          passwordSecret: {name: mysql-coroot, key: password}
Coroot attributes the collected metrics to the application it sees clients connecting to, by address. Settings in the
custom resource take precedence over the UI. Installations without the operator can put the same databases list in
the cluster-agent's configuration file.
Troubleshooting
Check the coroot-cluster-agent logs if you encounter any issues.