Postgres
Coroot leverages eBPF to monitor Postgres queries between applications and databases, requiring no additional integration. While this approach provides a high-level view of database performance, it lacks the visibility needed to understand why issues occur within the database internals.
To bridge this gap, Coroot also collects statistics from Postgres system views such as pg_stat_statements and pg_stat_activity, complementing the eBPF-based metrics and traces.
Prerequisites
This integration supports Postgres 10 and later. Older servers are reported as unsupported on the Postgres page, and no statistics are collected from them.
It requires a database user with the pg_monitor role and the pg_stat_statements extension enabled.
CREATE ROLE coroot WITH LOGIN PASSWORD '<PASSWORD>';
GRANT pg_monitor TO coroot;
CREATE EXTENSION pg_stat_statements;
The pg_stat_statements extension must be loaded via the shared_preload_libraries server setting.
Enable track_io_timing so Coroot can attribute disk I/O to specific queries. Without it, the per-query I/O time reported by pg_stat_statements is always zero.
ALTER SYSTEM SET track_io_timing = on;
SELECT pg_reload_conf();
Make sure the setting is persisted in the server configuration so it survives restarts. ALTER SYSTEM writes to postgresql.auto.conf, but if your Postgres is managed by an operator or a cloud provider (e.g., CloudNativePG, RDS), set track_io_timing in that platform's configuration instead — a runtime change may be reverted on the next restart or reconciliation.
Coroot shows a reminder on the Postgres page when this setting is off. track_io_timing adds negligible overhead on modern systems where the OS provides a fast clock source.
Required privileges explained
pg_monitor role
The pg_monitor role includes pg_read_all_stats and pg_read_all_settings, which grant read access to all the monitoring views Coroot uses:
pg_settings- server configuration.pg_stat_statements- query performance statistics (requires the extension).pg_stat_activity- current connections, active queries, and lock information.pg_stat_wal_receiver- WAL receiver status on replicas.pg_is_in_recovery(),pg_current_wal_lsn(),pg_last_wal_receive_lsn(),pg_last_wal_replay_lsn()- replication functions.
Connection to the postgres database
Coroot connects to the postgres database by default. For schema and size tracking, it also connects to each user database individually (Postgres isolates catalog data per database).
Schema and size tracking
Schema tracking queries pg_catalog system catalogs (pg_class, pg_namespace, pg_attribute, pg_attrdef, pg_constraint, pg_indexes) and calls pg_total_relation_size() for table sizes. The pg_monitor role provides sufficient access to these catalogs. Coroot connects to each user database to read its schema, so the monitoring user must have CONNECT privilege on the databases it should track (granted to PUBLIC by default in Postgres).
All access is read-only. Coroot never modifies any data, schema, or configuration on your Postgres server.
What data is collected
Server version and settings
Always collected. Coroot reads pg_settings on each scrape to collect:
server_version- identify the instance.- All settings with integer, real, or boolean values are exported as metrics (e.g.,
max_connections,shared_buffers,work_mem). track_activity_query_size- used internally to determine the query text truncation limit.
Settings change detection
Enabled by default. Controlled by --track-database-changes / TRACK_DATABASE_CHANGES (default: true).
Coroot compares successive pg_settings snapshots to detect configuration changes and surfaces them in the change timeline. Session-level and client-level overrides are excluded from tracking.
Query performance
Always collected. Coroot reads pg_stat_statements (joined with pg_roles and pg_database) to get per-query statistics:
datname,rolname- associate queries with a database and user.query- normalized query text. Postgres replaces literal values with parameter placeholders (e.g.,SELECT * FROM users WHERE id = $1), and Coroot performs additional obfuscation to ensure that sensitive query arguments never appear in the collected telemetry data.queryid- unique identifier for the normalized query.calls- query execution rate (calls/sec).total_plan_time + total_exec_time- total execution time rate (seconds/sec). On Postgres < 13, usestotal_time.blk_read_time + blk_write_time- I/O wait time rate (seconds/sec). On Postgres >= 17, also includes local and temp block I/O. Requirestrack_io_timing = onin the server configuration, otherwise these values are always zero.
The top 20 queries by execution time are reported each scrape interval.
Connections and locks
Always collected. Coroot reads pg_stat_activity (joined with pg_database) to collect:
datname,usename,state,wait_event_type- connection counts broken down by database, user, state, and wait event type.query,query_start- active query text and start time for latency estimation.backend_type- distinguish client backends from system processes (Postgres >= 10).pg_blocking_pids()- detect lock contention and report the number of queries blocked by each blocking query.
Query text from pg_stat_activity is also obfuscated before being stored.
Replication status
Always collected. Coroot calls pg_is_in_recovery() to determine the instance role and then collects:
On a primary:
pg_current_wal_lsn()- current WAL write position.
On a replica:
pg_last_wal_receive_lsn()- last WAL position received from the primary.pg_last_wal_replay_lsn()- last WAL position replayed.pg_is_wal_replay_paused()- whether replay is paused.pg_stat_wal_receiver- whether the WAL receiver is connected.primary_conninfofrompg_settings- identify the primary host and port.
On Postgres < 10, the older xlog function names are used automatically.
Checkpoints and background writer
Always collected. Coroot tracks checkpoint activity to spot checkpoints that fall behind and to estimate crash-recovery time:
pg_stat_checkpointer(Postgres >= 17;pg_stat_bgwriteron older versions) - checkpoints by trigger (timed vs. requested bymax_wal_size), completed restartpoints on replicas (Postgres >= 17), and buffers written by the checkpointer.pg_control_checkpoint()- WAL written since the last checkpoint (how much must be replayed after a crash) and time since the last checkpoint.
Metrics: pg_checkpoints_scheduled_total, pg_checkpoints_total, pg_restartpoints_total, pg_buffers_written_total, pg_time_since_last_checkpoint_seconds, pg_wal_since_last_checkpoint_bytes.
WAL, archiving, and replication slots
Always collected.
- WAL throughput - derived from the WAL LSN advance rate (write position on a primary, receive position on a replica).
pg_ls_waldir()- total size of the WAL directory on disk.pg_stat_archiver- WAL segments archived, archive failures, and whether the most recent archive attempt failed (surfaced by the "Postgres WAL archiving" check).pg_replication_slots- WAL retained by each replication slot and itswal_status(Postgres >= 13:reserved/extended/unreserved/lost), to catch slots pinning WAL on disk.
Metrics: pg_wal_throughput, pg_wal_size_bytes, pg_wal_archived_segments_total, pg_wal_archive_failures_total, pg_wal_archiving_status, pg_replication_slot_retained_wal_bytes.
Transaction ID age (wraparound)
Always collected. Coroot monitors how close each database is to transaction-ID and multixact wraparound, and attributes the oldest un-freezable transaction to what is holding it back:
pg_database-age(datfrozenxid)andmxid_age(datminmxid)per database.- Oldest xmin holder (Postgres >= 10) - a running query, a standby (
walsender), a replication slot, or a prepared transaction - so you can see what is preventing vacuum from advancing the freeze horizon.
Metrics: pg_xid_age, pg_multixact_age, pg_oldest_xmin_age.
Bloat estimation
Enabled by default. Controlled by --track-database-bloat / TRACK_DATABASE_BLOAT (default: true).
Coroot estimates wasted space (bloat) for tables and indexes from planner statistics (pg_class.reltuples/relpages and pg_stats column widths), without scanning table data. Because it relies on statistics, keep autovacuum/ANALYZE current for accurate results — the estimates are approximate.
This is collected on a slower interval than the basic per-scrape metrics (alongside schema and size tracking), and respects --max-tables-per-database and --exclude-databases. Only the top tables and indexes by estimated bloat are reported per database. TOAST relations are excluded.
Metrics: pg_db_table_bloat_bytes, pg_db_index_bloat_bytes, pg_table_bloat_bytes, pg_index_bloat_bytes.
Autovacuum
Enabled by default. Collected with size tracking (--track-database-sizes).
Coroot reports dead rows — row versions left behind by UPDATE/DELETE that vacuum has not yet reclaimed — per table (top tables only). This is the leading indicator that autovacuum is falling behind, and it is distinct from bloat (dead rows are reclaimed by VACUUM for reuse; bloat is the accumulated space only pg_repack/VACUUM FULL return to the OS).
The "Postgres autovacuum" check uses two signals that each cover the other's blind spot:
- Autovacuum pressure =
n_dead_tup / (autovacuum_vacuum_threshold + autovacuum_vacuum_scale_factor × n_live_tup)— how many times past its own autovacuum trigger threshold a table sits. Healthy operation sawtooths around ~1 (crossing 1 is what triggers a vacuum), so a value that stays above 1 means the table isn't being serviced. Because it is normalized to the trigger threshold, it's size-independent — a large table's normal between-vacuum peak doesn't fire. The trigger settings come frompg_settings, overridden by any per-tablereloptions(autovacuum_vacuum_scale_factor/autovacuum_vacuum_threshold). - Dead bytes — materiality, so a tiny table many times past its trigger (but only kilobytes of dead rows) doesn't fire.
The check fires when a table is both past ~2× its autovacuum trigger threshold for the whole window and holds a material amount of dead rows. The finding also reports how long ago autovacuum last ran the table, so the cause is easy to read off: a run long ago means autovacuum isn't running it (disabled, starved, or mis-tuned), while a recent run with dead rows still piling up means it runs but can't reclaim them — a snapshot (a long-running transaction, prepared transaction, or replication slot) is holding the vacuum horizon; see the oldest-xmin holder above.
The finding pinpoints the root cause, in order:
-
autovacuum disabled on the table (
autovacuum_enabled=false). -
a snapshot-pinning transaction/slot — autovacuum runs but can't remove the dead rows (see above).
-
a vacuum is running but is being throttled — a worker is on the table and mostly sleeping on the
VacuumDelaycost-based delay, so it can't keep up (raiseautovacuum_vacuum_cost_limit/ lowerautovacuum_vacuum_cost_delay). -
a vacuum is running but isn't keeping up — a worker is on the table but not cost-delayed, so the slowness is elsewhere (large table / slow storage).
-
all autovacuum workers are busy — no worker is on the table while
pg_autovacuum_workersis pinned atautovacuum_max_workers, i.e. it's waiting for a free worker (raiseautovacuum_max_workers). -
pg_stat_user_tables-n_dead_tup,n_live_tup,last_autovacuum, with dead rows scaled to bytes bypg_relation_size(). -
pg_class.reloptions- per-table autovacuum overrides (autovacuum_enabled, trigger and cost settings) — used both to compute pressure against the table's own trigger and to pinpoint per-table throttling. -
pg_stat_activity- count of running autovacuum workers. -
pg_stat_progress_vacuum(+pg_stat_activity) - whether a vacuum is currently running on the table, and whether it is sleeping on the cost-basedVacuumDelay.
Metrics: pg_table_dead_tuple_bytes, pg_table_dead_tuples, pg_table_live_tuples, pg_table_seconds_since_last_autovacuum, pg_table_setting, pg_table_vacuum_in_progress, pg_table_vacuum_throttled, pg_autovacuum_workers.
Planner statistics (autoanalyze)
Enabled by default (part of size tracking).
Stale planner statistics are a different failure from bloat: when a table has been modified well past the point where autoanalyze should have refreshed its statistics, the query planner works from stale row estimates and can pick bad plans (a seq scan instead of an index, a nested loop instead of a hash join). It is a common cause of sudden latency regressions after a bulk load or a burst of writes.
The "Postgres stale statistics" check mirrors the autovacuum check but for ANALYZE:
- Autoanalyze pressure =
n_mod_since_analyze / (autovacuum_analyze_threshold + autovacuum_analyze_scale_factor × reltuples)— how many times past its own autoanalyze trigger a table sits.n_mod_since_analyzecounts inserts as well as updates and deletes, so unlike dead tuples it also catches append-only tables. The denominator usespg_class.reltuples(persisted) rather thann_live_tup(which resets on replica promotion), so a freshly promoted primary doesn't show false pressure.
The check fires when a large table (a materiality gate on row count keeps small tables, where a bad plan is cheap anyway, out of the alert) sits above ~2× its autoanalyze trigger. The finding reports how long ago the table was last analyzed and whether autoanalyze is disabled on it, and always names the fix: run ANALYZE.
pg_stat_user_tables-n_mod_since_analyze,last_analyze/last_autoanalyze.pg_class-reltuples(row estimate) andreloptions(per-tableautovacuum_analyze_threshold/scale_factor, andautovacuum_enabled=false, which disables autoanalyze too).
Metrics: pg_table_mods_since_analyze, pg_table_reltuples, pg_table_seconds_since_last_analyze, pg_table_setting.
Schema tracking
Enabled by default. Controlled by --track-database-changes / TRACK_DATABASE_CHANGES (default: true).
Coroot connects to each user database and queries pg_catalog to reconstruct table DDL and detect schema changes over time:
pg_class+pg_namespace+pg_attribute+pg_attrdef- column name, data type, nullability, default value.pg_constraint- primary keys, foreign keys, unique constraints, check constraints.pg_indexes- index definitions.
System schemas (pg_catalog, information_schema) are excluded.
Table and database sizes
Enabled by default. Controlled by --track-database-sizes / TRACK_DATABASE_SIZES (default: true).
Coroot reads pg_database_size() for per-database sizes and pg_total_relation_size() (via pg_class) for per-table sizes including indexes and TOAST data. Template databases and databases that don't allow connections are skipped.
Common options for schema, size, and bloat tracking
Schema tracking, size tracking, and bloat estimation respect these additional flags:
--max-tables-per-database/MAX_TABLES_PER_DATABASE(default:1000) - skip databases with more tables than this limit, protecting against expensive queries on very large schemas.--exclude-databases/EXCLUDE_DATABASES(default:rdsadmin,cloudsqladmin,mysql,information_schema,performance_schema,sys) - databases to exclude from monitoring: no connections, query statistics, transaction ID age, schema, size or bloat metrics are collected for them. The default list is shared with the MySQL integration; for Postgres onlyrdsadminandcloudsqladmin(the internal databases of Amazon RDS and Cloud SQL, whose maintenance activity would otherwise show up among your queries) are relevant (the others don't exist as databases).
Each capability can be toggled independently:
--track-database-changes/TRACK_DATABASE_CHANGES(default:true) - schema and settings change tracking.--track-database-sizes/TRACK_DATABASE_SIZES(default:true) - per-database and per-table size metrics.--track-database-bloat/TRACK_DATABASE_BLOAT(default:true) - per-database, per-table, and per-index bloat estimation (Postgres only).
Performance impact
Coroot collects most of the statistics over a single persistent connection to the postgres database. Once a minute it also connects to each database,
one at a time, for schema, size and bloat tracking, so the agent never runs more than one query at a time.
We benchmarked the integration on a Postgres 18 server with 100 databases, 10,000 tables and 500 client connections executing 16,000 queries per second. With the default agent settings (15-second scrape interval; schema, size and bloat tracking enabled):
- the latency of application queries did not change when the instrumentation was switched on and off;
- the additional CPU usage of Postgres was below the measurement noise: the agent's queries took about 6.6 seconds of execution time per minute;
- coroot-cluster-agent consumed about 0.05 CPU cores and less than 310MB of memory.
See Performance Impact for the lab setup and detailed results.
Kubernetes (pod annotations)
The Kubernetes approach to monitoring databases typically involves running metric exporters as sidecar containers within database instance Pods. However, this method can be challenging for certain use cases. Coroot has a dedicated coroot-cluster-agent that can discover and gather metrics from databases without requiring a separate container for each database instance.
Coroot-cluster-agent automatically discovers and collects metrics from pods annotated with coroot.com/postgres-scrape annotations.
Coroot can retrieve database credentials from a Secret or be configured with plain-text credentials.
coroot.com/postgres-scrape: "true"
coroot.com/postgres-scrape-port: "5432"

# plain-text credentials
coroot.com/postgres-scrape-credentials-username: "coroot"
coroot.com/postgres-scrape-credentials-password: "<PASSWORD>"

# credentials from a secret
coroot.com/postgres-scrape-credentials-secret-name: "postgres-secret"
coroot.com/postgres-scrape-credentials-secret-username-key: "username"
coroot.com/postgres-scrape-credentials-secret-password-key: "password"

# client SSL options: disable, require, verify-ca (default: disable)
coroot.com/postgres-scrape-param-sslmode: "disable"

# TLS certificates from a secret: the server certificate is verified against the CA;
# the client certificate is presented to servers that require mutual TLS.
# Only the explicitly specified keys are read - set the ca key, the cert/key
# pair, or all three
coroot.com/postgres-scrape-tls-secret-name: "postgres-ca"
coroot.com/postgres-scrape-tls-secret-ca-key: "ca.crt"
coroot.com/postgres-scrape-tls-secret-cert-key: "tls.crt"
coroot.com/postgres-scrape-tls-secret-key-key: "tls.key"
Note that Coroot checks only Pod annotations, not higher-level Kubernetes objects like Deployments or StatefulSets.
CloudNativePG (CNPG)
CNPG propagates inheritedMetadata to every instance Pod, so the scrape annotations only need
to be declared once on the Cluster. This example reuses the operator-managed superuser secret
(<cluster>-superuser, keys username/password). Alternatively, create a dedicated role with
the pg_monitor role via spec.managed.roles. pg_stat_statements is enabled through the
Postgres parameters (CNPG adds it to shared_preload_libraries automatically), and
track_io_timing is set here so it survives restarts and reconciliation.
apiVersion: postgresql.cnpg.io/v1
kind: Cluster
metadata:
  name: postgres-app
spec:
  instances: 3
  enableSuperuserAccess: true
  inheritedMetadata:
    annotations:
      coroot.com/postgres-scrape: "true"
      coroot.com/postgres-scrape-credentials-secret-name: "postgres-app-superuser"
      coroot.com/postgres-scrape-credentials-secret-username-key: "username"
      coroot.com/postgres-scrape-credentials-secret-password-key: "password"
  postgresql:
    parameters:
      pg_stat_statements.track: "all"
      track_io_timing: "on"
  storage:
    size: 10Gi
Percona Operator for PostgreSQL
Put the annotations on spec.instances[].metadata, not spec.metadata, which would also
annotate the PgBouncer Pods and would make Coroot try to scrape them as Postgres. A few operator
specifics:
- The monitoring user's Secret is named
<cluster>-pguser-<user>and its keys areuserandpassword(notusername/password). - Percona's
pg_hba.confonly allows TLS connections, sosslmode: requireis required. - The operator applies user options with
ALTER ROLE, which can't grant role membership (sopg_monitorcan't be attached this way). The example usesSUPERUSER. Alternatively, grantpg_monitorto the role manually. pg_stat_statementsis enabled viaextensions.builtin. This adds it toshared_preload_librariesand creates the extension in the app andtemplate1databases but not thepostgresmaintenance database Coroot connects to. RunCREATE EXTENSION pg_stat_statements;inpostgresonce if the per-query stats are missing.
apiVersion: pgv2.percona.com/v2
kind: PerconaPGCluster
metadata:
  name: pg-app
spec:
  postgresVersion: 18
  patroni:
    dynamicConfiguration:
      postgresql:
        parameters:
          pg_stat_statements.track: "all"
          track_io_timing: "on"
  extensions:
    builtin:
      pg_stat_statements: true
  instances:
    - name: instance1
      replicas: 3
      metadata:
        annotations:
          coroot.com/postgres-scrape: "true"
          coroot.com/postgres-scrape-param-sslmode: "require"
          coroot.com/postgres-scrape-credentials-secret-name: "pg-app-pguser-coroot"
          coroot.com/postgres-scrape-credentials-secret-username-key: "user"
          coroot.com/postgres-scrape-credentials-secret-password-key: "password"
  users:
    # dedicated monitoring user. spec.users is reconciled continuously, so the operator
    # creates/updates it on an already-running cluster too.
    - name: coroot
      databases:
        - postgres
      options: "SUPERUSER"
Zalando Postgres Operator
Put the scrape annotations on spec.podAnnotations, which the operator applies to the Postgres
(spilo) pods. A few operator specifics:
- The monitoring user is created via
spec.users, and the operator publishes its credentials in a Secret named<user>.<clustername>.credentials.postgresql.acid.zalan.dowith keysusernameandpassword. - spilo's
pg_hba.confrejects non-TLS network connections, sosslmode: requireis needed. spec.usersflags are role attributes (superuser,createdb, and so on), not role membership, sopg_monitorcannot be attached this way. The example usessuperuser. Alternatively, grantpg_monitorto the role manually.pg_stat_statementsis preloaded by the spilo image, so noshared_preload_librariessetup is needed. Settrack_io_timinginspec.postgresql.parameters.
apiVersion: acid.zalan.do/v1
kind: postgresql
metadata:
  name: acid-app
  namespace: default
spec:
  teamId: "acid"
  numberOfInstances: 2
  postgresql:
    version: "16"
    parameters:
      track_io_timing: "on"
  volume:
    size: 10Gi
  users:
    coroot:
      - superuser
      - login
  podAnnotations:
    coroot.com/postgres-scrape: "true"
    coroot.com/postgres-scrape-param-sslmode: "require"
    coroot.com/postgres-scrape-credentials-secret-name: "coroot.acid-app.credentials.postgresql.acid.zalan.do"
    coroot.com/postgres-scrape-credentials-secret-username-key: "username"
    coroot.com/postgres-scrape-credentials-secret-password-key: "password"
CloudNativePG and the Percona Operator also expose backup state to Coroot automatically, with no extra configuration beyond the operator's own backup setup (see Postgres backups). The Zalando operator does not expose its WAL-G backup state in any Kubernetes resource, so for Zalando clusters backup health is covered by the WAL archiving check rather than the Backups section.
Non-Kubernetes environments
In non-Kubernetes environments, the Postgres integration can be enabled via the Coroot UI. In this setup, coroot-cluster-agent retrieves Postgres instance credentials from the Coroot configuration storage.
To configure the integration, go to the POSTGRES tab and click the Configure button.

Then, switch to Manual Configuration, complete the form, and click Save.
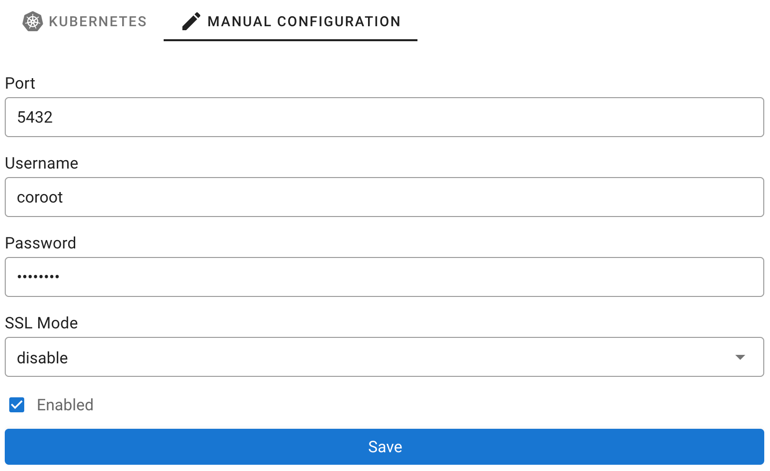
Coroot-cluster-agent updates its configuration every minute and also takes some time to collect metrics. Please wait a few minutes for telemetry to appear.
Configuration as code
When Coroot is deployed by the Kubernetes Operator, remote Postgres instances can be
declared in the clusterAgent.databases section of the Coroot custom resource instead of the UI, with credentials
referenced from a Kubernetes Secret. A hostname is re-resolved on every configuration update, and every resolved IP
address is monitored, so DNS-based failover and multi-address names work without changes:
spec:
  clusterAgent:
    databases:
      - type: postgres
        host: db.example.internal        # or `rds: <DBInstanceIdentifier>` (AWS integration) / `cloudsql: <instance name>` (GCP integration) / `ocidb: <display name>` (OCI integration)
        port: "5432"
        credentials:
          usernameSecret: {name: postgres-coroot, key: username}
          passwordSecret: {name: postgres-coroot, key: password}
        params:
          sslmode: require               # required by RDS Postgres 15+ and any server with `ssl = on` enforced in pg_hba.conf
Coroot attributes the collected metrics to the application it sees clients connecting to, by address. Settings in the
custom resource take precedence over the UI. Installations without the operator can put the same databases list in
the cluster-agent's configuration file.
Troubleshooting
Check the coroot-cluster-agent logs if you encounter any issues.