Memcached
Coroot leverages eBPF to monitor Memcached queries between applications and databases, requiring no additional integration. While this approach provides a high-level view of database performance, it lacks the visibility needed to understand why issues occur within the database internals.
To bridge this gap, Coroot also collects telemetry using Memcached Statistics commands, complementing the eBPF-based metrics and traces.
Kubernetes (pod annotations)
The Kubernetes approach to monitoring databases typically involves running metric exporters as sidecar containers within database instance Pods. However, this method can be challenging for certain use cases. Coroot has a dedicated coroot-cluster-agent that can discover and gather metrics from databases without requiring a separate container for each database instance.
Coroot-cluster-agent automatically discovers and collects metrics from pods annotated with coroot.com/memcached-scrape annotations.
coroot.com/memcached-scrape: "true"
coroot.com/memcached-scrape-port: "11211"
Note that Coroot checks only Pod annotations, not higher-level Kubernetes objects like Deployments or StatefulSets.
Non-Kubernetes environments
In non-Kubernetes environments, the Memcached integration can be enabled via the Coroot UI. In this setup, coroot-cluster-agent retrieves Memcached instance credentials from the Coroot configuration storage.
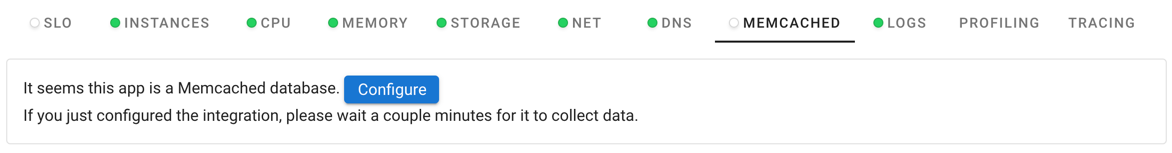
To configure the integration, go to the MEMCACHED tab and click the Configure button.
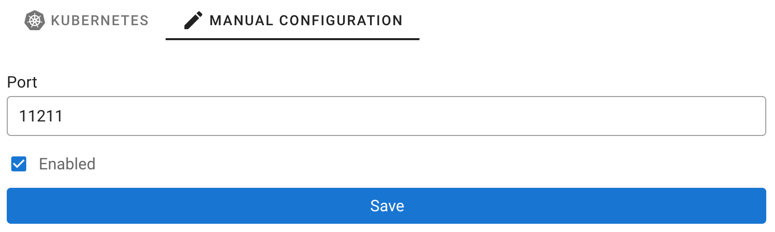
Then, switch to Manual Configuration, complete the form, and click Save.
Coroot-cluster-agent updates its configuration every minute and also takes some time to collect metrics. Please wait a few minutes for telemetry to appear.
Troubleshooting
Check the coroot-cluster-agent logs if you encounter any issues.