MongoDB
Coroot leverages eBPF to monitor MongoDB queries between applications and databases, requiring no additional integration. While this approach provides a high-level view of database performance, it lacks the visibility needed to understand why issues occur within the database internals.
To bridge this gap, Coroot also collects telemetry directly from every mongod instance: server status, per-query statistics,
replication and oplog state, in-flight operations, and per-collection storage statistics, complementing the eBPF-based metrics and traces.
Prerequisites
The integration requires a monitoring user with the clusterMonitor role and read access to the local database:
db.getSiblingDB("admin").createUser({
    user: "coroot",
    pwd: "<PASSWORD>",
    roles: [
        { role: "clusterMonitor", db: "admin" },
        { role: "read", db: "local" },
    ]
})
To track index changes, Coroot reads the index definitions of all collections with a single $listCatalog aggregation (MongoDB 6.0+).
It requires the listCollections and listIndexes privileges, which are not included in clusterMonitor.
They can be granted with a custom role that gives access to the metadata only, not to the data:
db.getSiblingDB("admin").createRole({
    role: "corootCatalog",
    privileges: [
        { resource: { db: "", collection: "" }, actions: ["listCollections", "listIndexes"] },
        { resource: { db: "", collection: "system.js" }, actions: ["listCollections", "listIndexes"] },
        { resource: { db: "", system_buckets: "" }, actions: ["listCollections", "listIndexes"] },
    ],
    roles: []
})
db.getSiblingDB("admin").grantRolesToUser("coroot", [{ role: "corootCatalog", db: "admin" }])
Without this role, everything else works, but index changes are not tracked, and the agent logs an authorization error.
The agent connects to each mongod instance directly (not through mongos or a load balancer), which is required for
per-instance metrics such as replication status and WiredTiger statistics.
Per-query statistics are collected from the database profiler (system.profile), which works on every
MongoDB version. Enable it on each mongod:
operationProfiling:
  mode: all
  slowOpThresholdMs: 200
  rateLimit: 100 # Percona Server for MongoDB only: sample 1/100 of fast operations
On upstream MongoDB (no rateLimit support), use mode: slowOp — the top-queries view then covers
operations slower than slowOpThresholdMs.
Without profiling enabled, Coroot still collects all instance-level metrics, but the top-queries view stays empty.
Cost. All other MongoDB metrics are cheap to collect (they come from in-memory counters via serverStatus
and friends), but the profiler is different: with it enabled, mongod writes a document to system.profile for
every operation it captures. That write amplification is paid by the server, not the agent — the agent only reads
new profile entries incrementally. Keep the overhead bounded by profiling selectively rather than everything:
raise slowOpThresholdMs so only genuinely slow operations are recorded, and on Percona Server for MongoDB use
rateLimit to sample fast operations instead of capturing all of them. On a busy cluster, prefer mode: slowOp
(or a higher threshold) over mode: all.
Required privileges explained
clusterMonitor role
Grants read access to everything the agent collects:
serverStatus- connections, operation counters, latencies, WiredTiger cache and concurrency tickets, queues, flow control.replSetGetStatus/replSetGetConfig- per-member replication state, optimes, votes, and priorities.$currentOp- in-flight operations (long-running operations, lock waits, per-application connection counts).system.profile- per-query execution statistics (requiresoperationProfilingto be enabled).listDatabases,top,$collStats- database sizes, and the sizes and storage fragmentation of the largest and the most actively written collections.
corootCatalog (optional custom role)
Grants listCollections and listIndexes on all databases, which $listCatalog requires to return index definitions.
These privileges expose collection and index metadata only. Coroot uses them to detect index changes.
read on local
Used to determine the oplog window (the time span between the oldest and the newest entries of local.oplog.rs) and the oplog size.
All access is read-only. Coroot never modifies any data or configuration on your MongoDB servers.
The query shapes collected from the profiler and $currentOp are normalized: literal values are replaced with ?.
Kubernetes (pod annotations)
Coroot-cluster-agent automatically discovers and collects metrics from pods annotated with coroot.com/mongodb-scrape annotations.
Coroot can retrieve database credentials from a Secret or be configured with plain-text credentials.
coroot.com/mongodb-scrape: "true"
coroot.com/mongodb-scrape-port: "27017"

# plain-text credentials
coroot.com/mongodb-scrape-credentials-username: "coroot"
coroot.com/mongodb-scrape-credentials-password: "<PASSWORD>"

# credentials from a secret
coroot.com/mongodb-scrape-credentials-secret-name: "mongodb-secret"
coroot.com/mongodb-scrape-credentials-secret-username-key: "username"
coroot.com/mongodb-scrape-credentials-secret-password-key: "password"

# optional parameters
coroot.com/mongodb-scrape-param-tls: "false" # false, true, skip-verify
coroot.com/mongodb-scrape-param-auth-source: "admin"

# TLS certificates from a secret: the CA verifies the server certificate; the
# client certificate/key are presented to servers that require mutual TLS.
# Only the explicitly specified keys are read - set the CA key, the cert/key
# pair, or all three
coroot.com/mongodb-scrape-tls-secret-name: "mongodb-ssl"
coroot.com/mongodb-scrape-tls-secret-ca-key: "ca.crt"
coroot.com/mongodb-scrape-tls-secret-cert-key: "tls.crt"
coroot.com/mongodb-scrape-tls-secret-key-key: "tls.key"
Note that Coroot checks only Pod annotations, not higher-level Kubernetes objects like Deployments or StatefulSets.
Percona Operator for MongoDB
Clusters managed by the Percona Operator for MongoDB already have
a suitable monitoring user: the operator creates it with the clusterMonitor role and stores the credentials in the
internal-<cluster>-users Secret. Annotate the replica set pods through the PerconaServerMongoDB custom resource:
apiVersion: psmdb.percona.com/v1
kind: PerconaServerMongoDB
metadata:
  name: mongodb
spec:
  replsets:
    - name: rs0
      configuration: |
        operationProfiling:
          mode: all
          slowOpThresholdMs: 200
          rateLimit: 100
      annotations:
        coroot.com/mongodb-scrape: "true"
        coroot.com/mongodb-scrape-port: "27017"
        coroot.com/mongodb-scrape-credentials-secret-name: "internal-mongodb-users"
        coroot.com/mongodb-scrape-credentials-secret-username-key: "MONGODB_CLUSTER_MONITOR_USER"
        coroot.com/mongodb-scrape-credentials-secret-password-key: "MONGODB_CLUSTER_MONITOR_PASSWORD"
The operator's default TLS mode (preferTLS) accepts plaintext connections from within the cluster, so no TLS parameters are needed.
To connect over verified TLS (required for requireTLS clusters), point the TLS annotation at the operator's TLS secret:
coroot.com/mongodb-scrape-tls-secret-name: "<cluster>-ssl"
coroot.com/mongodb-scrape-tls-secret-ca-key: "ca.crt"
coroot.com/mongodb-scrape-tls-secret-cert-key: "tls.crt"
coroot.com/mongodb-scrape-tls-secret-key-key: "tls.key"
The secret's ca.crt verifies the server certificate chain (hostname verification is skipped, since instances are scraped
by pod IP while their certificates carry service DNS names), and its tls.crt/tls.key are presented as the client
certificate — mongod instances configured with a CA require one. Alternatively, coroot.com/mongodb-scrape-param-tls: "skip-verify" enables TLS without any verification (the operator's default preferTLS mode also accepts plaintext).
Backups
If backups are enabled through the operator (percona-backup-mongodb), Coroot automatically tracks the backup schedule,
point-in-time recovery status, and recent backup runs from the PerconaServerMongoDB and PerconaServerMongoDBBackup
custom resources. The Backups inspection alerts on stale, failed, or overdue backups.
Non-Kubernetes environments
In non-Kubernetes environments, the MongoDB integration can be enabled via the Coroot UI. In this setup, coroot-cluster-agent retrieves MongoDB instance credentials from the Coroot configuration storage.
To configure the integration, go to the MONGODB tab and click the Configure button.

Then, switch to Manual Configuration, complete the form, and click Save.
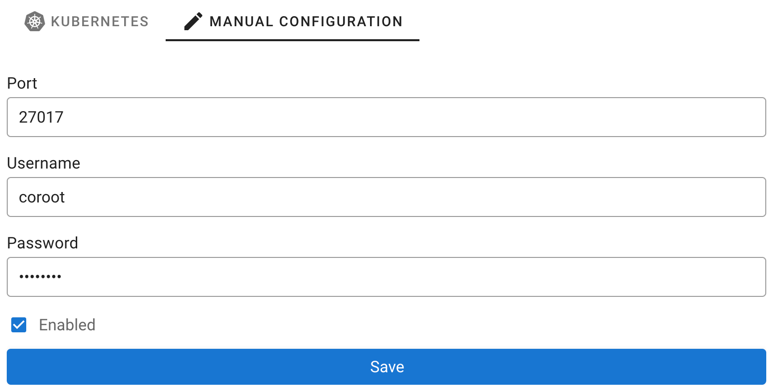
Coroot-cluster-agent updates its configuration every minute and also takes some time to collect metrics. Please wait a few minutes for telemetry to appear.
Configuration as code
When Coroot is deployed by the Kubernetes Operator, remote MongoDB instances can be
declared in the clusterAgent.databases section of the Coroot custom resource instead of the UI, with credentials
referenced from a Kubernetes Secret. A hostname is re-resolved on every configuration update, and every resolved IP
address is monitored, so DNS-based failover and multi-address names work without changes:
spec:
  clusterAgent:
    databases:
      - type: mongodb
        host: mongo.example.internal
        port: "27017"
        credentials:
          usernameSecret: {name: mongodb-coroot, key: username}
          passwordSecret: {name: mongodb-coroot, key: password}
Coroot attributes the collected metrics to the application it sees clients connecting to, by address. Settings in the
custom resource take precedence over the UI. Installations without the operator can put the same databases list in
the cluster-agent's configuration file.
What data is collected
- Server status: connections (current, available, active, created, rejected), operation counters, document operations, read/write/command latencies, queued operations, write conflicts, WiredTiger concurrency tickets, WiredTiger cache usage, evictions and bytes read into cache, checkpoints (count and time) and journal writes (including bytes since the last checkpoint - the crash-recovery replay amount), query executor efficiency (keys/documents scanned vs returned, collection scans, in-memory sorts), open and timed-out cursors, TTL deletions, and flow control.
- Replication: state, health, and optime of every replica set member, member configuration (votes, priorities, arbiters), secondary oplog apply throughput and buffer, and the oplog window and size.
- Per-query statistics: executions, total execution time, and documents/keys examined vs returned per
normalized query shape (top 20 by total time), collected from the profiler (
system.profile). - In-flight operations: long-running operations with their normalized shapes and plans (COLLSCAN detection), operations waiting for locks, and connection counts per client application.
- Storage: database and collection sizes, growth rates, and reclaimable (fragmented) collection storage.
- Change tracking: index changes and server parameter changes are emitted as events on the change timeline.
See the cluster-agent metrics reference for the complete list of metrics, and the MongoDB inspection for the checks built on top of them.
Performance impact
Most of the metrics come from in-memory counters and are cheap to collect. The only expensive statistics are collection storage stats ($collStats),
so the agent doesn't walk all collections: on each round it only looks at the collections with the most writes (according to top)
and the collections of the largest databases, up to 500 in total. All commands are executed sequentially over a single connection.
We benchmarked the integration on a MongoDB 8.0 server with 100 databases, 10,000 collections and 500 client connections executing 7,200 operations per second. With the default agent settings (15-second scrape interval, collection size and index change tracking enabled):
- the latency of application queries did not change when the instrumentation was switched on and off;
- the additional CPU usage of
mongodwas below the measurement noise, with no additional memory usage; - coroot-cluster-agent consumed about 0.015 CPU cores and less than 60MB of memory.
See Performance Impact for the lab setup and detailed results.
Troubleshooting
Check the coroot-cluster-agent logs if you encounter any issues.