Alerts
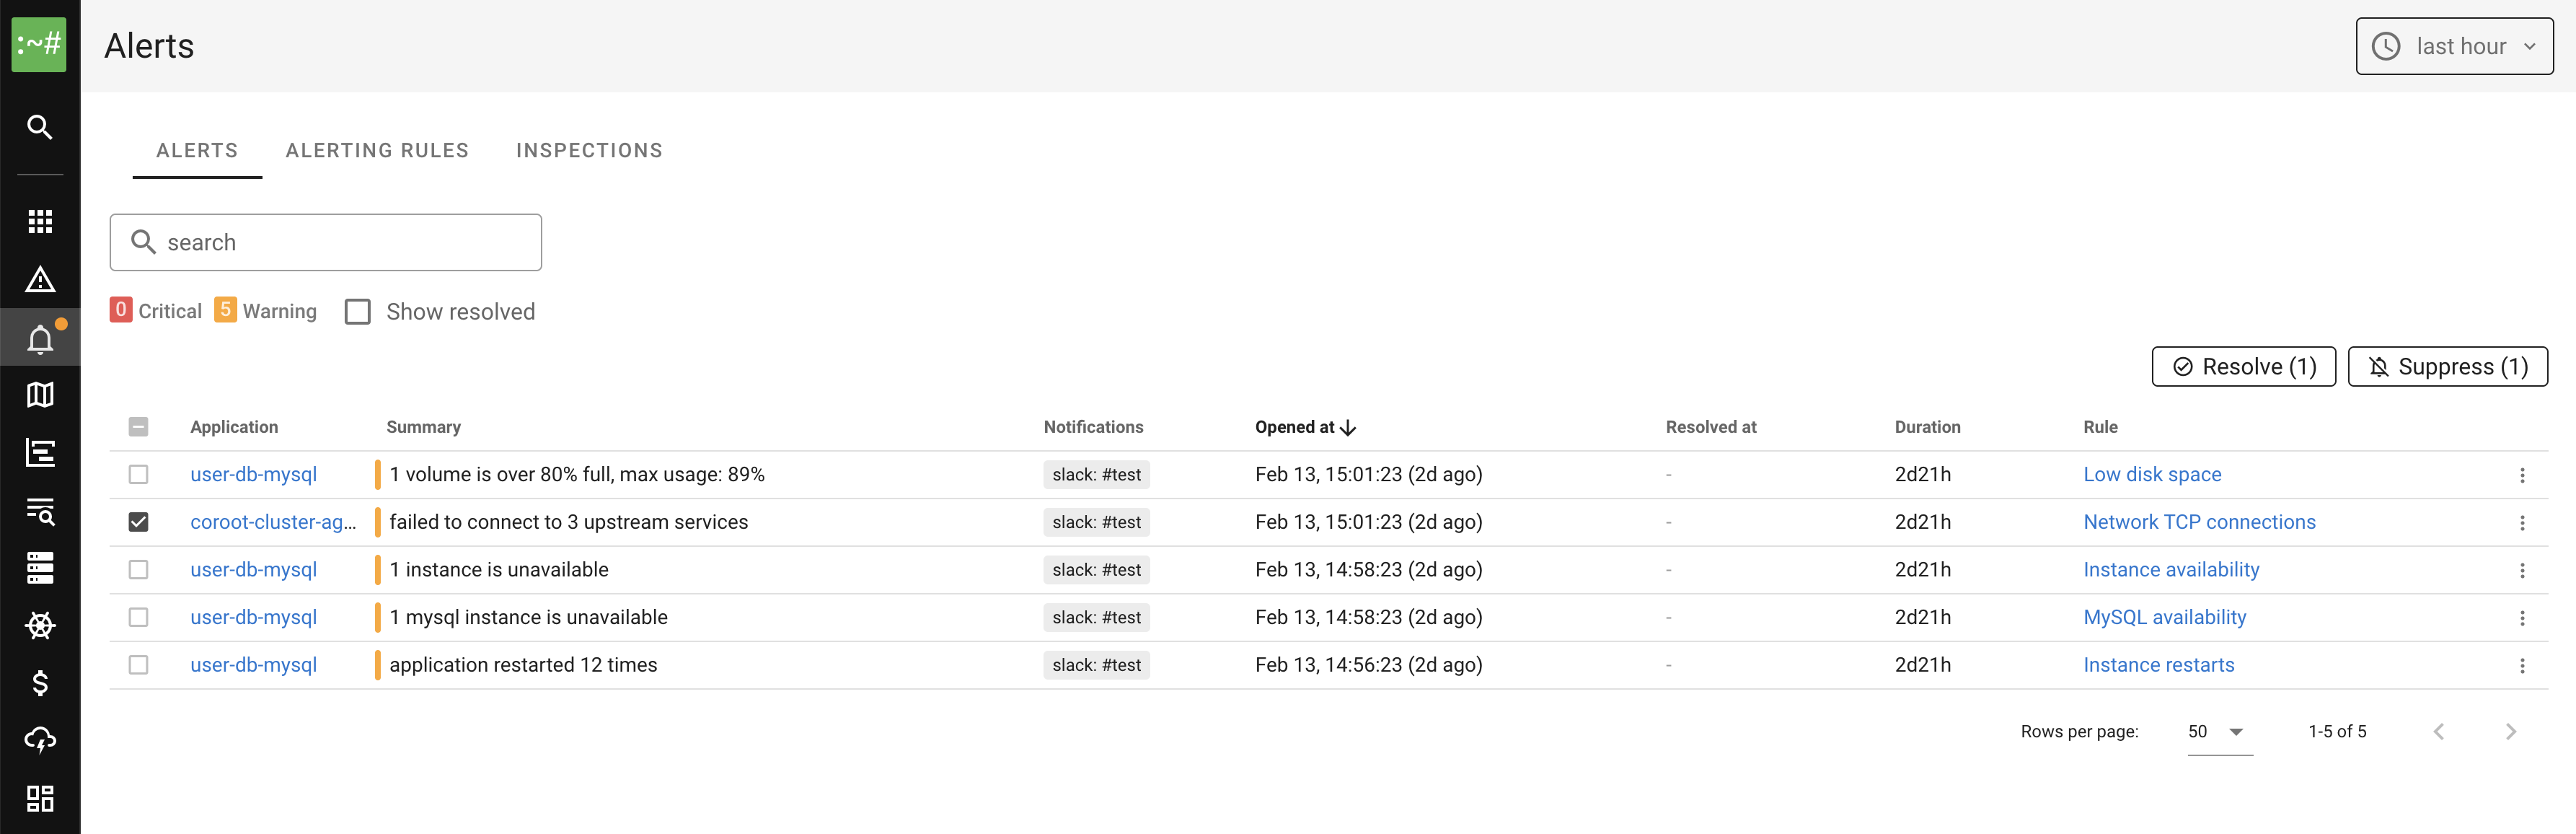
Coroot continuously monitors your applications and fires alerts when something goes wrong. The Alerts page displays a list of both firing and resolved alerts within the selected time window.
How alerting works
Coroot evaluates alerting rules on every data collection cycle. Each rule defines a source, a set of matching applications, and a severity level.
There are four types of alert sources:
- Check-based alerts: Coroot runs a set of built-in inspections (checks) for every application, such as CPU utilization, instance availability, or database latency. When a check exceeds its threshold, the corresponding alert fires.
- Log-based alerts: Coroot automatically detects new error and fatal log patterns using its log pattern detection engine. When a new pattern appears with enough occurrences, an alert fires. Optionally, patterns can be evaluated by AI to reduce noise.
- Kubernetes events-based alerts: Coroot monitors Kubernetes events (e.g., FailedScheduling, BackOff, Unhealthy) collected by coroot-cluster-agent and fires alerts when Warning events are detected. Events are automatically grouped by application and reason, so multiple pods of the same Deployment produce a single alert rather than an alert storm. Node-level events from the node-controller (e.g., NodeNotReady) are grouped by cluster and reason instead of per-application, because a single node failure typically affects many applications at once and would otherwise cause an alert storm.
- PromQL-based alerts: Custom alerting rules based on PromQL expressions. This allows you to alert on any metric available in your Prometheus-compatible data source.
Evaluation flow
- On each cycle, Coroot evaluates every enabled alerting rule against matching applications.
- If the alert condition is met, Coroot waits for the configured For duration before firing the alert. This prevents transient spikes from causing alerts.
- Once fired, the alert remains active until the condition clears. The Keep firing for duration prevents flapping by keeping the alert active for a grace period after the condition resolves.
- Notifications are sent through the configured integrations when an alert fires or resolves.
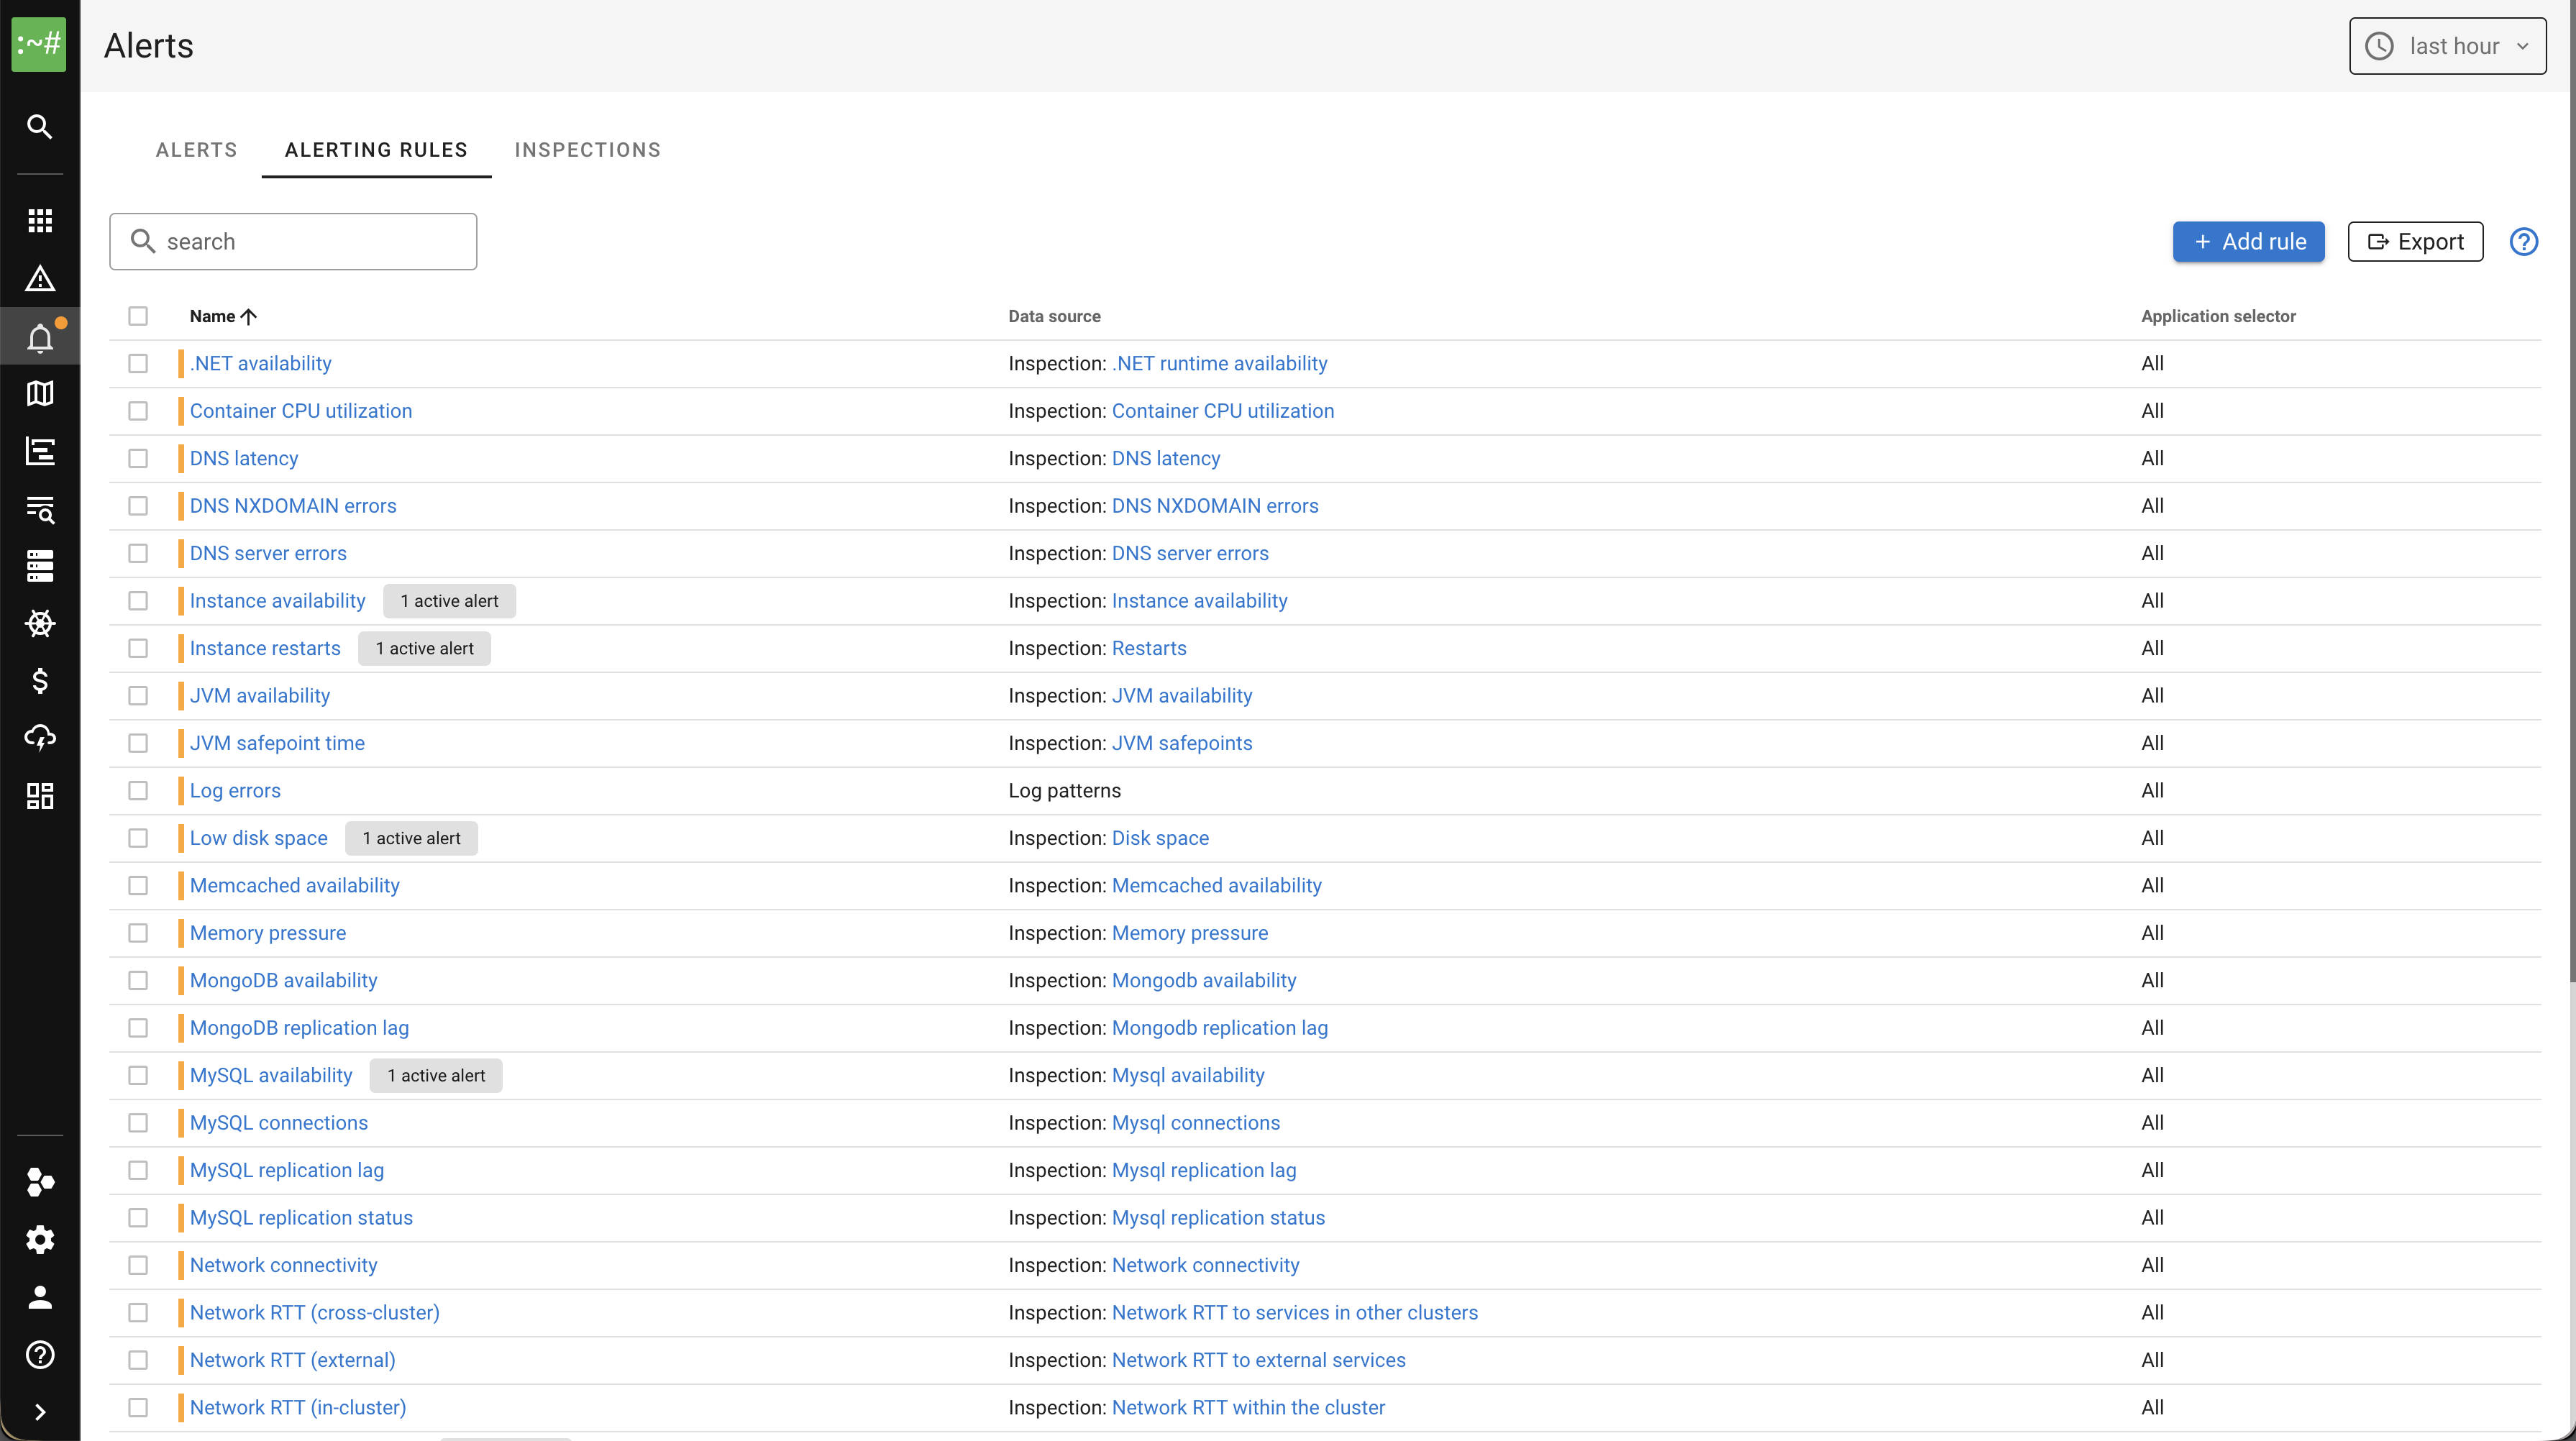
Alerting rules
To manage alerting rules, navigate to the Alerts page and click Alerting Rules.
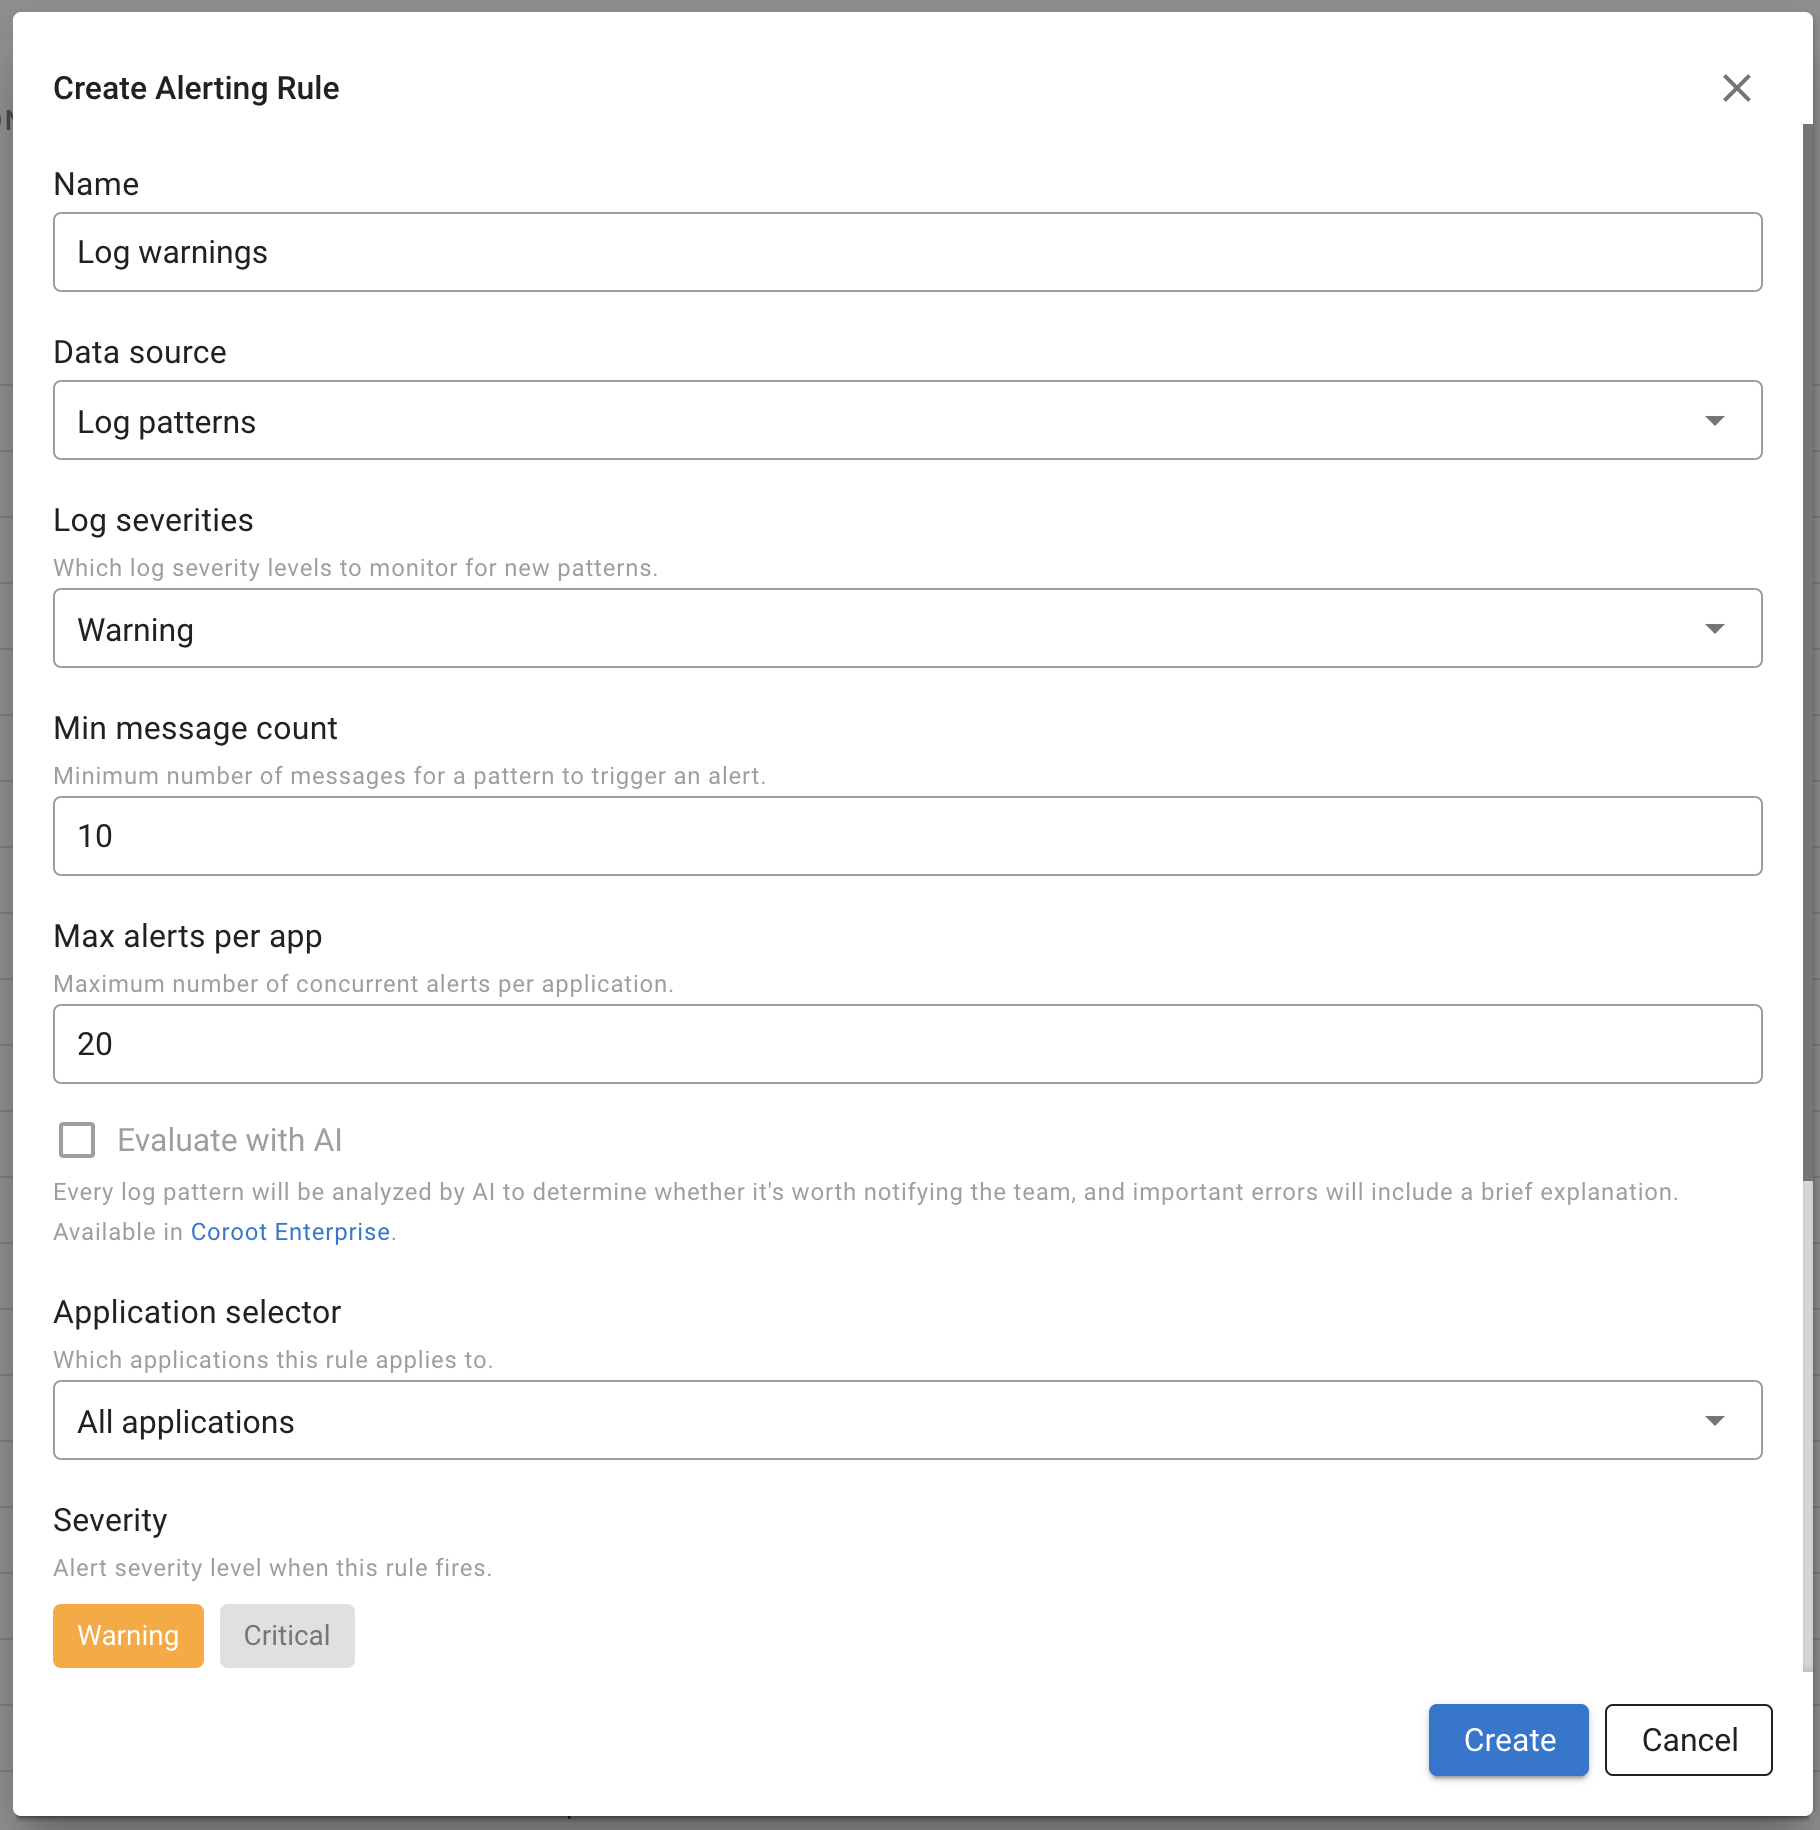
Each rule has the following settings:
- Name: A descriptive name for the rule.
- Source: The alert source type (Check, Log patterns, Kubernetes events, or PromQL).
- Application selector: Which applications the rule applies to (all, by category, or specific applications).
- Severity: Warning or Critical.
- For: How long the condition must be true before the alert fires.
- Keep firing for: How long the alert stays active after the condition clears.
Built-in rules
Coroot comes with a set of built-in alerting rules that cover the most common failure modes:
| Rule | Category |
|---|---|
| Low disk space | Storage |
| Storage I/O load | Storage |
| Out of memory kills | Memory |
| Memory pressure | Memory |
| Memory leak | Memory |
| Container CPU utilization | CPU |
| Instance availability | Instances |
| Instance restarts | Instances |
| Network connectivity | Network |
| Network RTT (in-cluster) | Network |
| Network RTT (external) | Network |
| Network RTT (cross-cluster) | Network |
| Network TCP connection failures | Network |
| DNS latency | DNS |
| DNS server errors | DNS |
| DNS NXDOMAIN errors | DNS |
| Postgres availability | Database |
| Postgres latency | Database |
| Postgres replication lag | Database |
| Postgres connections | Database |
| MySQL availability | Database |
| MySQL replication lag | Database |
| MySQL replication status | Database |
| MySQL connections | Database |
| Redis availability | Database |
| Redis latency | Database |
| MongoDB availability | Database |
| MongoDB replication lag | Database |
| Memcached availability | Database |
| JVM availability | Runtime |
| JVM safepoint time | Runtime |
| .NET availability | Runtime |
| Python GIL waiting time | Runtime |
| Node.js event loop blocked time | Runtime |
| Log errors | Logs |
| Kubernetes events | Kubernetes |
Built-in rules can be disabled individually but not deleted. You can also create custom rules to supplement them.
To disable all built-in rules at once, set disableBuiltinAlerts: true in the configuration file.
This disables every built-in rule for all projects on startup. Individual rules can still be re-enabled through the UI or via config overrides.
Managing rules via config file
Alerting rules can also be managed through the configuration file. This is useful for version-controlling your alerting configuration or applying it across environments.
Rules defined in config are shown with a lock icon in the UI and cannot be edited or deleted through the UI. Removing a rule from the config file and restarting Coroot makes it editable again.
Config rules use a patch model for built-in rules: only the fields you specify are overridden, and unset fields
keep their current values (whether from built-in defaults or previous UI edits).
For custom rules, you must provide all required fields (name, source).
Every rule in config requires an explicit id:
- For built-in rules, use the existing rule ID (e.g.,
storage-space,memory-pressure). The ID is shown in the rule detail dialog. - For custom rules, choose any unique ID.
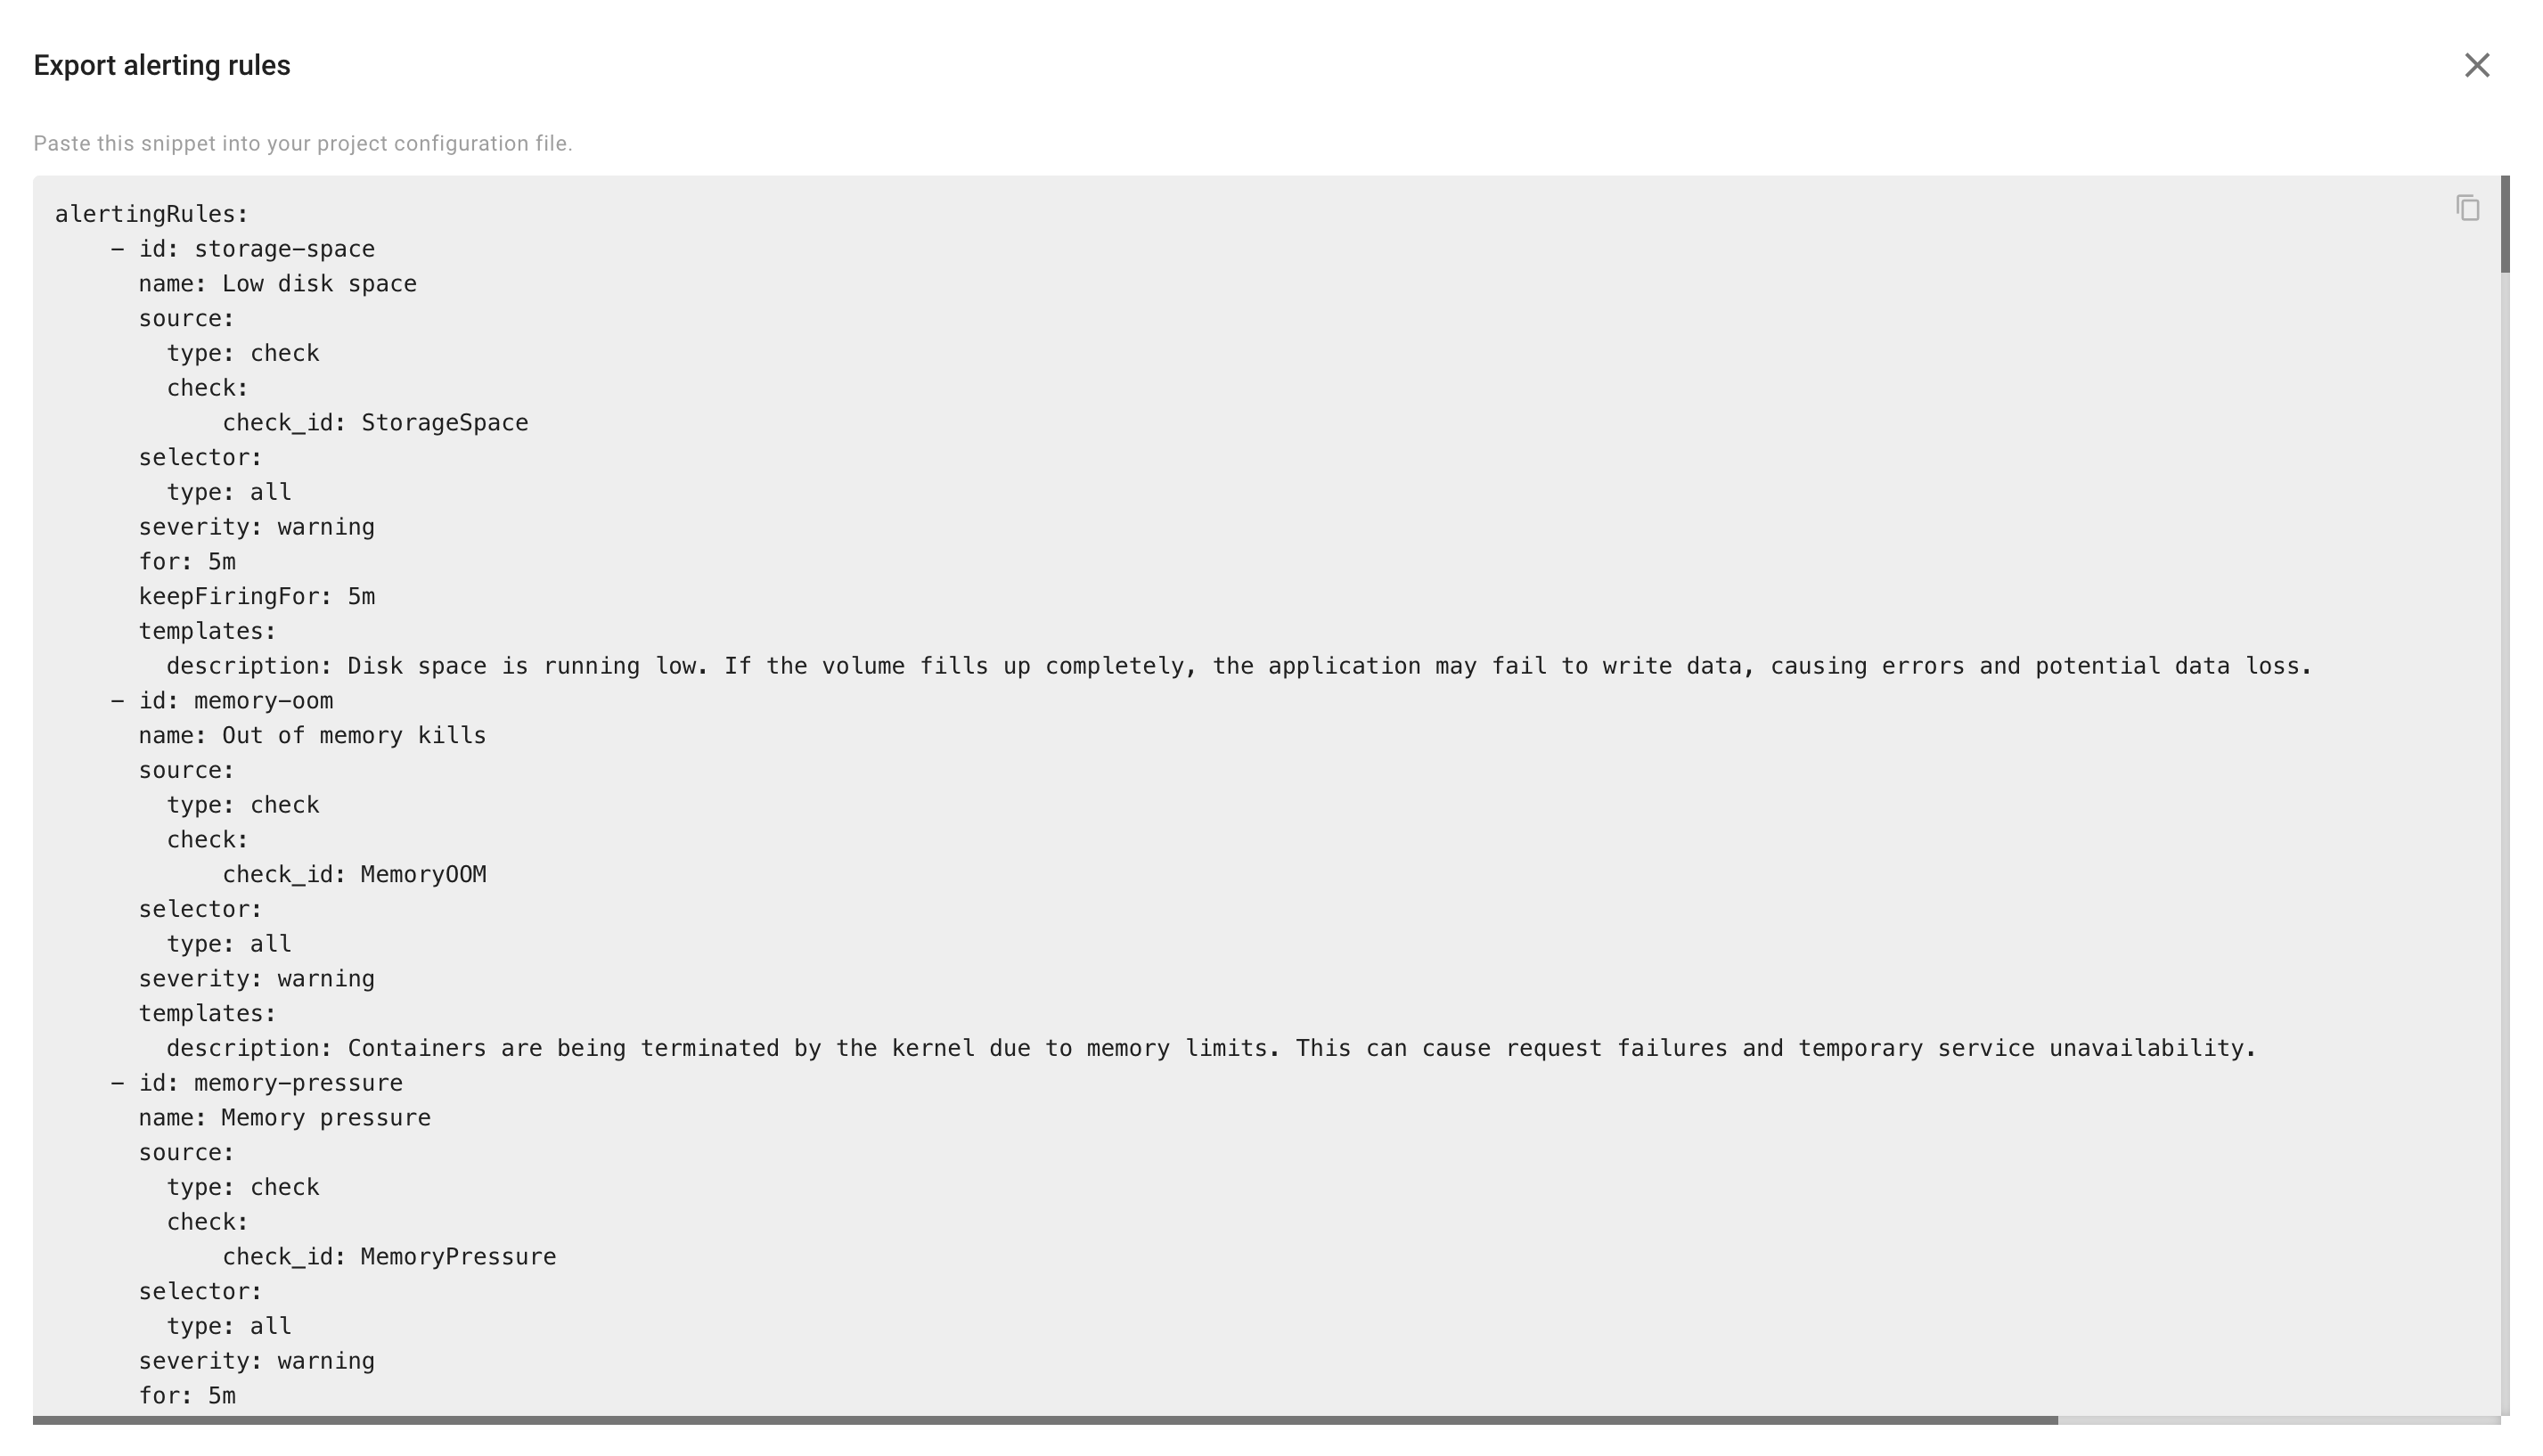
To get a ready-to-use config snippet for all current rules, click the Export button on the Alerting Rules page. You can then paste it into your config file and adjust as needed.
projects:
  - name: production
    alertingRules:
      # Override severity on a built-in rule
      - id: storage-space
        severity: critical
        templates:
          description: "Disk space critically low"
      # Disable a built-in rule
      - id: memory-pressure
        enabled: false
      # Custom PromQL rule
      - id: custom-uptime
        name: "Instance uptime"
        source:
          type: promql
          promql:
            expression: "up == 0"
        severity: warning
        templates:
          summary: "Instance {{.instance}} is down"
See the Configuration page for the full alertingRules schema.
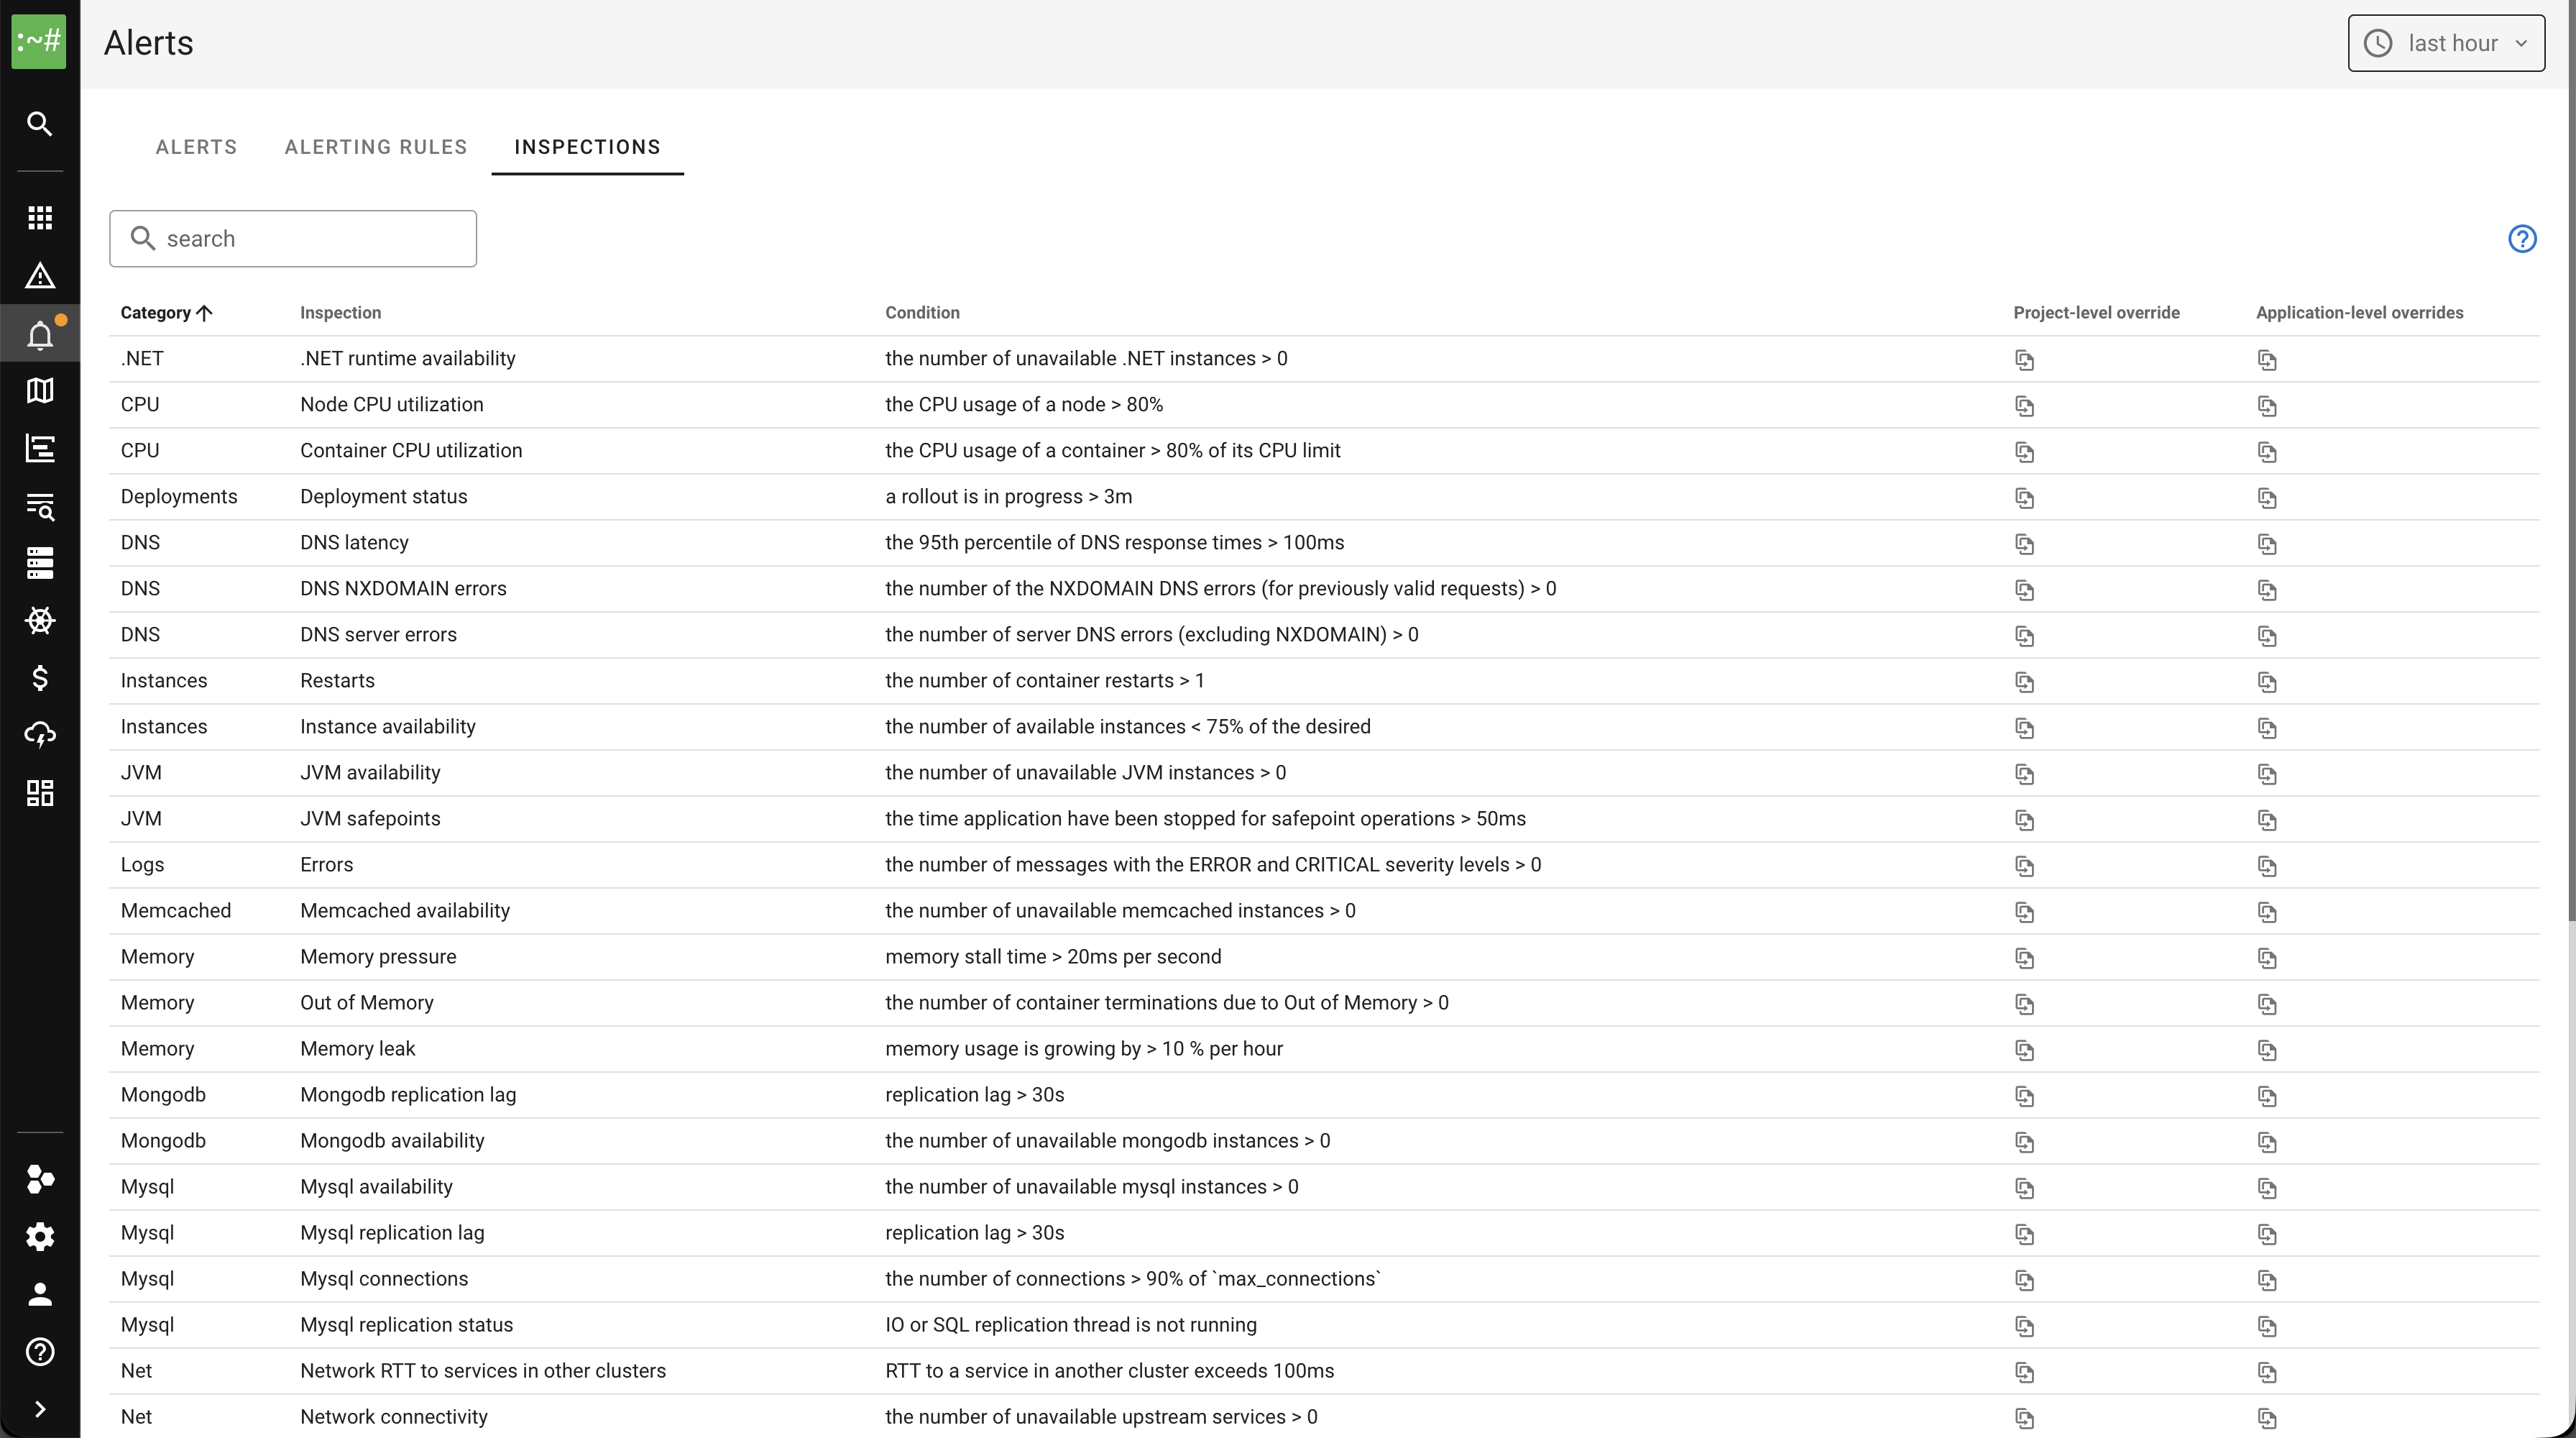
Inspections
The Inspections tab shows the full list of inspections with their conditions and thresholds. You can override thresholds at the project level or per application.
Alert details
Click on any alert to view its details.
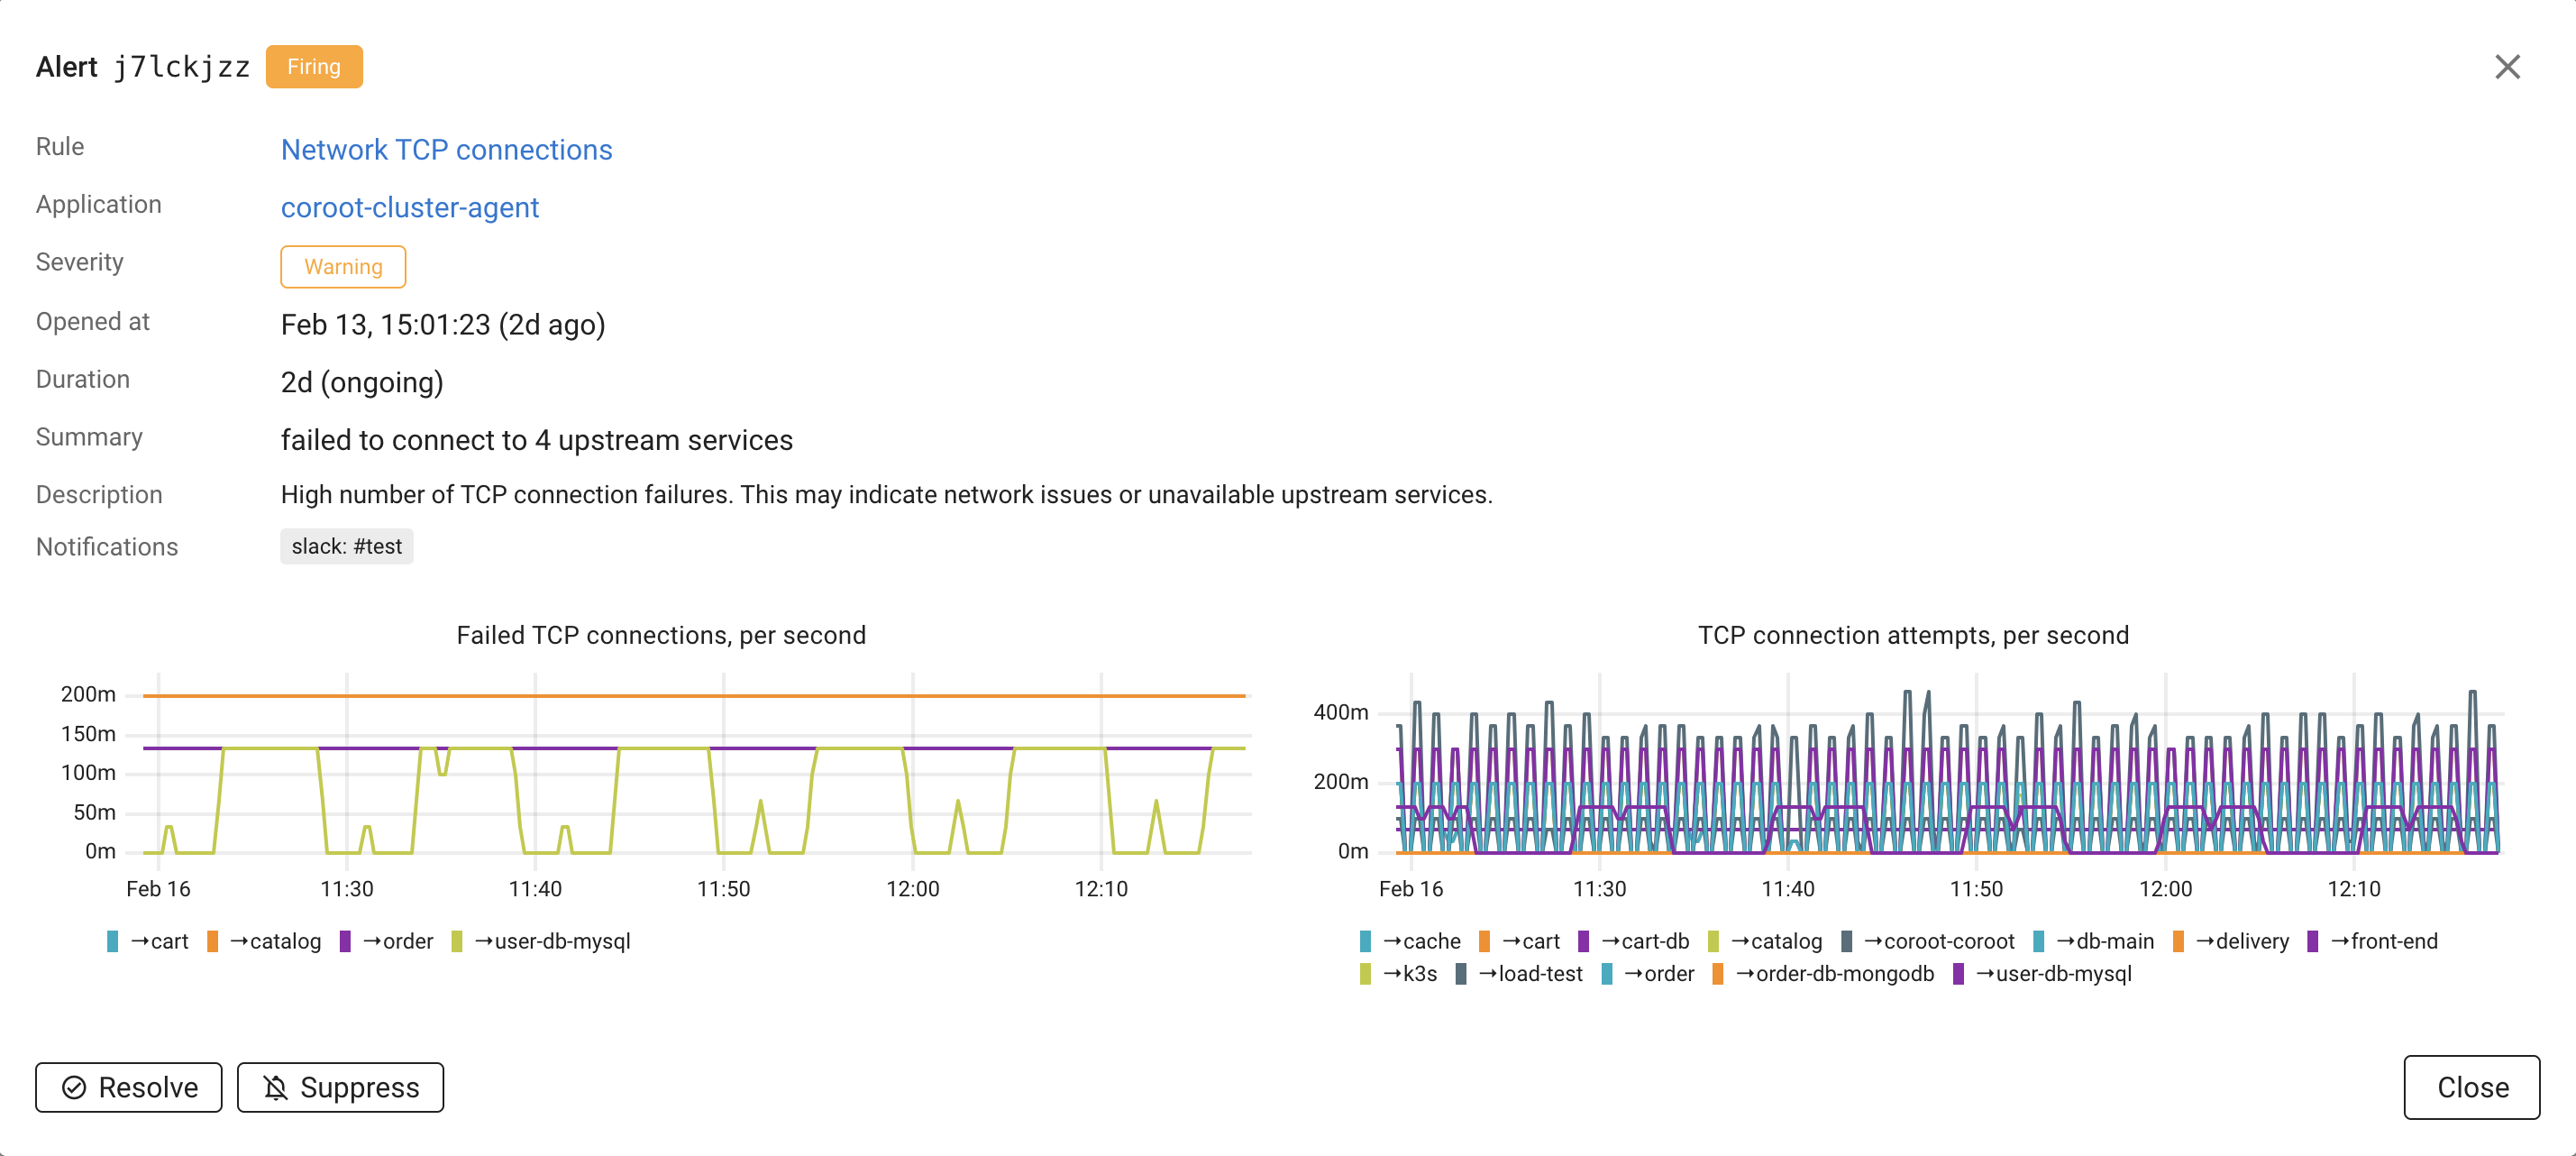
The alert detail dialog shows:
- Rule: The alerting rule that triggered the alert, with a link to the rule configuration.
- Application: The affected application, with a link to the application page.
- Severity: Warning or Critical.
- Opened at: When the alert was first triggered.
- Duration: How long the alert has been active.
- Summary: A description of what went wrong.
For check-based alerts, the detail view also includes relevant charts and tables from the corresponding inspection report. For example, a CPU utilization alert shows CPU usage charts, and a Postgres availability alert shows the instance status table.
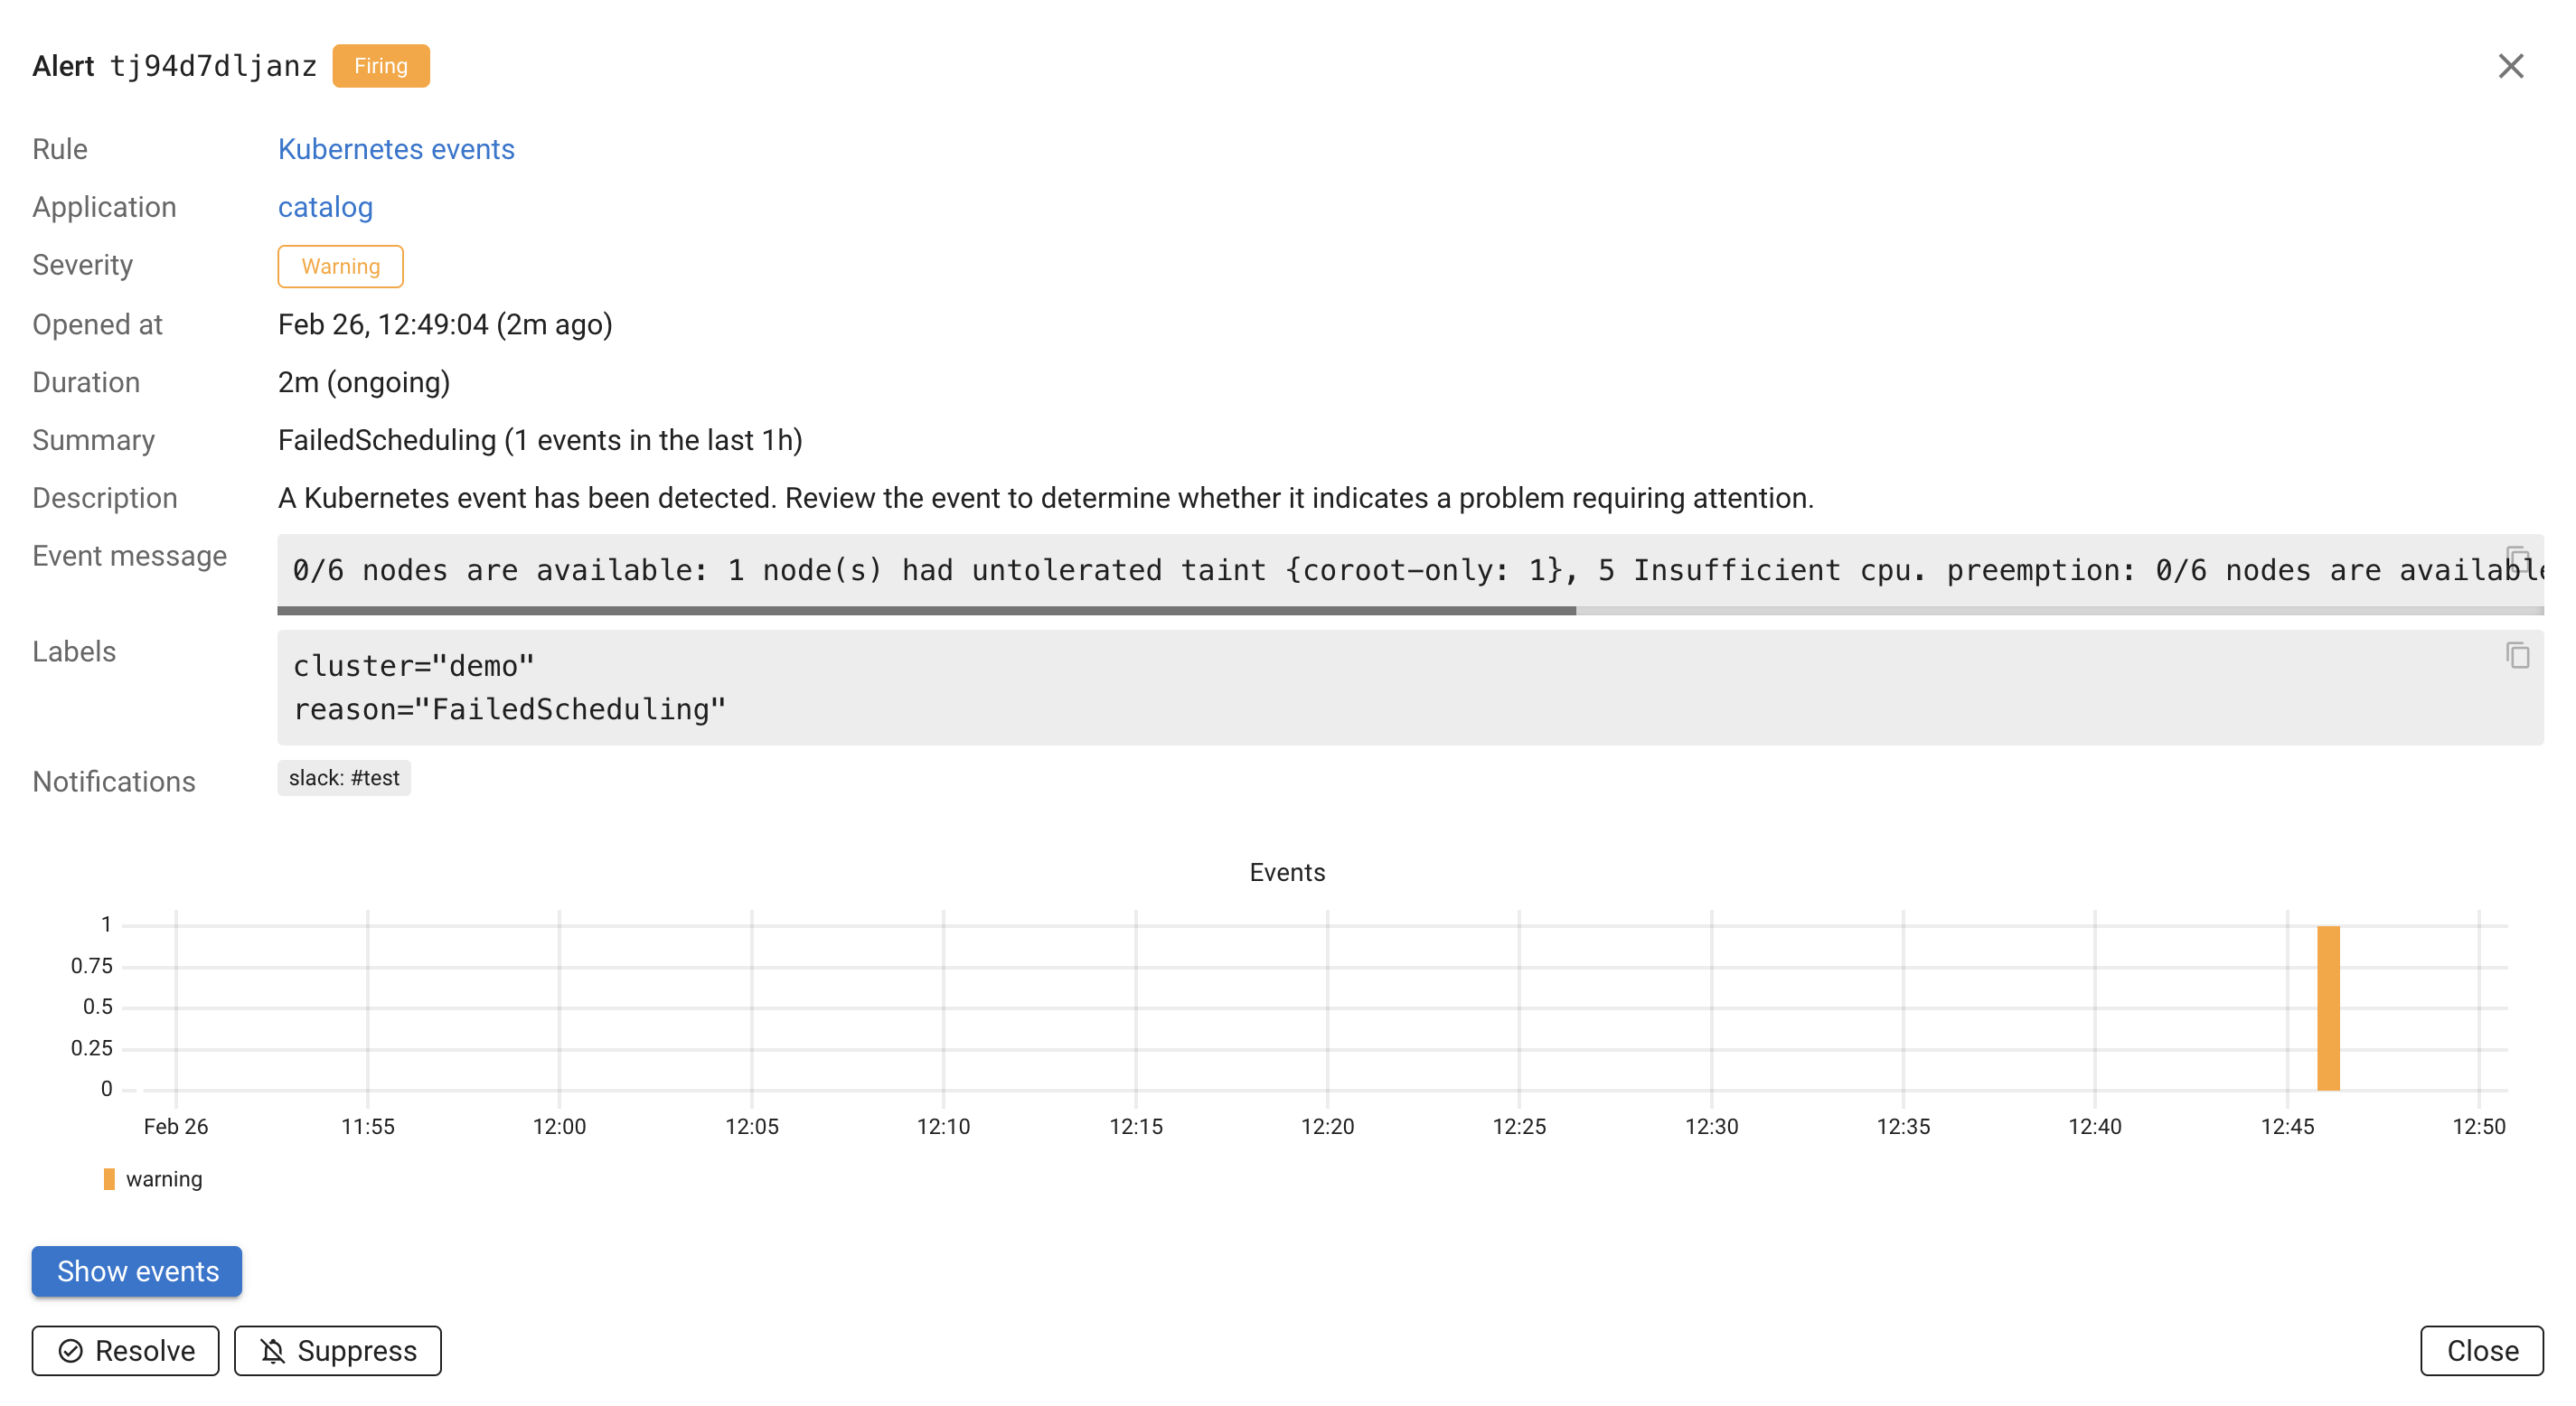
For log-based alerts, the detail view includes a bar chart showing the log pattern's message rate over time and a Show messages button that takes you directly to the raw log messages matching the pattern. If AI evaluation is enabled, the detail view also includes an AI analysis field with the AI's explanation.
For Kubernetes events-based alerts, the detail view shows the event message, labels (cluster, reason, source component), and a chart showing the event frequency over time. A Show events button takes you to the Kubernetes events page filtered to the relevant events.
For PromQL-based alerts, the detail view includes the PromQL query and a chart showing the query result.
Working with alerts
Resolve
Clicking Resolve acknowledges the alert and marks it as resolved for this occurrence. If the condition clears and later reoccurs, Coroot will open a new alert.
Suppress
Clicking Suppress permanently silences the alert. A suppressed alert will not re-fire even if the condition persists. This is useful for known issues that you have decided to accept, such as a noisy log pattern that is not actionable.
To re-enable a suppressed alert, click Reopen in the alert detail dialog.
LLM evaluation
LLM evaluation for alerts is available in Coroot Enterprise Edition only.
Log-based and Kubernetes events-based alerts can be noisy — not every new error pattern or event needs immediate attention. When an AI integration is configured, Coroot can use an LLM to evaluate new log patterns and Kubernetes events and figure out which ones are real problems and which are just noise.
How it works
- A new log pattern or Kubernetes event group appears and the alerting rule has AI evaluation turned on.
- Coroot sends the pattern/event details to the configured LLM.
- The LLM decides if it looks like a real problem (failed connections, crashes, scheduling failures, etc.) or noise (expected retries, debug messages logged at the wrong level, benign warnings).
- If the LLM thinks it's noise, the alert is still created but automatically suppressed. The explanation is saved in the alert details so you can see why.
- If the LLM thinks it's a real issue, the alert fires normally and notifications go out.
Reviewing AI-suppressed alerts
AI-suppressed alerts show up in the alert list with a Suppressed badge and "AI" as the suppressor. You can read the LLM's reasoning in the alert detail dialog under AI analysis.
If you disagree, click Reopen. The alert becomes a normal firing alert and won't be re-suppressed by AI, even if the same pattern comes back later.
Enabling LLM evaluation
LLM evaluation is controlled per alerting rule. The built-in Log errors and Kubernetes events rules have it enabled by default. For custom rules, toggle it in the rule settings.
This requires an AI integration to be configured under Settings → AI.
Notification integrations
Coroot can send alert notifications through the following integrations:
To configure notification integrations, go to Project Settings → Integrations.
Notification routing
Coroot routes alert notifications based on application categories. Each category has independent notification settings for three event types:
- Incidents (SLO violations)
- Deployments
- Alerts (check-based, log-based, Kubernetes events-based, and PromQL-based)
For each event type, you can enable or disable individual integrations per category.
For example, you might send alerts for production applications to Slack and PagerDuty,
while staging applications only notify a Slack channel.
For Slack, each category can also override the default channel. If no channel is specified, the project's Default Slack channel is used.
To configure notification routing:
- Go to Project Settings → Applications
- Select a category
- Toggle integrations on or off for Incidents, Deployments, and Alerts independently
When an alert fires, Coroot determines the application's category and checks the category's notification settings. If notifications are disabled for that category and event type, no notification is sent.
See Application Categories for more details on how to assign applications to categories.