Prometheus
Coroot uses Prometheus to store metrics. Alternatively, you can configure ClickHouse as your metrics storage backend instead of Prometheus.
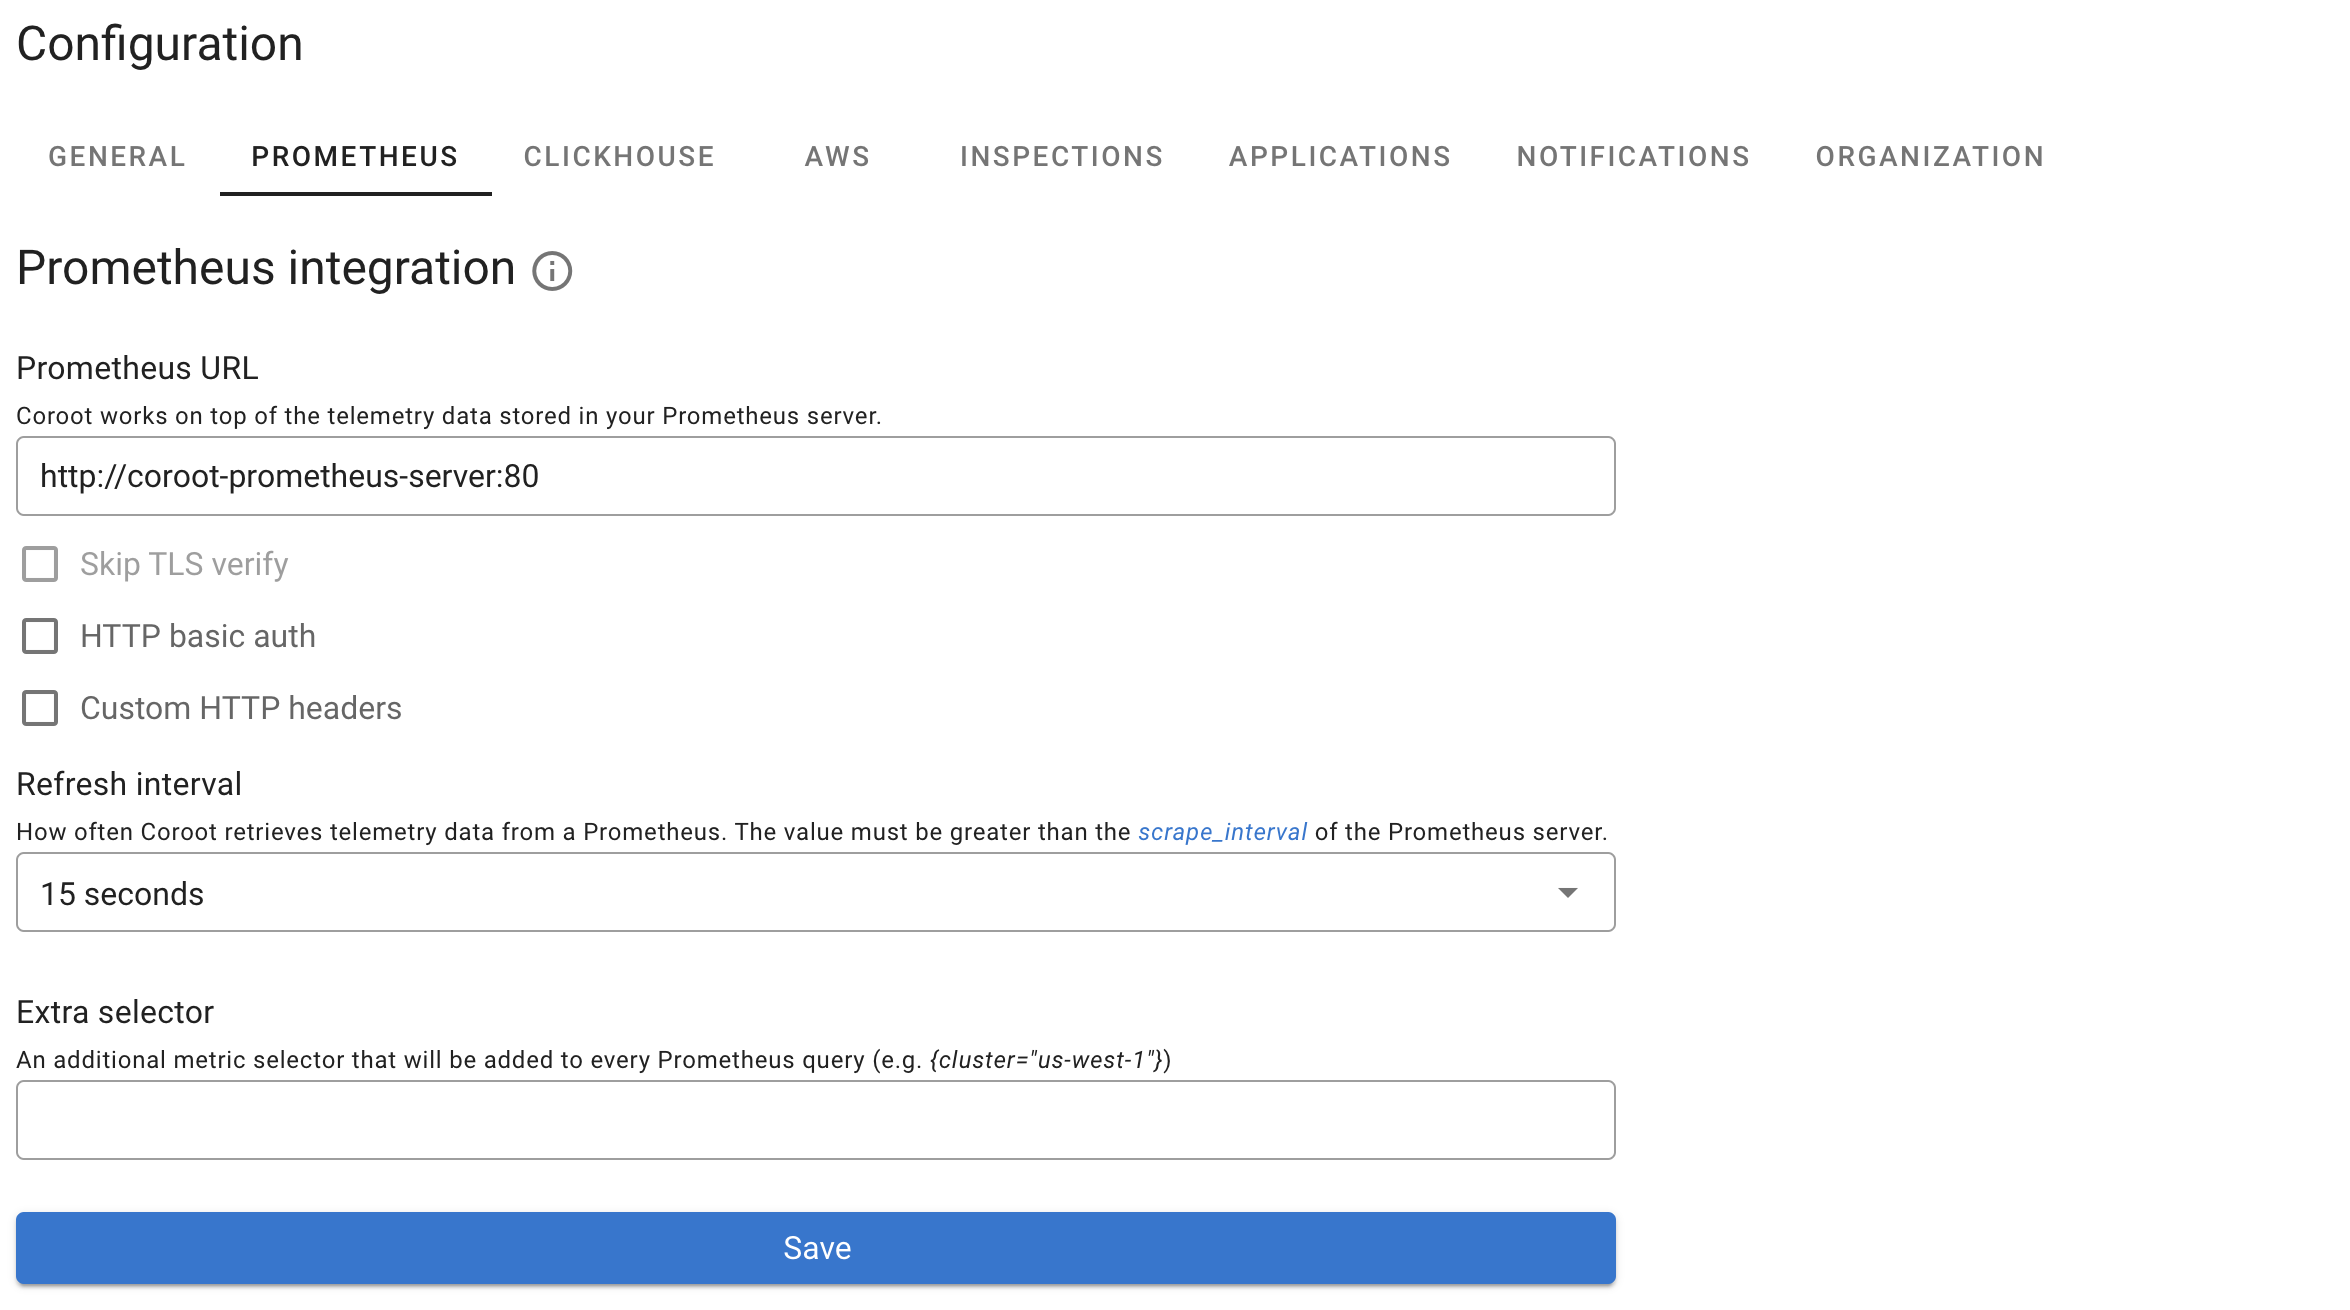
To integrate Coroot with Prometheus, go to the Project Settings, click on Prometheus, and define the Prometheus address and credentials as shown in the following example:

VictoriaMetrics
Coroot fully supports VictoriaMetrics as a drop-in replacement for Prometheus. In clustered mode, you may need separate
URLs for metric ingestion and queries. To configure this, set GLOBAL_PROMETHEUS_REMOTE_WRITE_URL to point to vminsert for ingestion,
while keeping GLOBAL_PROMETHEUS_URL directed to vmselect for queries.
ClickHouse as metrics storage
Coroot can store metrics directly in ClickHouse instead of Prometheus. When enabled, ClickHouse becomes the primary metrics backend, while PromQL remains available for dashboard configuration.
To enable this option, set the flag --global-prometheus-use-clickhouse (or environment variable GLOBAL_PROMETHEUS_USE_CLICKHOUSE), or simply check "Use ClickHouse for metrics storage" on the Prometheus settings page.
Multi-tenancy mode
Coroot supports a multi-tenancy mode, allowing a single Prometheus server to store metrics for multiple projects (or clusters).
In this mode, all Coroot agents (both coroot-node-agent and coroot-cluster-agent) are configured to push metrics
to Coroot using the Prometheus Remote Write Protocol.
Coroot automatically adds the coroot_project_id label to each metric and uses {coroot_project_id="XXXX"} as an additional
selector when querying metrics for a specific project.
Metric cache
For faster access, Coroot maintains its own on-disk metric cache, continuously retrieving metrics from Prometheus. As a result, Coroot treats the time series database as a source for updating its cache. This allows you to configure Prometheus with a shorter retention period, such as a few hours.
The retention of Coroot's metric cache can be configured using the --cache-ttl CLI argument or the CACHE_TTL environment variable.
Check the Configuration section for more details.