Go profiling
Coroot supports two complementary approaches to profiling Go applications:
- Automatic heap profiling via
coroot-node-agent: collects memory profiles by reading Go runtime internals - Pprof scraping via
coroot-cluster-agent: requires exposing pprof endpoints, provides additional profile types (CPU, blocking, mutex)
Automatic heap profiling (node-agent)
Coroot-node-agent collects memory profiles from Go processes by reading the Go runtime's internal
memory profiling data directly from /proc/<pid>/mem. This is the same data that Go's runtime.MemProfile()
returns, but read externally without any cooperation from the target process.
How it works
- Detection: The agent detects Go binaries by checking for the
.go.buildinfoELF section (zero-cost check). - Symbol lookup: It locates the
runtime.mbucketssymbol address by streaming through the ELF symbol table without loading it into memory. Stripped binaries (missing.symtab) are silently skipped. - Collection: Every 60 seconds, the agent reads the memory profile bucket linked list from
/proc/<pid>/mem. Each bucket contains an allocation size, a stack trace (as program counter addresses), and counters (allocs, frees, alloc_bytes, free_bytes). - Symbol resolution: Stack trace addresses are resolved to function names using the same symbol cache that the eBPF CPU profiler uses, with no additional ELF parsing.
- Delta computation: Cumulative allocation counters are converted to per-interval deltas using the bucket address as a stable key.
- Upload: Profiles are uploaded to Coroot in pprof format.
Supported profile types
| Profile | Description |
|---|---|
| Go Memory (alloc_space) | Bytes allocated per stack trace (delta per collection interval) |
| Go Memory (alloc_objects) | Object count per stack trace (delta per collection interval) |
| Go Memory (inuse_space) | Bytes currently in use per stack trace (allocs - frees) |
| Go Memory (inuse_objects) | Objects currently in use per stack trace (allocs - frees) |
Safety and overhead
Go's built-in memory profiler (runtime.MemProfileRate) is production-ready and has been enabled by default
in every Go release. It uses statistical sampling (1 sample per ~512KB allocated) with negligible overhead.
This is the same profiling infrastructure that powers go tool pprof and is routinely used in production
at scale by the Go community.
The agent reads this profiling data from /proc/<pid>/mem, which is a read-only operation. The target
process is not suspended, signaled, or modified in any way.
Configuration
The --go-heap-profiler flag (or GO_HEAP_PROFILER environment variable) controls the behavior:
| Mode | Description |
|---|---|
disabled | Go heap profiling is off |
enabled (default) | Collect profiles from Go processes that already have memory profiling active (runtime.MemProfileRate > 0) |
force | Additionally enable memory profiling in Go processes where the linker disabled it (writes MemProfileRate=524288 to process memory) |
In the Coroot custom resource:
apiVersion: coroot.com/v1
kind: Coroot
spec:
  nodeAgent:
    env:
      - name: GO_HEAP_PROFILER
        value: "force"
When force mode is needed
The Go linker automatically disables memory profiling (sets runtime.MemProfileRate = 0) in binaries
that don't reference runtime.MemProfile, for example applications that don't import net/http/pprof
or runtime/pprof. In enabled mode, these applications are silently skipped.
In force mode, the agent restores the default sampling rate by writing a single integer value (524288)
to the runtime.MemProfileRate variable at a fixed address in the process's data segment via /proc/<pid>/mem.
This is the same default value that Go uses when memory profiling is not disabled by the linker.
The runtime checks this variable on each allocation, so the change takes effect immediately.
The overhead is the same as the Go default: approximately 1 sample per 512KB allocated, negligible for most workloads.
Metrics
In addition to profiles, the agent exports allocation rate metrics as Prometheus counters:
| Metric | Type | Description |
|---|---|---|
container_go_alloc_bytes_total | Counter | Total bytes allocated by a Go application |
container_go_alloc_objects_total | Counter | Total objects allocated by a Go application |
These metrics are derived from the same memory profiling data and provide time-series visibility into allocation rates. Coroot uses them to display allocation rate charts alongside the flamegraph profiles.
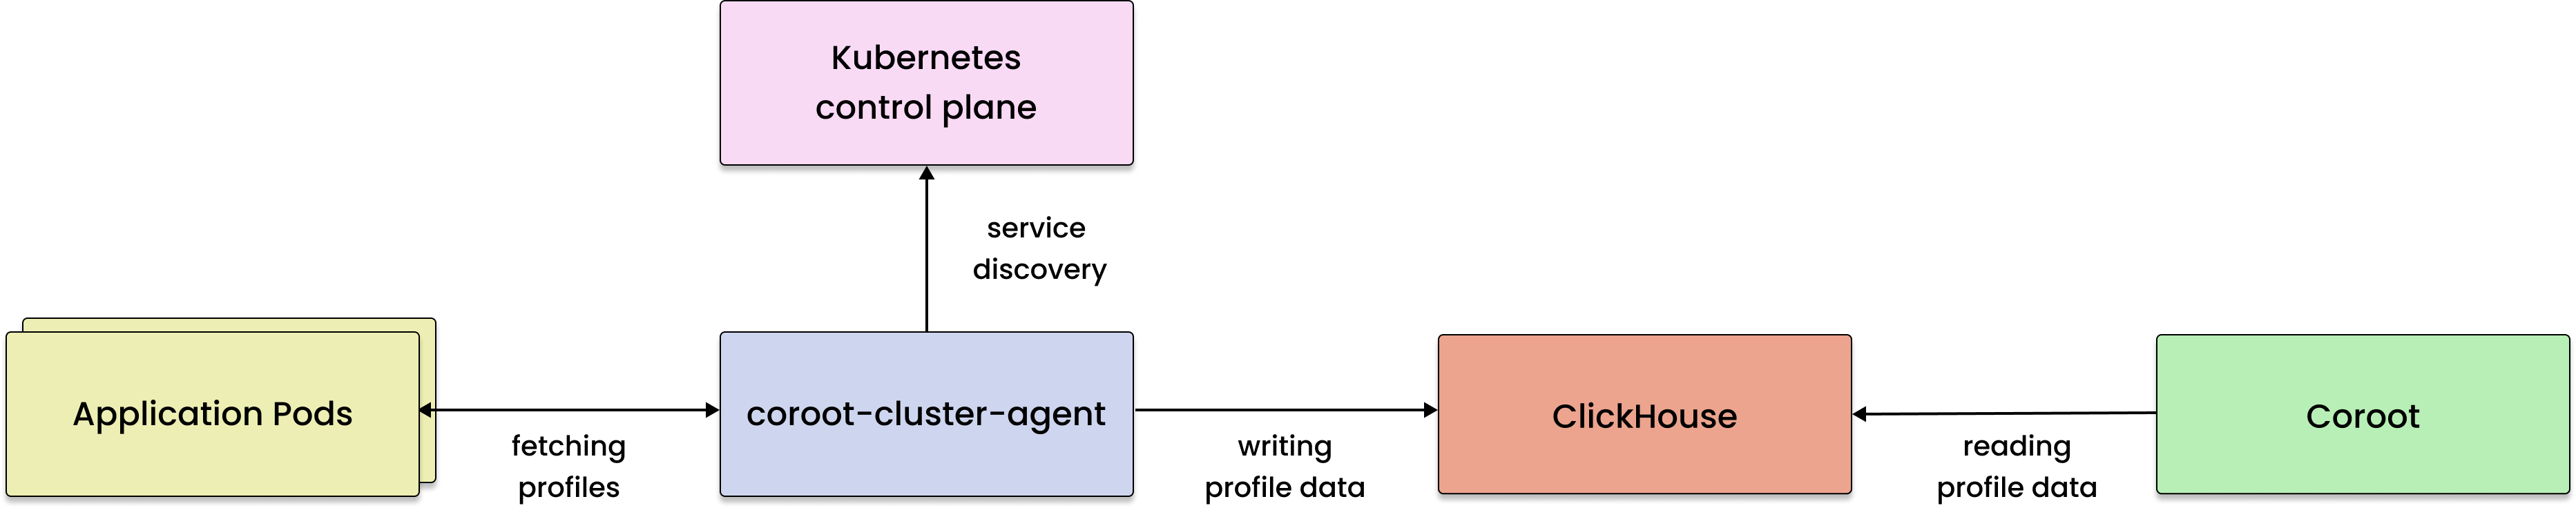
Pprof scraping (cluster-agent)
The Go standard library includes the pprof package, enabling developers to expose profiling data of their Go applications.
Coroot-cluster-agent automatically discovers and periodically retrieves profiles from Golang applications.
Supported profile types
- CPU profile is useful to identify functions consuming most CPU time.
- Memory profile shows the amount of memory held and allocated by particular functions. This data is quite useful for troubleshooting memory leaks and GC (Garbage Collection) pressure.
- Blocking profile helps identify and analyze goroutines that are blocked, waiting for resources or synchronization, including unbuffered channels and locks.
- Mutex profile allows to identify areas where goroutines contend for access to shared resources protected by mutexes.
Enabling
To enable collecting profiles of a Go application, you need to expose pprof endpoints
and allow Coroot to discover the application pods.
Step 1: exposing pprof endpoints
Register /debug/pprof/* handlers in http.DefaultServeMux:
import _ "net/http/pprof"
You can register /debug/pprof/* handlers to your own http.ServeMux:
var mux *http.ServeMux
mux.Handle("/debug/pprof/", http.DefaultServeMux)
Or, to gorilla/mux:
var router *mux.Router
router.PathPrefix("/debug/pprof").Handler(http.DefaultServeMux)
Step 2: annotating application Pods
Coroot-cluster-agent automatically discovers and fetches profiles from pods
annotated with coroot.com/profile-scrape and coroot.com/profile-port annotations:
apiVersion: apps/v1
kind: Deployment
metadata:
  name: catalog
  labels:
    name: catalog
spec:
  replicas: 2
  selector:
    matchLabels:
      name: catalog
  template:
    metadata:
      annotations:
        coroot.com/profile-scrape: "true"
        coroot.com/profile-port: "8080"
...