Overview
Coroot's Continuous Profiling allows you easily identify and analyze any unexpected spikes in CPU and memory usage down to the precise line of code. This allows you to quickly pinpoint and resolve performance bottlenecks, optimize your application's resource utilization, and deliver a faster and more reliable user experience.
There are two ways to obtain profiling data:
- Kernel-level eBPF profilers can capture stack traces for the entire system directly from the kernel.
- User-space profilers like pprof, async-profiler, rbspy, py-spy, pprof-rs, dotnet-trace, etc. These profilers operate at the user-space level and provide insights into the behavior of specific applications or processes.
eBPF-based profiling
eBPF-based profiling relies on the ability to attach eBPF programs to various events in the kernel, allowing for the collection of performance-related data without modifying the source code of the applications being profiled.
Coroot's profiling stack consists of several components:
Coroot-node-agentmonitors running processes, gathers their profiles, and sends the profiles to the Coroot.coroot-cluster-agentgathers profiles from applications and sends them to Coroot.- ClickHouse is used as a database for storing profiling data.
- Coroot queries profiles of a given application and visualizes them as FlameGraphs for analysis.

When you use Helm to install Coroot, all these components are automatically installed and seamlessly integrated with each other.
The eBPF-based approach can only gather CPU profiles. To collect other profile types, such as memory or lock contention, user-space profilers need to be integrated.
Language-specific profiling
- Go profiling —
coroot-cluster-agentautomatically discovers and scrapes pprof endpoints from annotated Go pods. Supports CPU, memory, blocking, and mutex profiles. - Java profiling —
coroot-node-agentdynamically loads async-profiler into HotSpot JVMs. No application changes needed. Supports CPU, memory allocation, and lock contention profiles.
Using profiles
All the available profiles can be accessed through the Profiling tab on the application page.
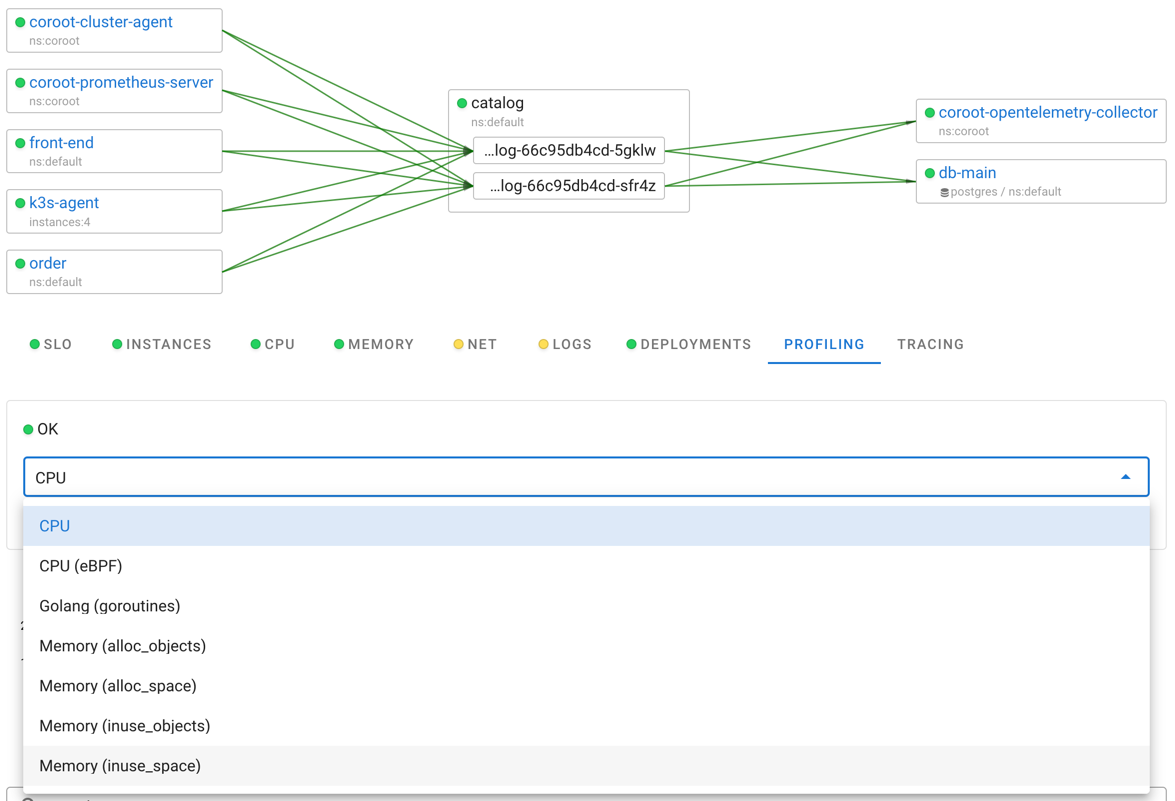
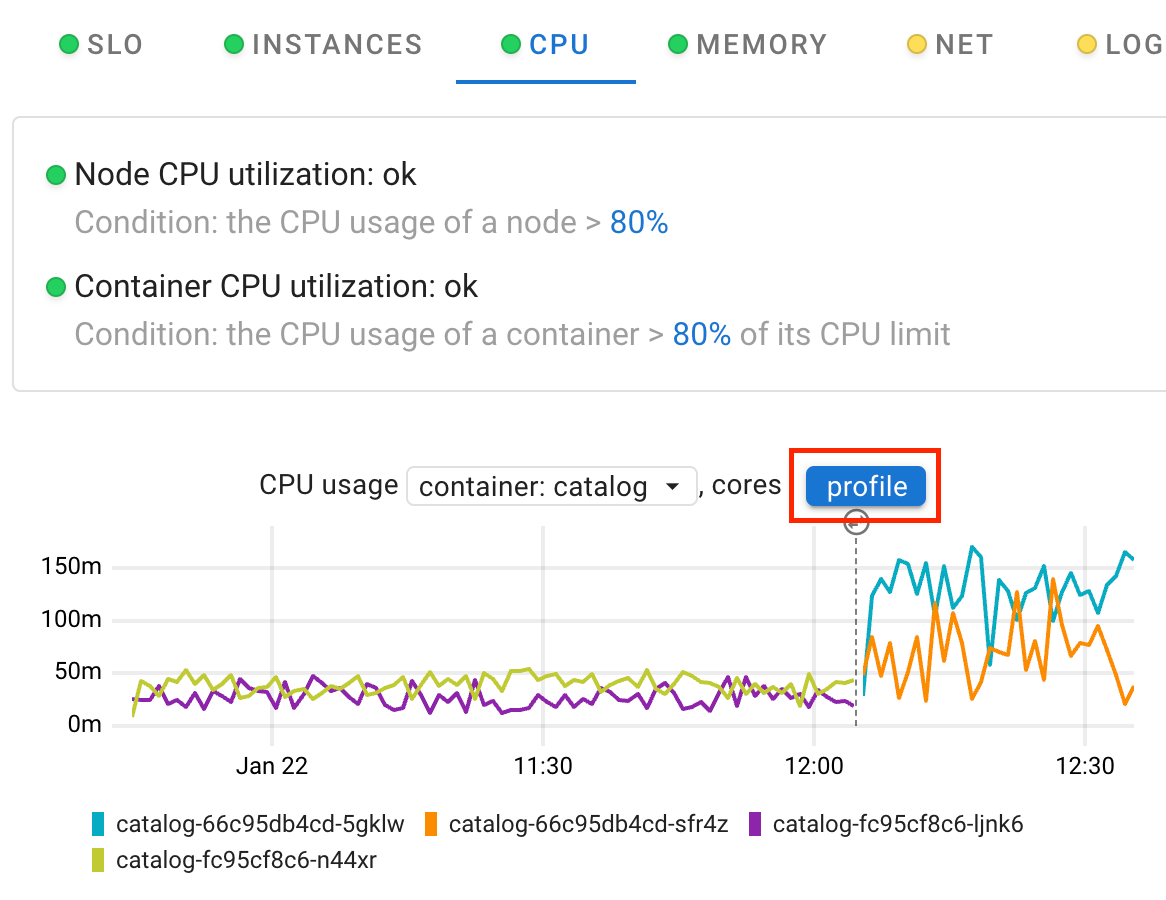
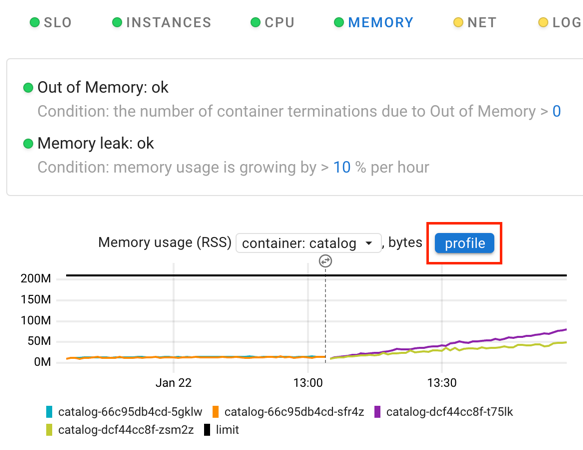
Additionally, the CPU and Memory tabs contain shortcuts to the CPU and memory profiles, respectively.
By default, you see an aggregated FlameGraph for all profiles within the selected time range.
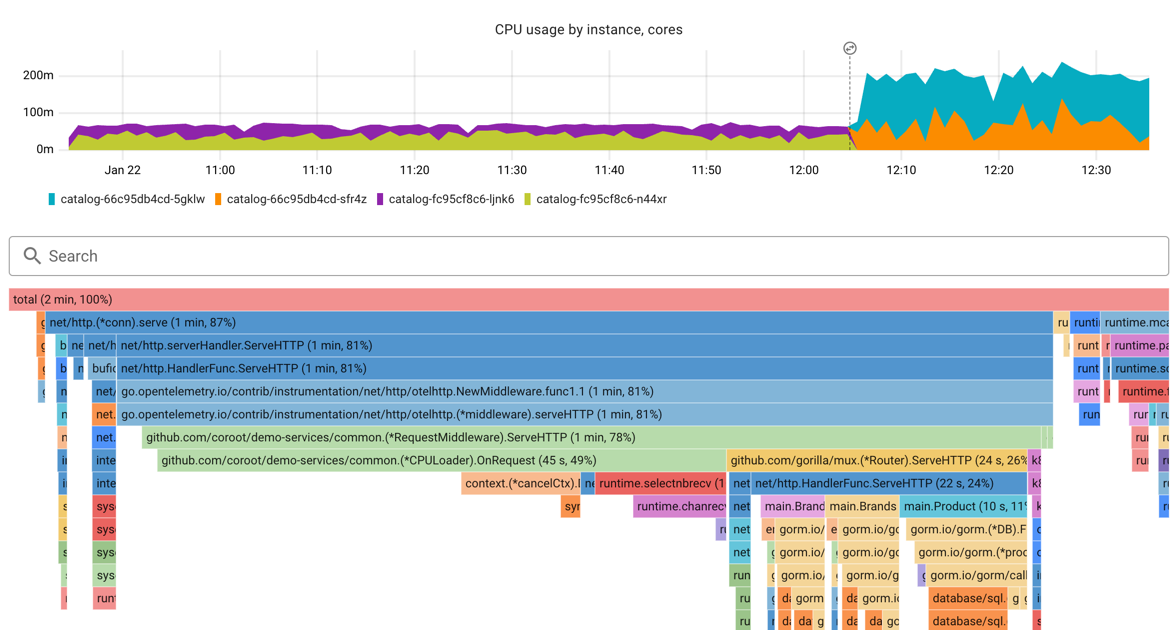
The FlameGraph displays the code hierarchy organized by CPU time consumption, where each frame represents the CPU time consumed by a specific function. A wider frame indicates greater CPU time consumption by that function, and frames underneath represent nested function calls. The color of each frame is determined by the corresponding package name, resulting in functions from the same package sharing the same color.
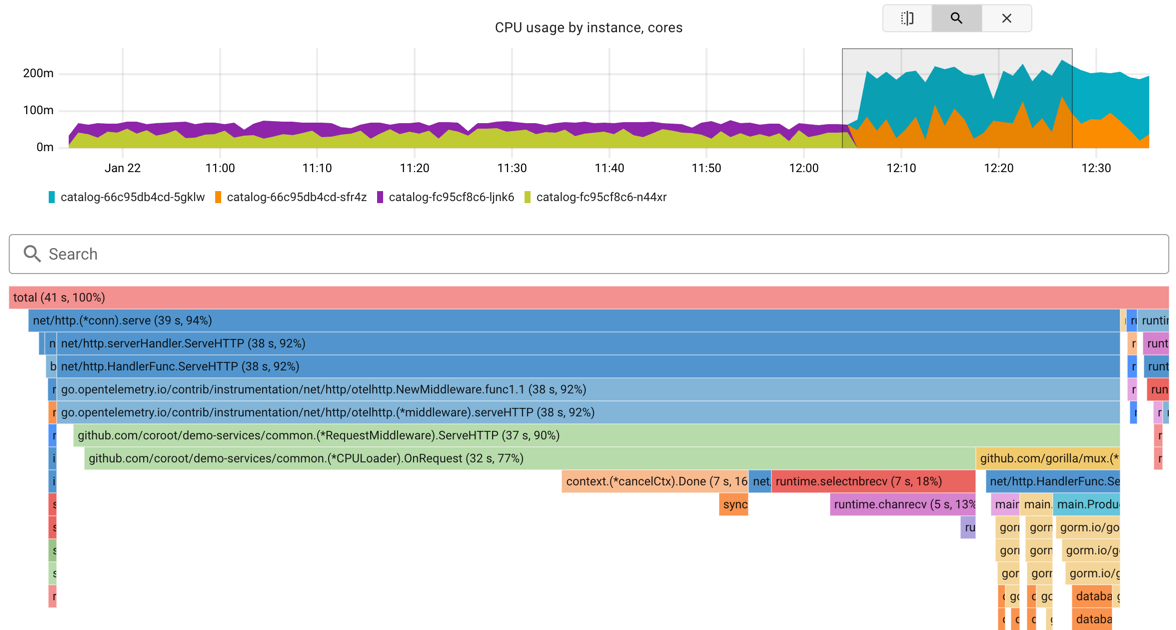
To view the FlameGraph for a specific time sub-range, select a chart area and choose the Zoom mode.
Alternatively, you can opt for the Comparison mode to compare the selected time range with the previous one.
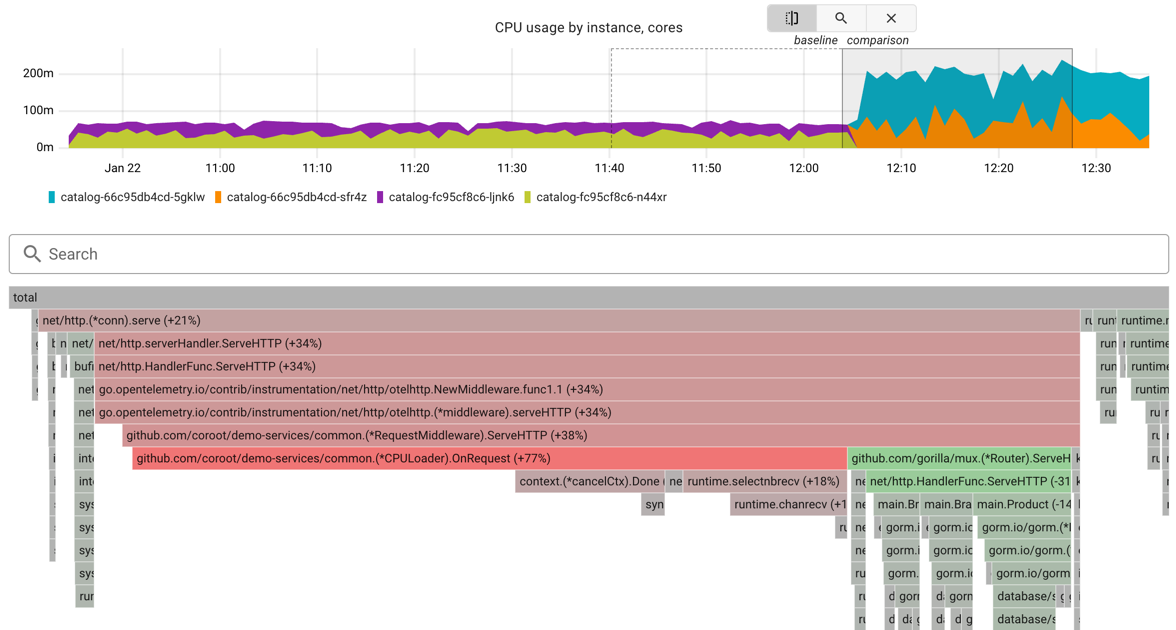
In Comparison mode, functions experiencing degraded performance are colored red, whereas those performing better are colored green. For instance, if a function consumes significantly more CPU time compared to the baseline period, it will be highlighted in a shade of red based on the extent of the excess.