Overview
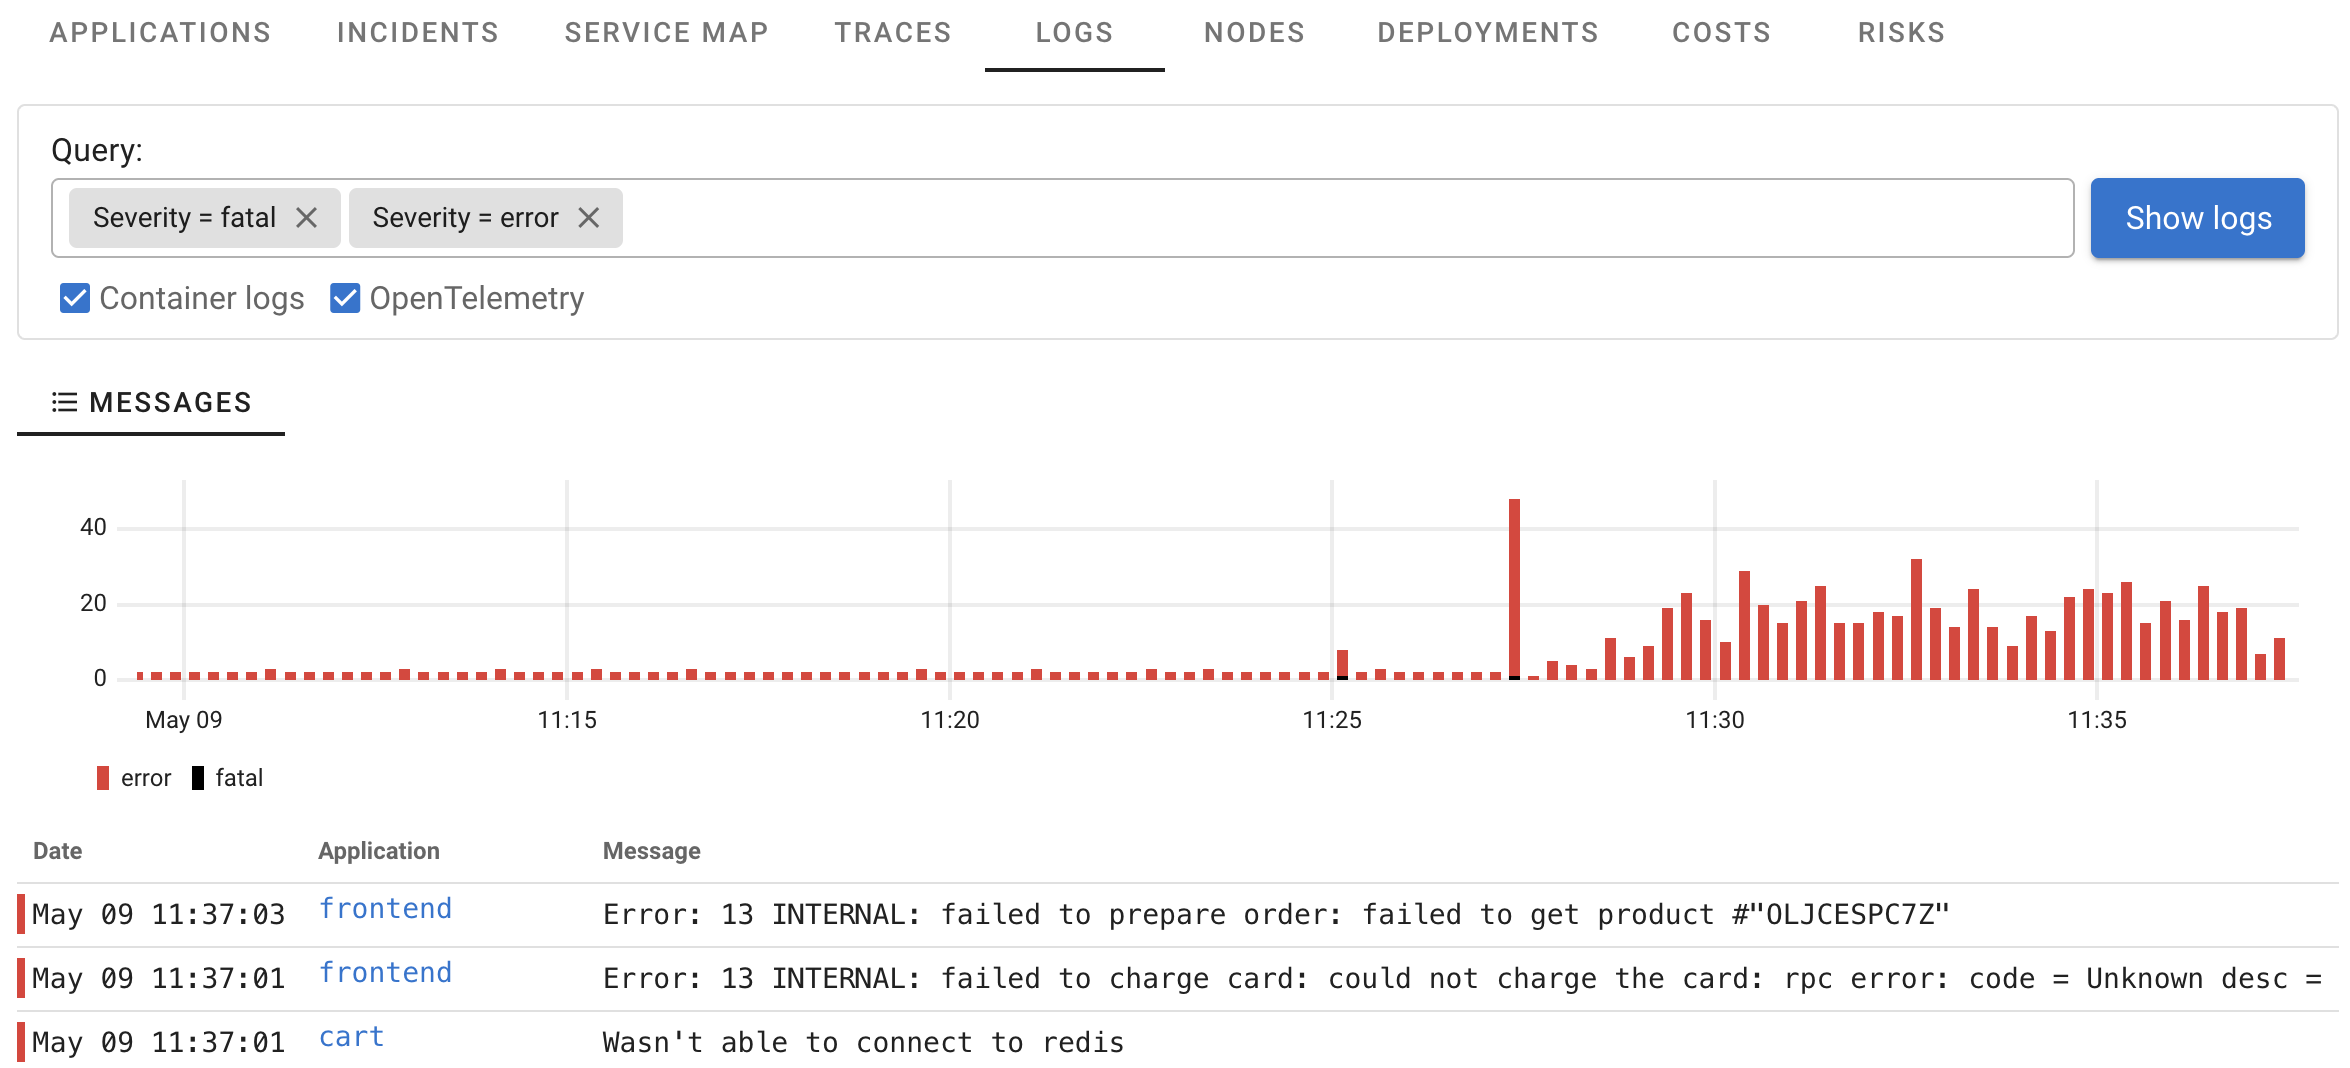
Coroot's Logs monitoring enables you to effortlessly analyze your application logs and correlate them with traces, metrics, and profiles.
Coroot's node-agent automatically discovers and gathers logs from all containers on a node, then transmits them to Coroot. Additionally, it performs low-overhead log analysis right on the node to identify message severities and recurring patterns. This process is seamless and compatible with a wide range of log formats, providing valuable meta-information for quick and easy log analysis.
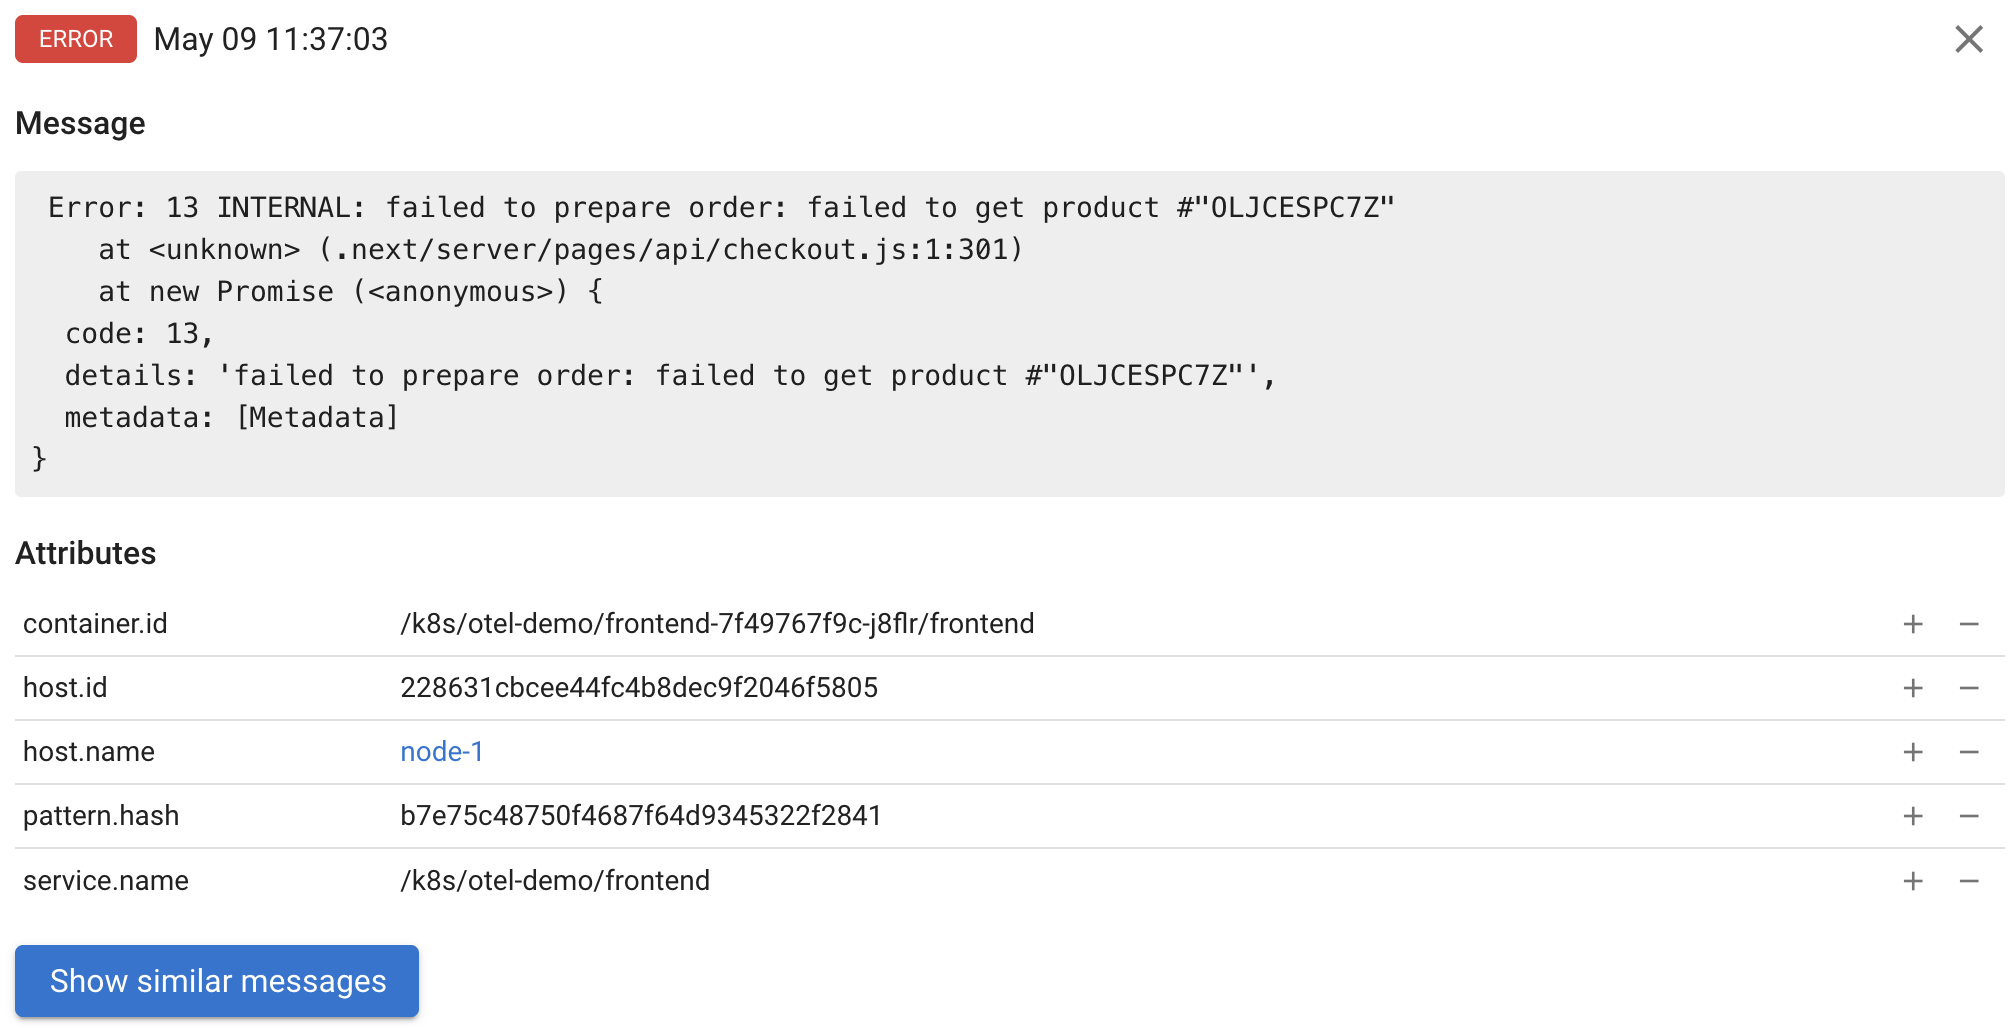
Event details
Clicking on a specific event from the list allows you to access its details, including the full message text, severity, and OpenTelemetry attributes. You can also jump to similar messages that match the same pattern.
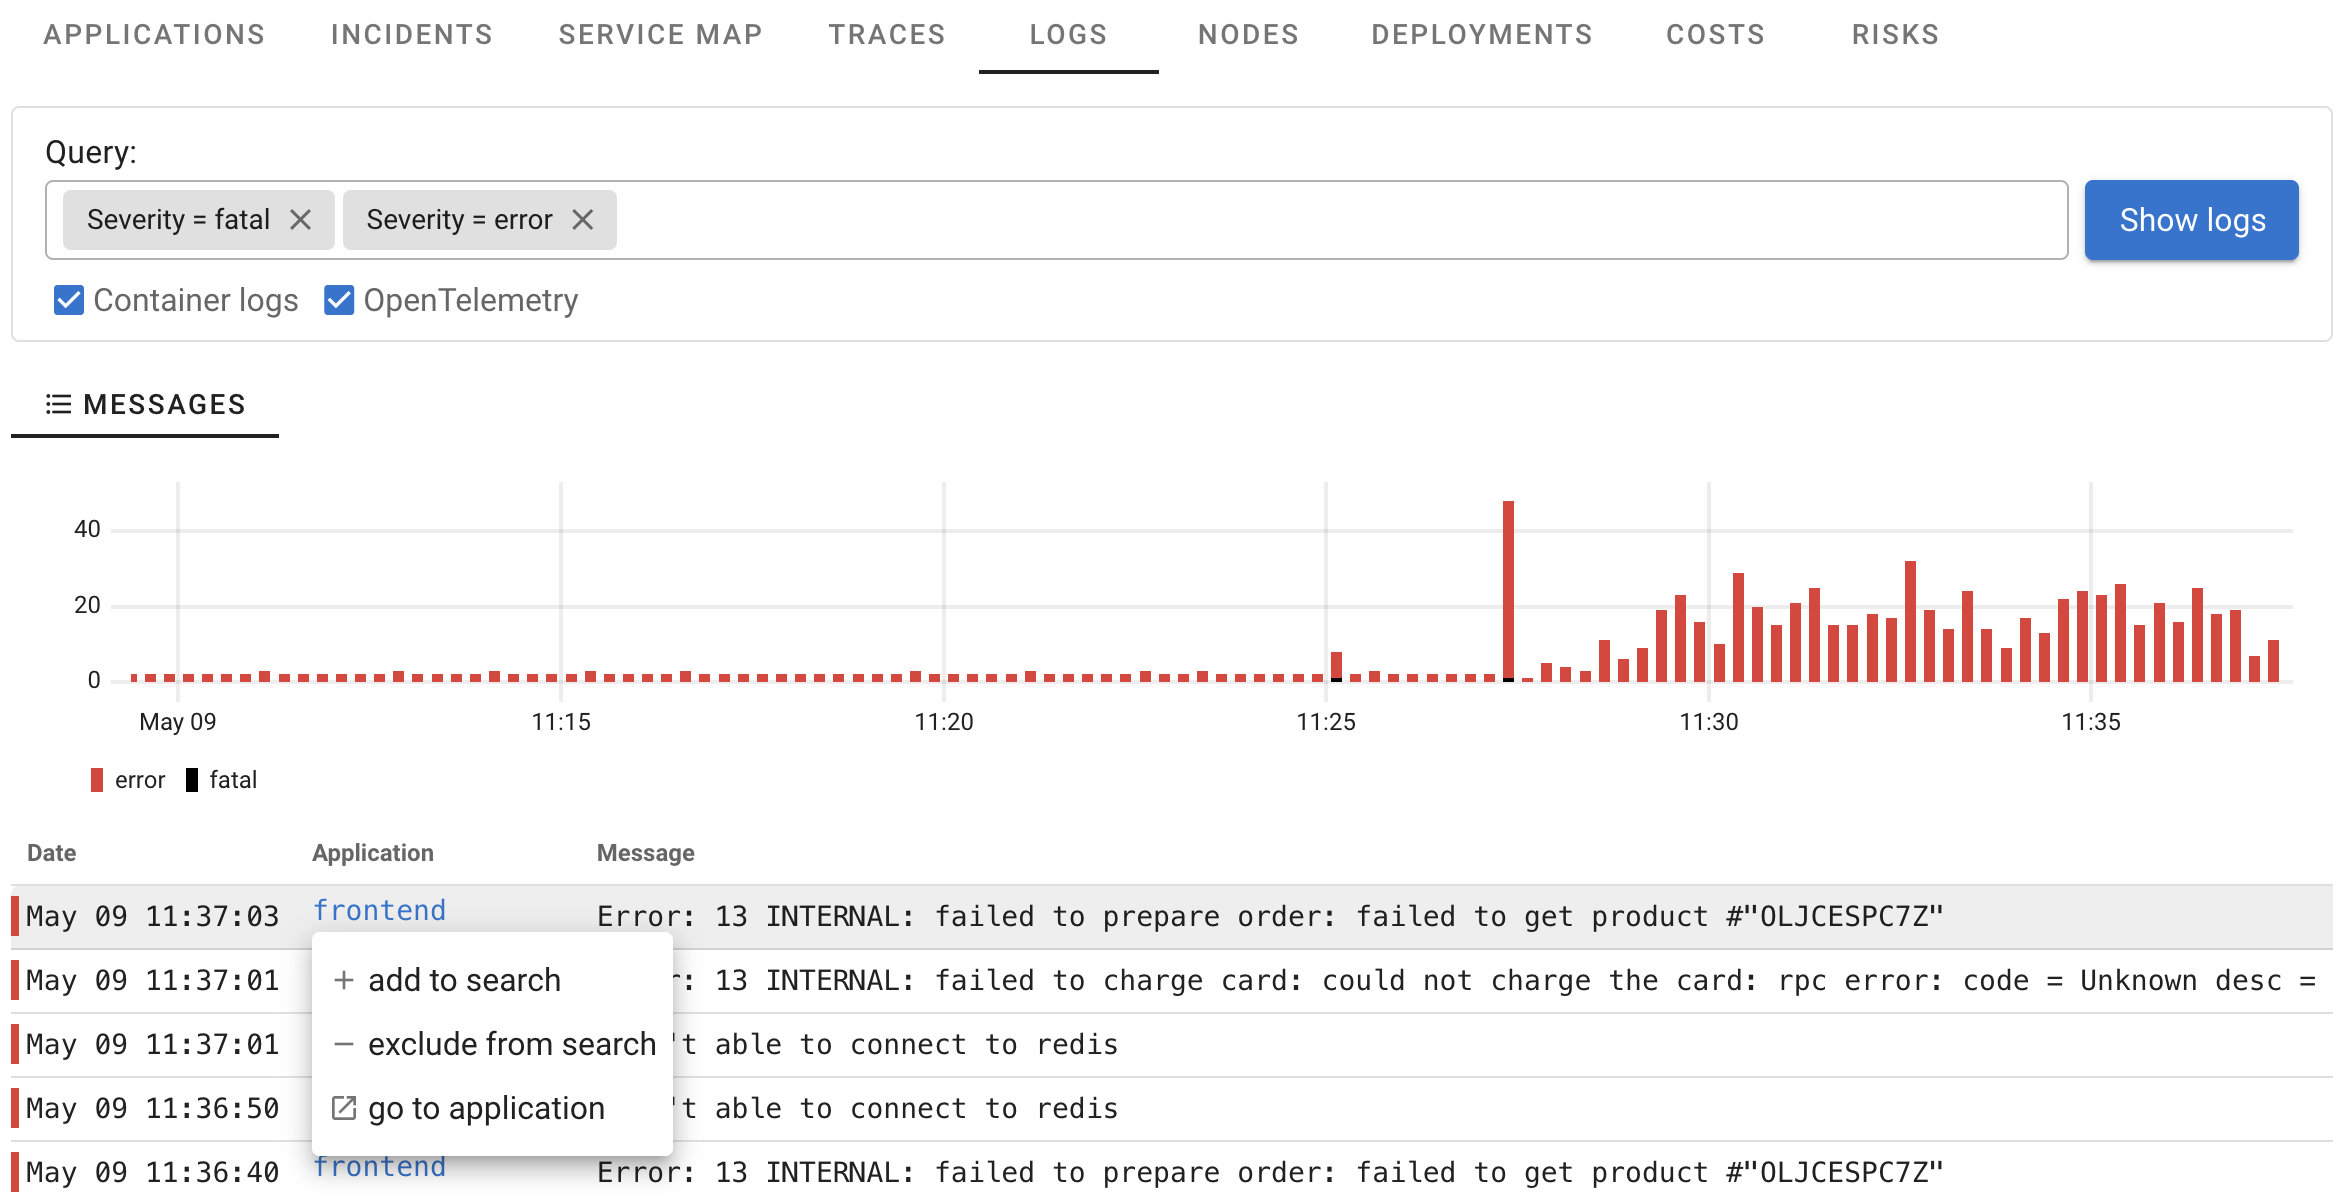
Quick links
Clicking the application name allows you to filter log entries for that application.
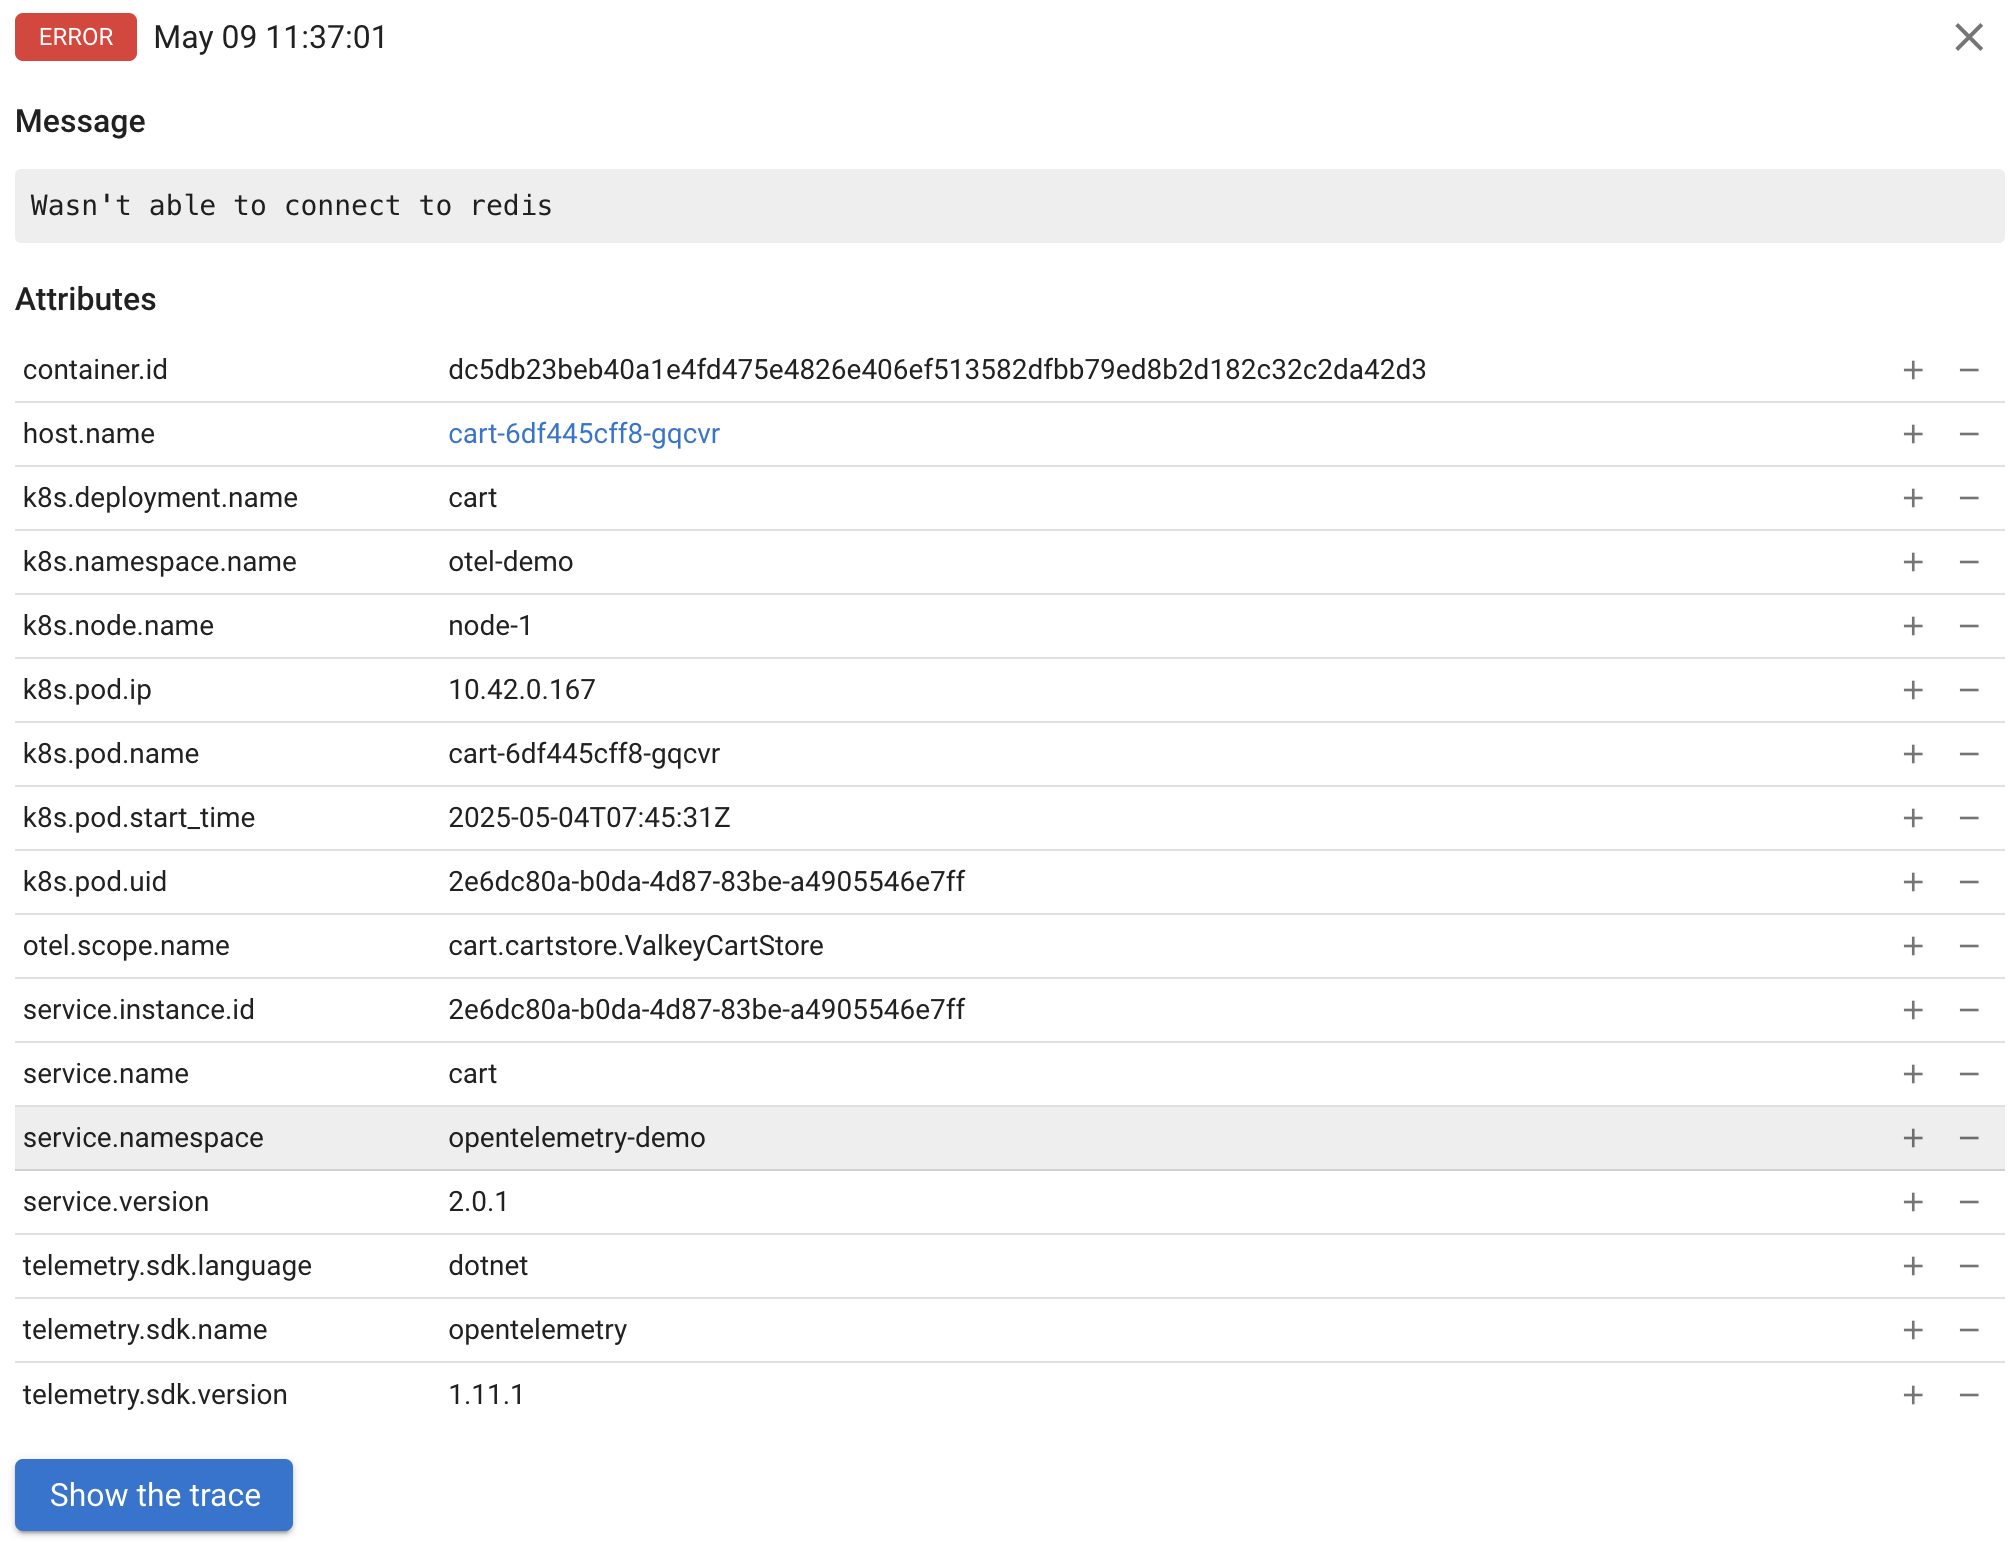
Correlating logs and traces
If you instrument your apps with the OpenTelemetry SDK to send logs to Coroot's OpenTelemetry collector along with the tracing context, you can instantly navigate to the corresponding trace with just one click.

Clicking Show logs in the Trace view retrieves all log entries associated with the corresponding TraceId.
