Application logs
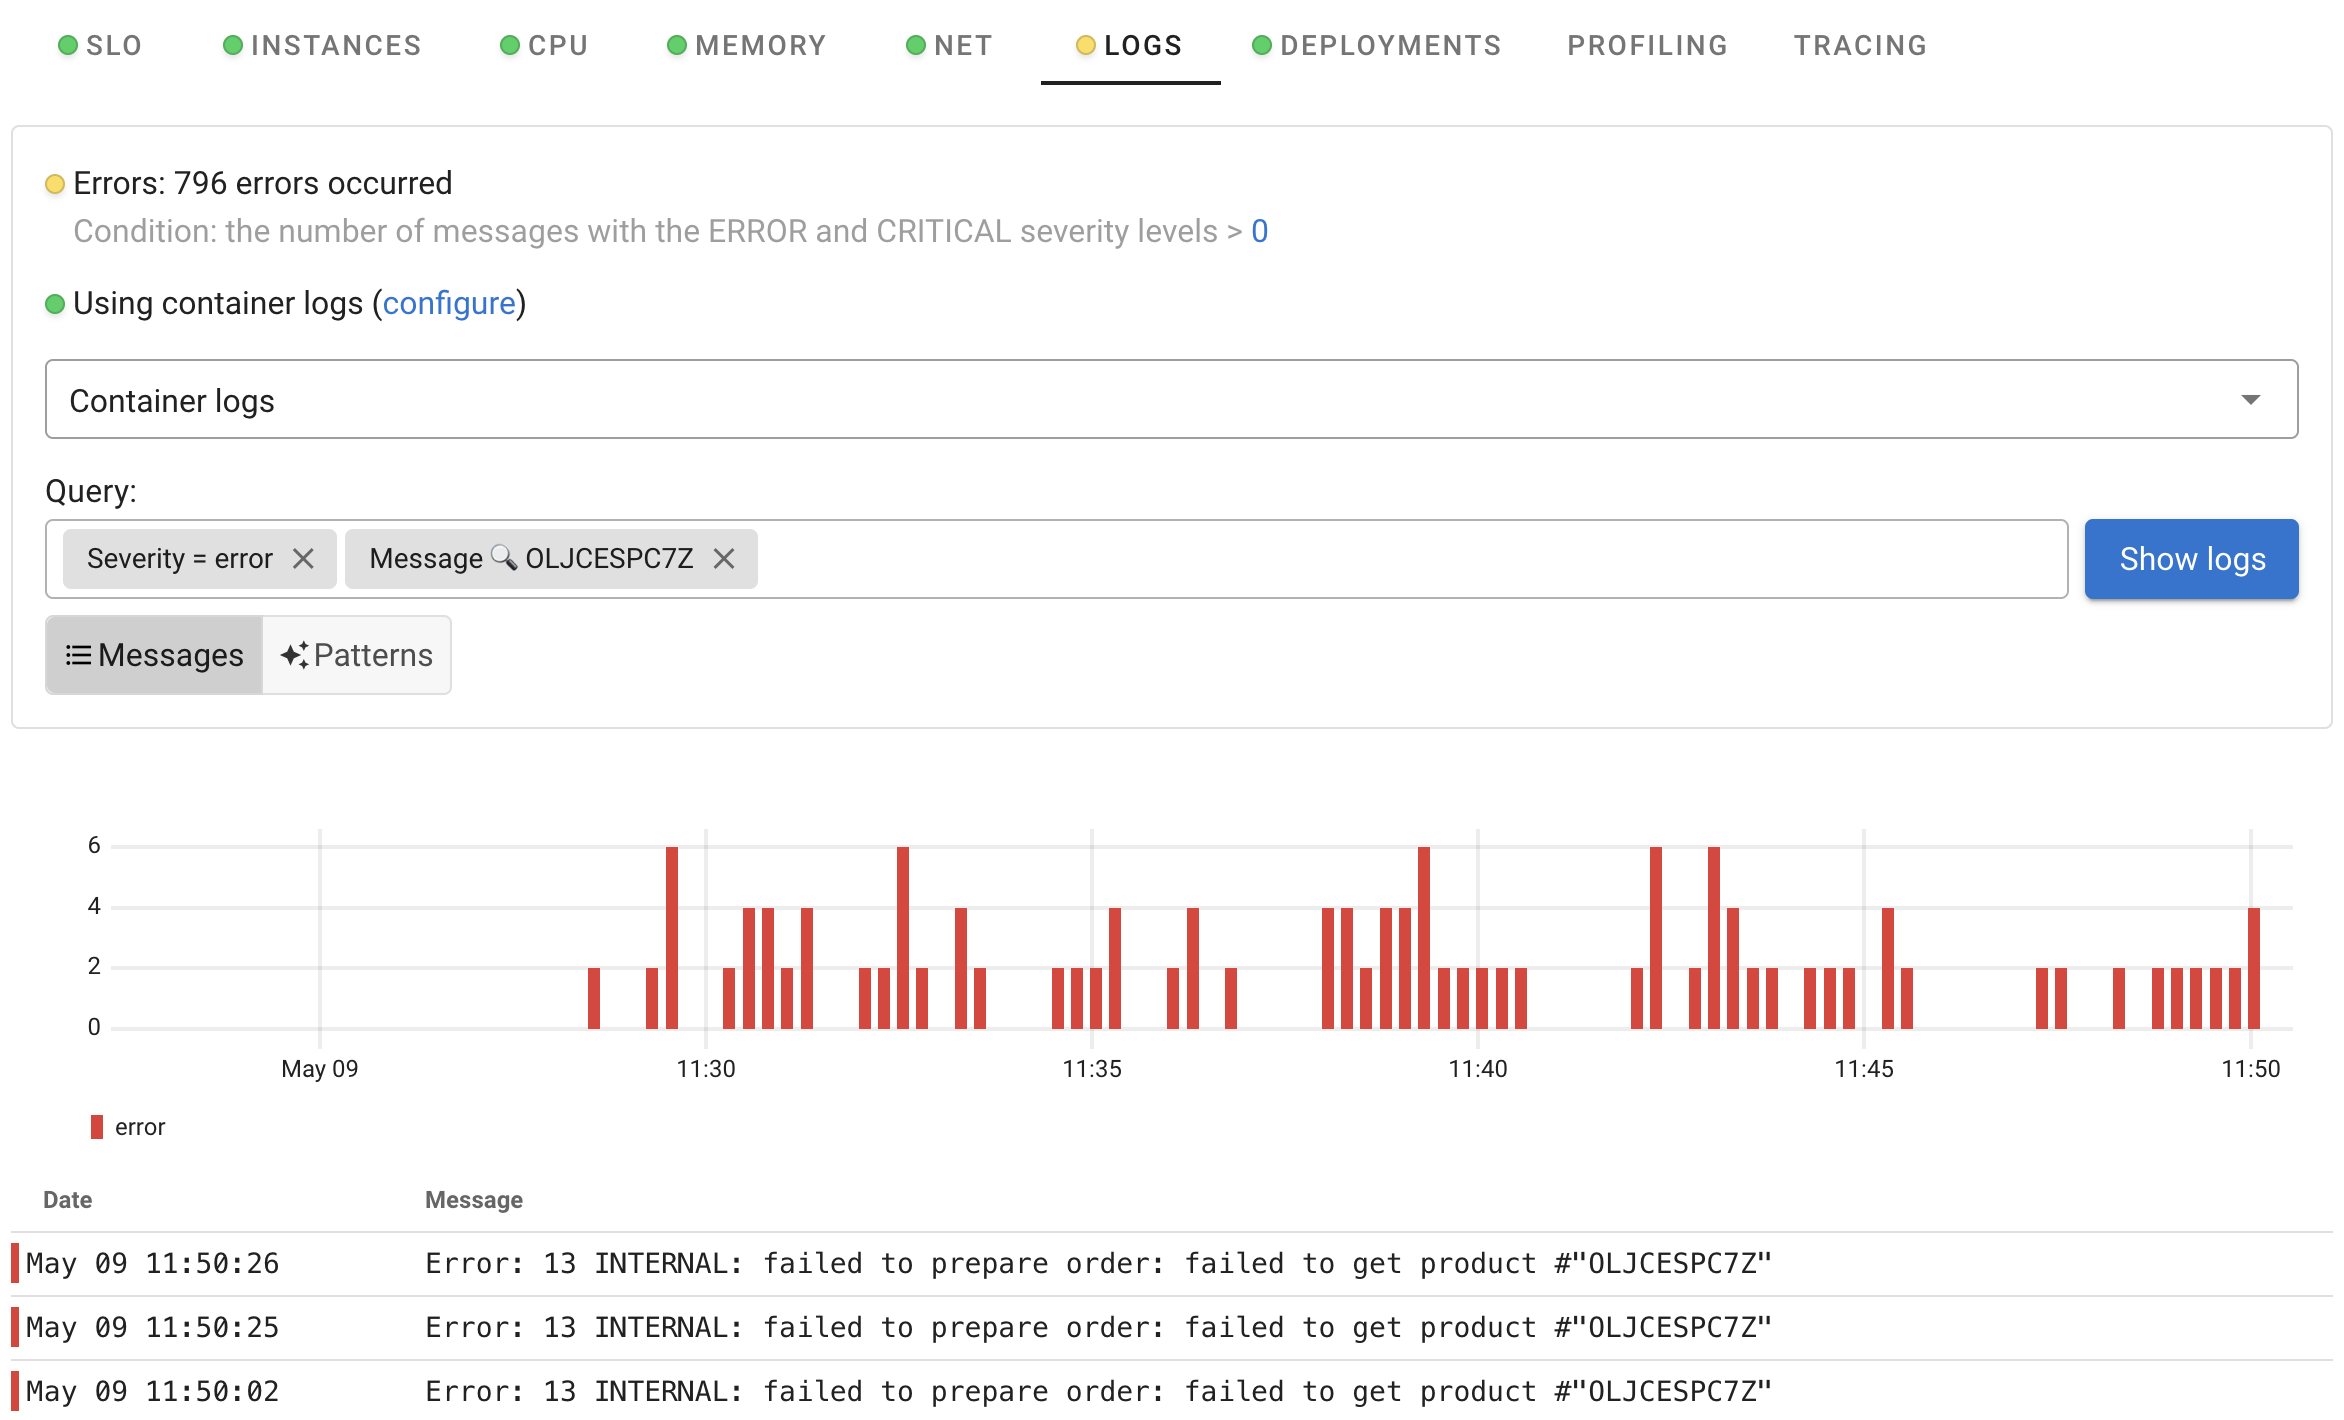
In the Application view, Coroot allows you to analyze and correlate application telemetry (availability, latency, CPU metrics, etc.) with raw logs and recurring log patterns. Logs are pre-filtered by application, eliminating the need to locate it manually in the main Logs view.
Log patterns
To quickly understand what types of errors appeared in the logs at a particular time, you can switch to the "Patterns" mode.
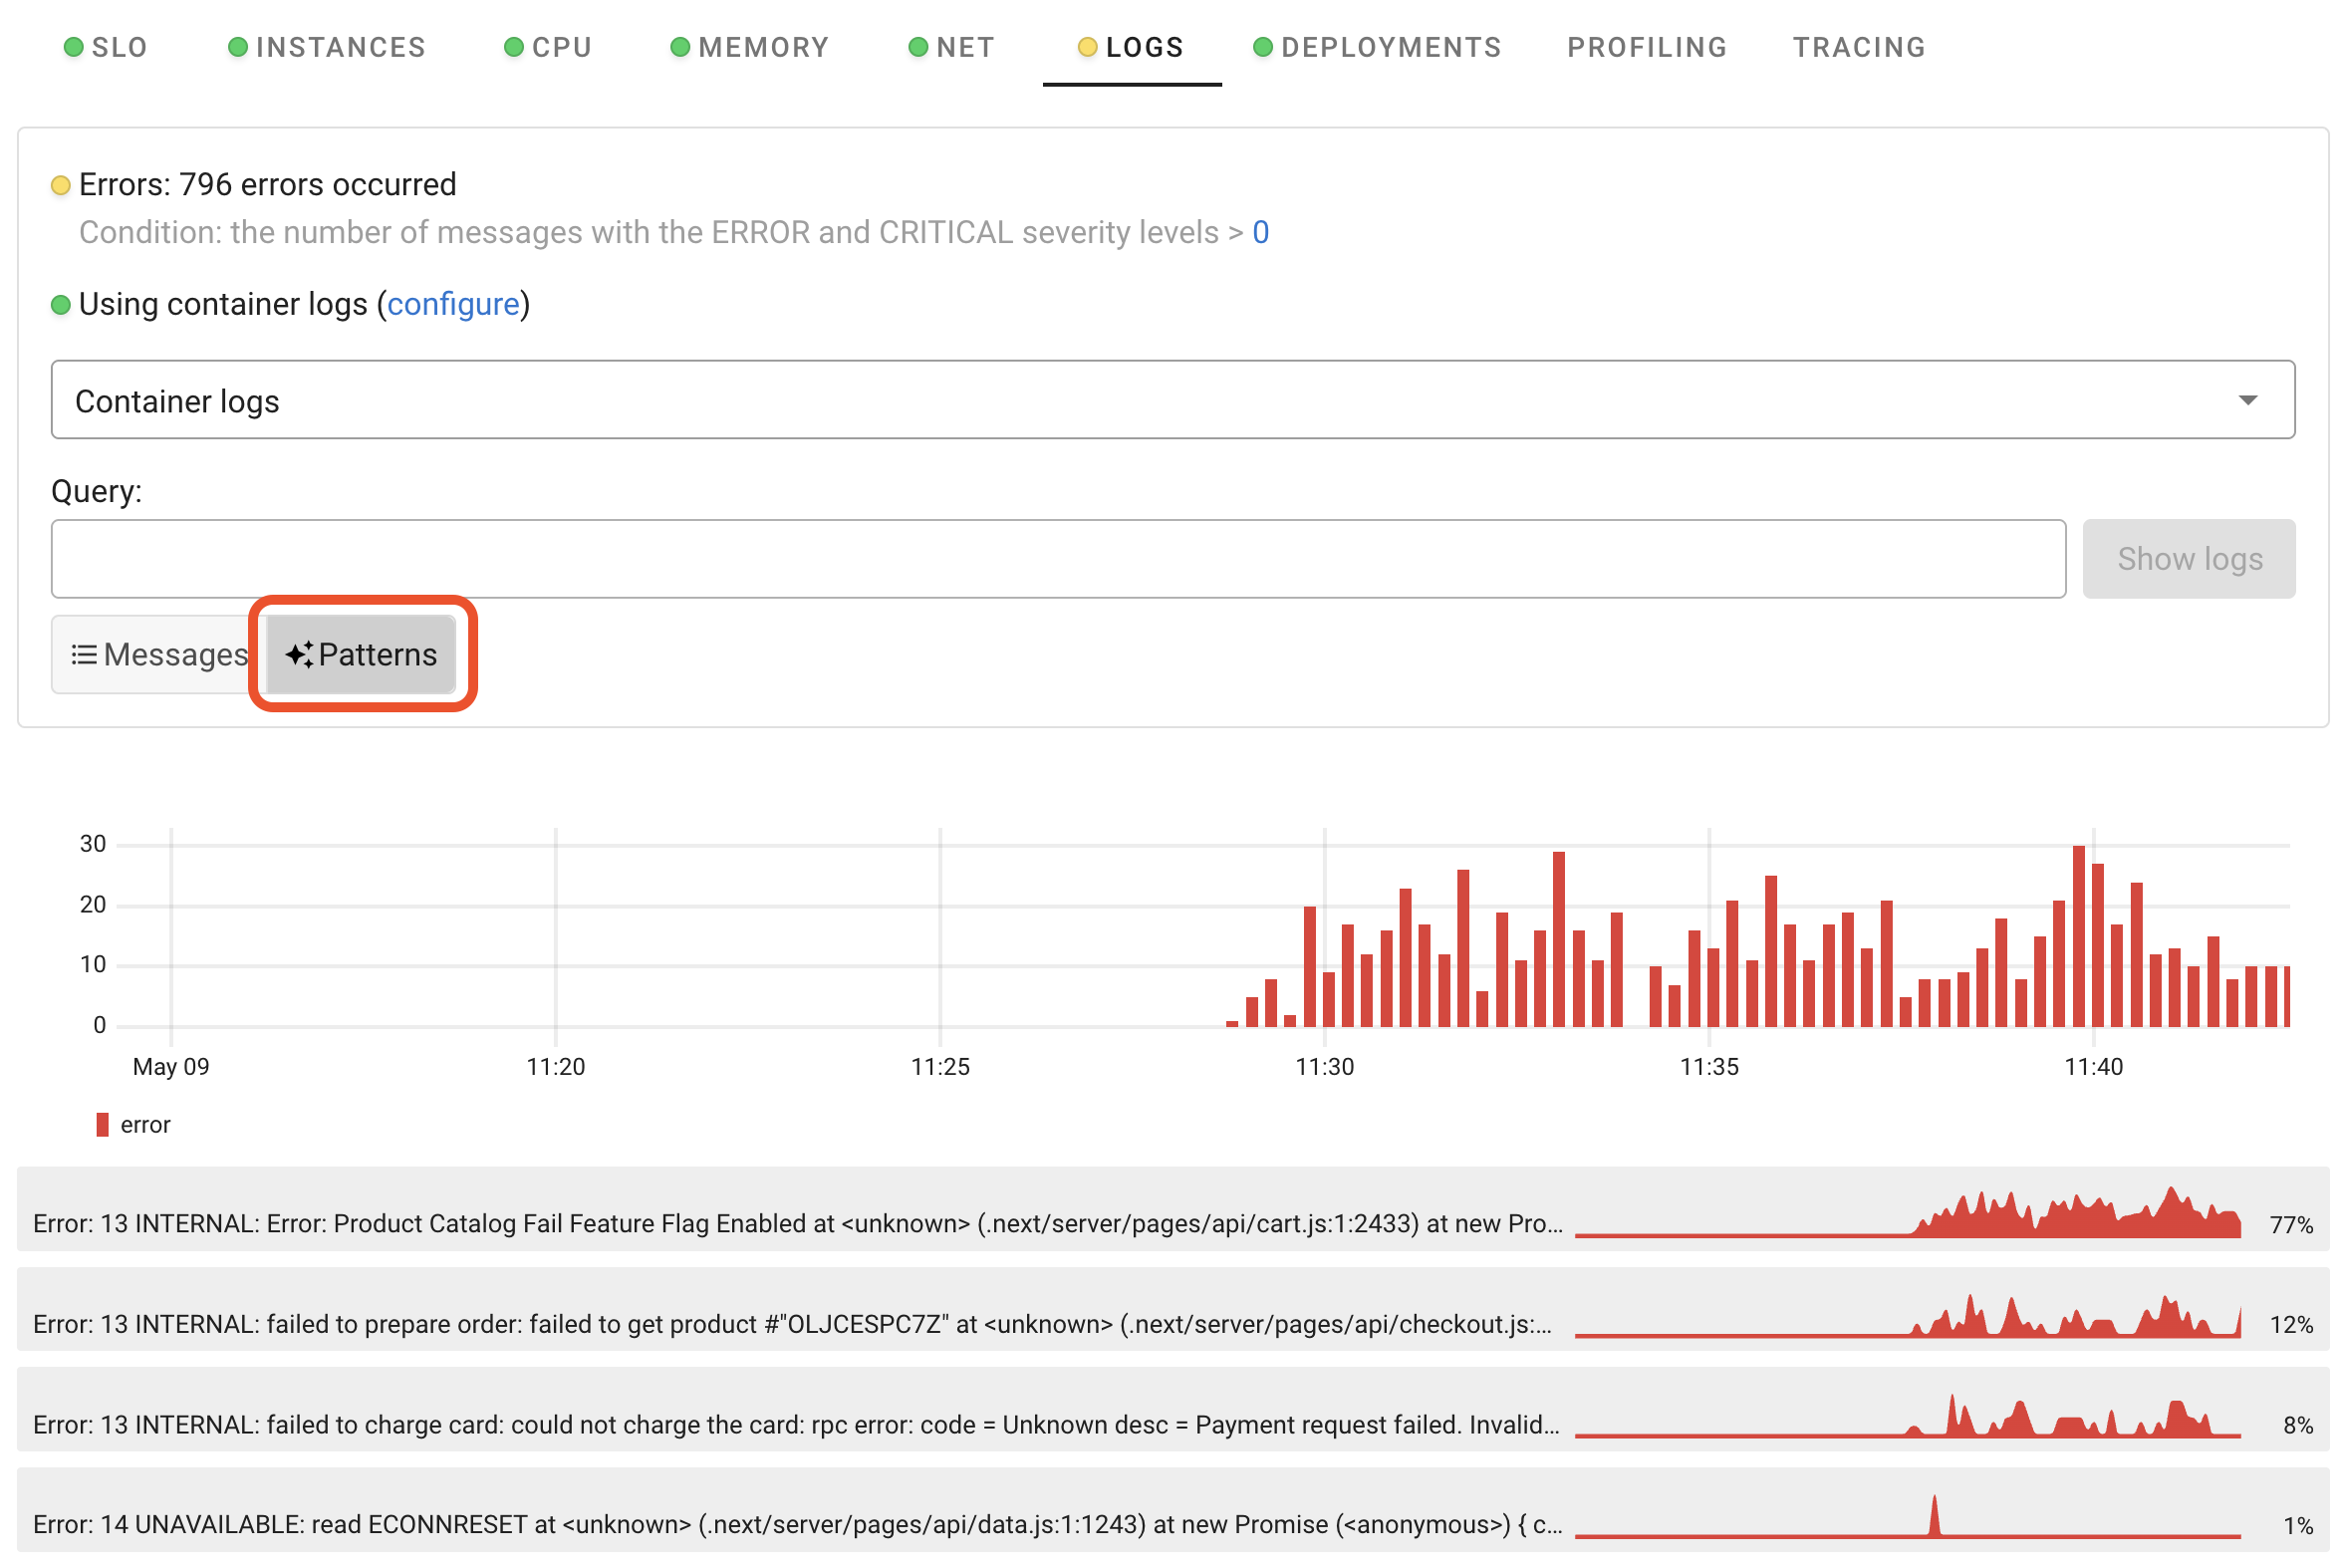
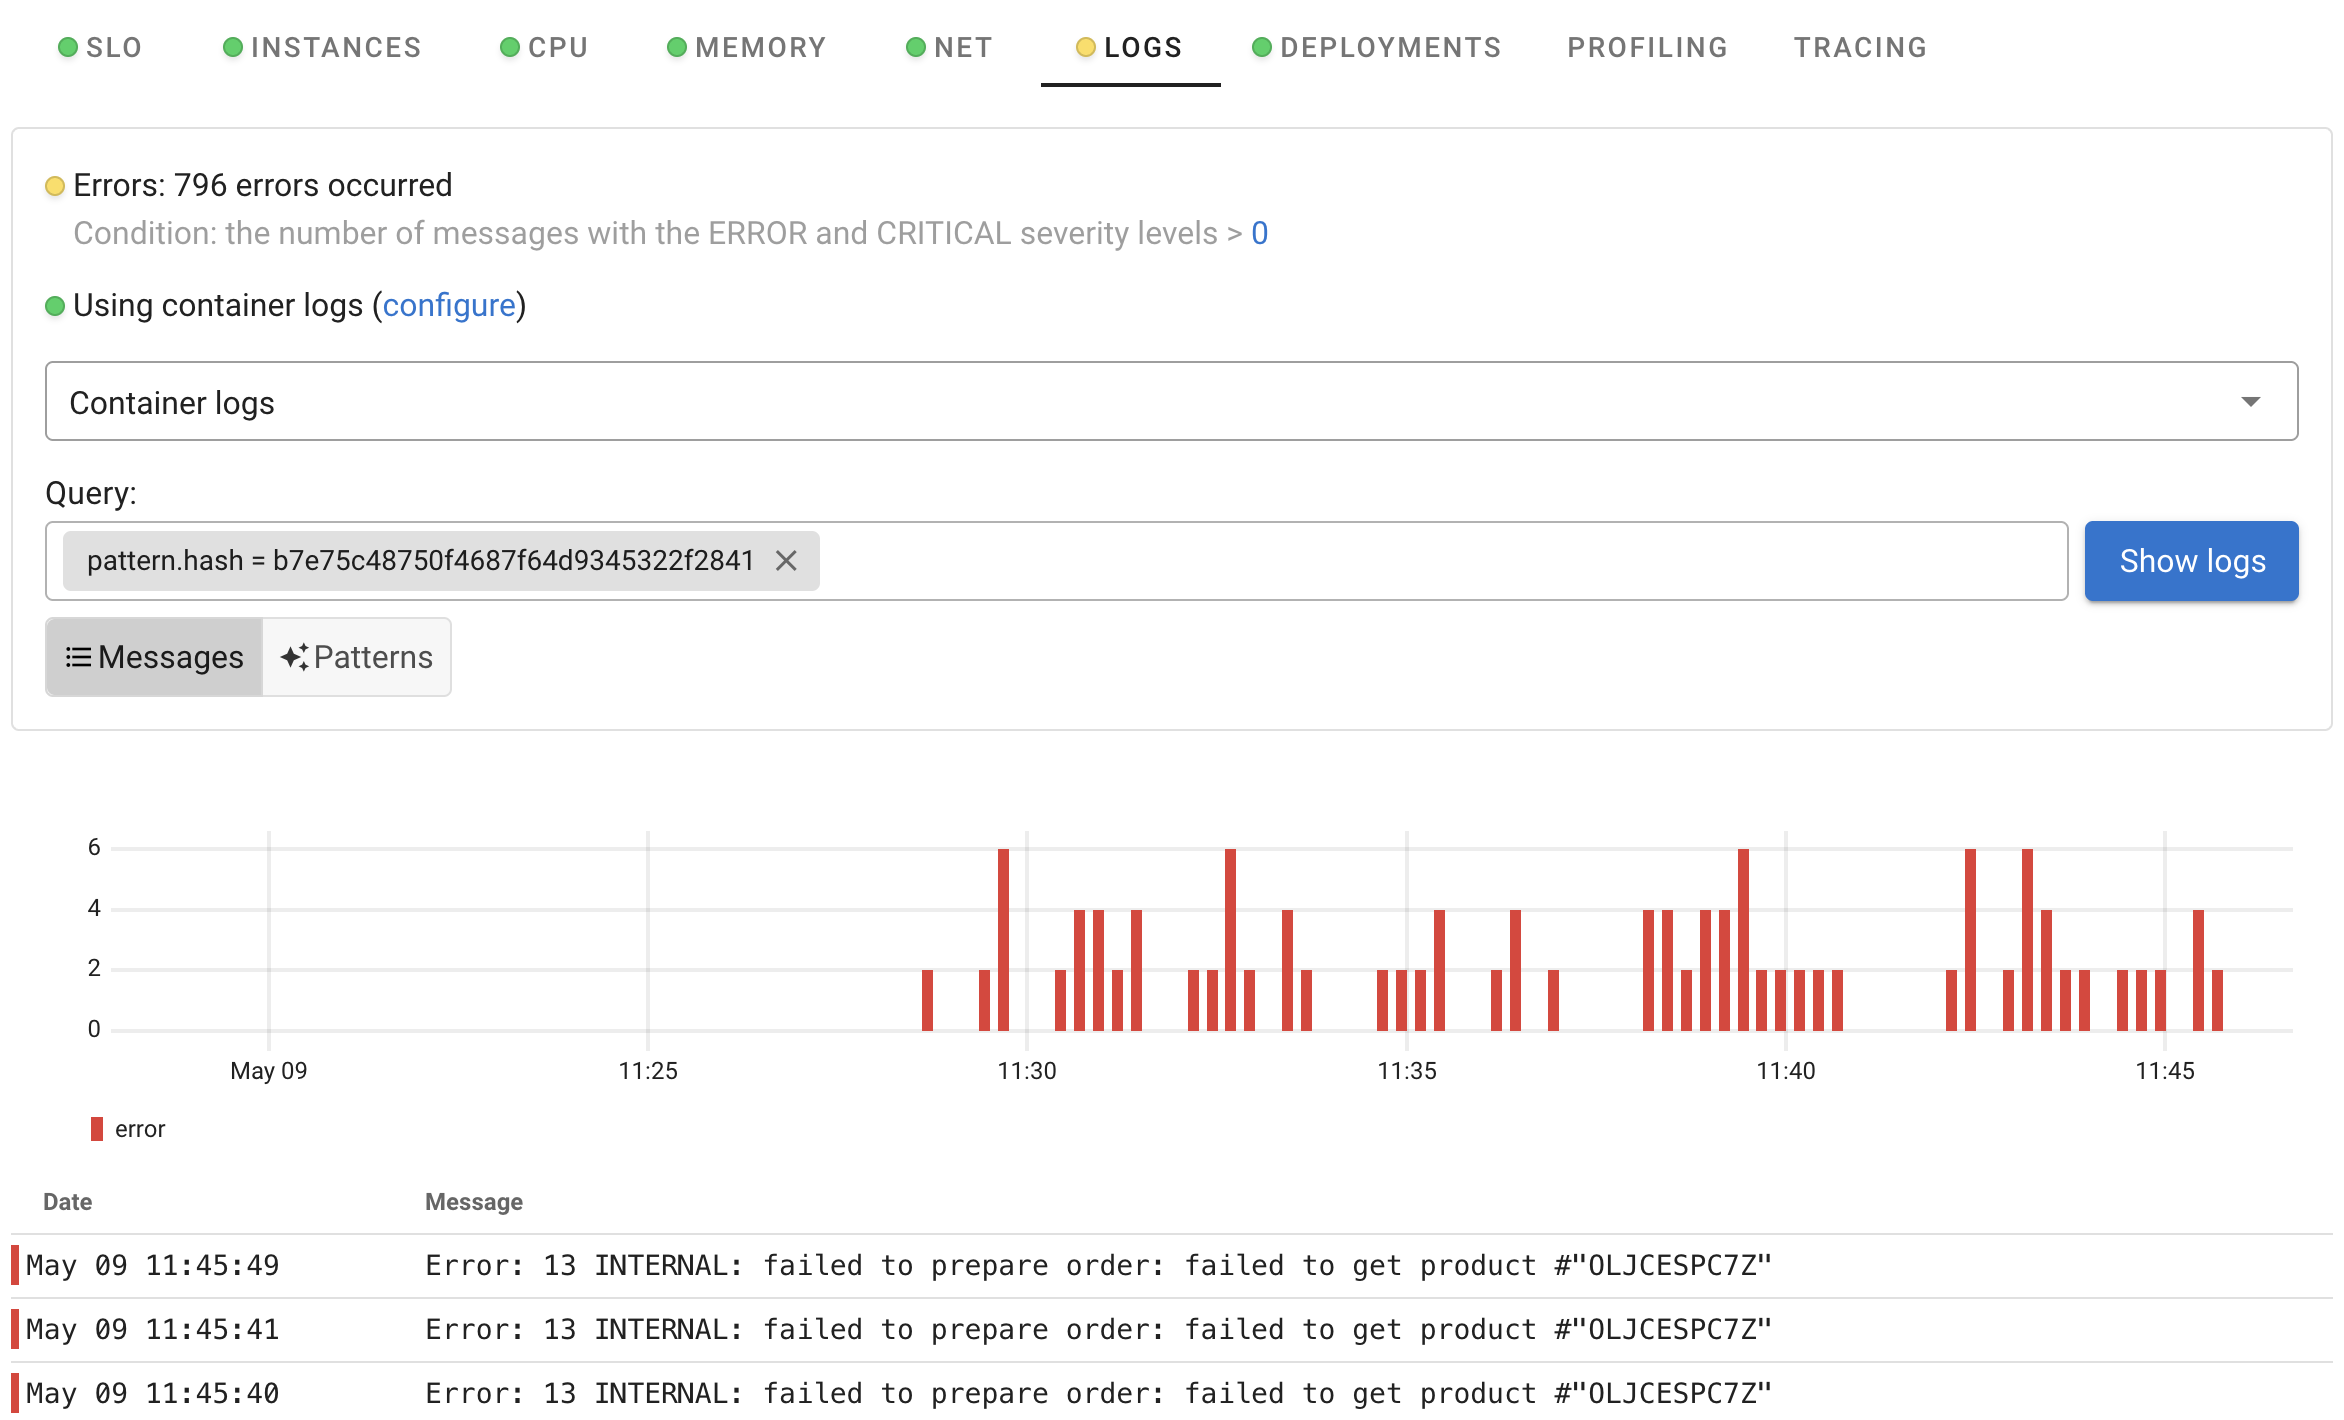
By clicking on any pattern, you can navigate to the original messages that match this pattern (Show Messages).
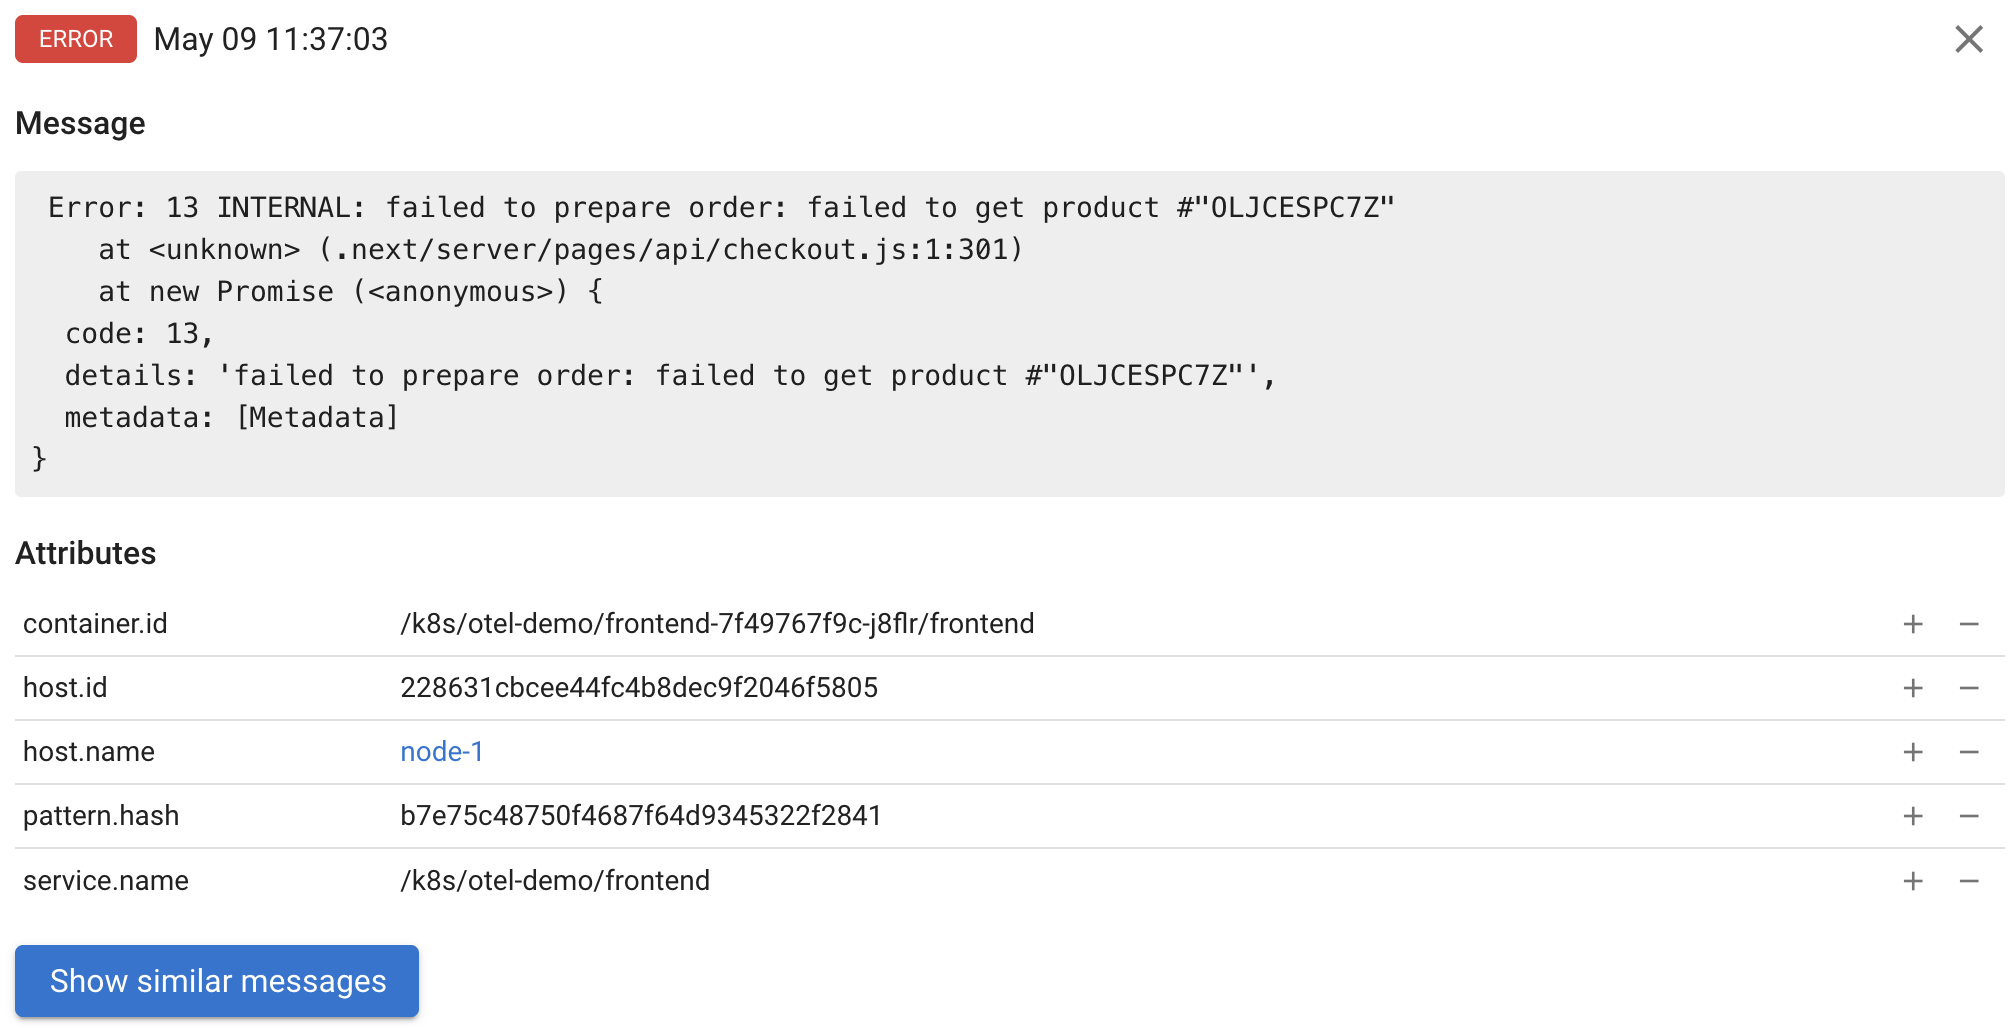
Event details
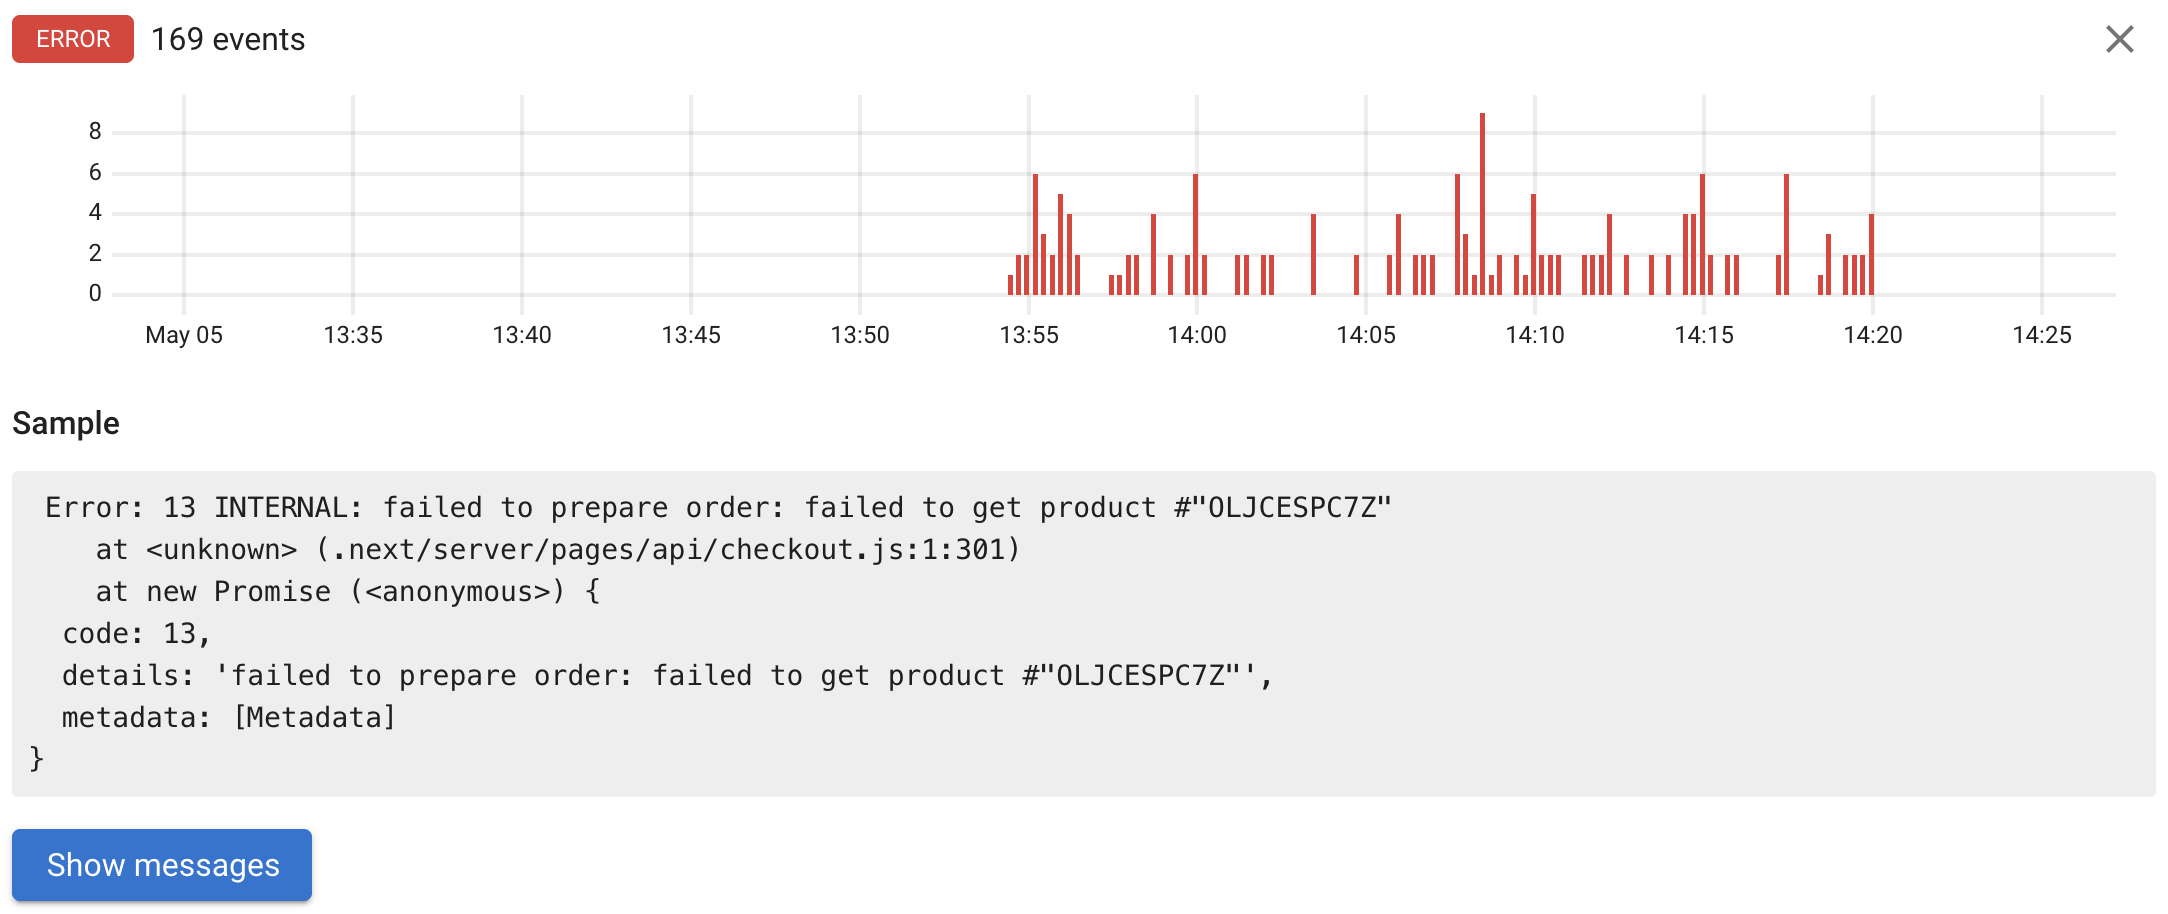
Clicking on a specific event from the list allows you to access its details, including the full message text, severity, and OpenTelemetry attributes. You can also jump to similar messages that match the same pattern.
Looking for 24/7 support from the Coroot team? Subscribe to Coroot Enterprise:Start free trial