Performance Impact
Observability should never come at the expense of the applications being observed. Coroot gathers telemetry from many sources: eBPF, OpenTelemetry, continuous profiling, logs, cloud provider APIs, and the statistics that databases report about themselves. Some of these collectors run right next to your workloads or send queries to your databases, so we benchmark them to make sure you get this visibility without paying for it in latency or resources. This page presents the results:
- eBPF-based monitoring: the impact of coroot-node-agent on an application serving 10,000 requests per second.
- MySQL instrumentation: the impact of coroot-cluster-agent on a busy MySQL server with 10,000 tables.
- Postgres instrumentation: the impact of coroot-cluster-agent on a busy Postgres server with 100 databases and 10,000 tables.
- MongoDB instrumentation: the impact of coroot-cluster-agent on a busy MongoDB server with 100 databases and 10,000 collections.
eBPF-based monitoring
Coroot leverages eBPF to collect telemetry data, such as metrics and traces. This approach involves running small observer programs in the kernel space. The Linux kernel guarantees that eBPF programs will not significantly interrupt kernel code execution by verifying each program before it runs: a program must have a finite complexity, and the verifier evaluates all possible execution paths within the configured complexity limit.
Lab
We run all tests on an m5.2xlarge instance and use a simple Go HTTP server along with wrk2 to generate the load.
All components are configured to use separate CPU cores, reducing competition for CPU time.
To achieve this, we use the --cpuset-cpus Docker parameter or the taskset utility for non-containerized apps.
HTTP server
We're not testing the app's performance but rather how capturing requests for observability affects latency. We'll use a Go app that responds with a 1KB payload in a constant 5ms.
package main

import (
  "net/http"
  "bytes"
  "time"
)

var payload = bytes.Repeat([]byte("0"), 1024)

func handler(w http.ResponseWriter, req *http.Request) {
  time.Sleep(5*time.Millisecond)
  w.Write(payload)
}

func main() {
  http.HandleFunc("/", handler)
  http.ListenAndServe(":8090", nil)
}
# CPU cores #2-3
taskset -c 2-3 go run app.go
wrk2 (load generation)
It's important to note that tests for maximum throughput can be impacted by any additional CPU-consuming processes on the node. Our approach involves measuring a baseline latency under a fixed number of requests per second (10,000 RPS) and then repeating the experiment with the Coroot's agent enabled.
# threads:4, connections: 100, test duration: 5 minute, CPU cores #4-7
docker run --rm --cpuset-cpus 4-7 -ti cylab/wrk2 -t4 -c100 -d300s -R10000 --u_latency http://172.17.0.1:8090/
coroot-node-agent
# CPU cores #0-1
docker run -d --name coroot-node-agent \
  --cpuset-cpus 0-1 \
  --privileged --pid host \
  -v /sys/kernel/debug:/sys/kernel/debug:rw \
  -v /sys/fs/cgroup:/host/sys/fs/cgroup:ro \
  ghcr.io/coroot/coroot-node-agent --cgroupfs-root=/host/sys/fs/cgroup
Test Results
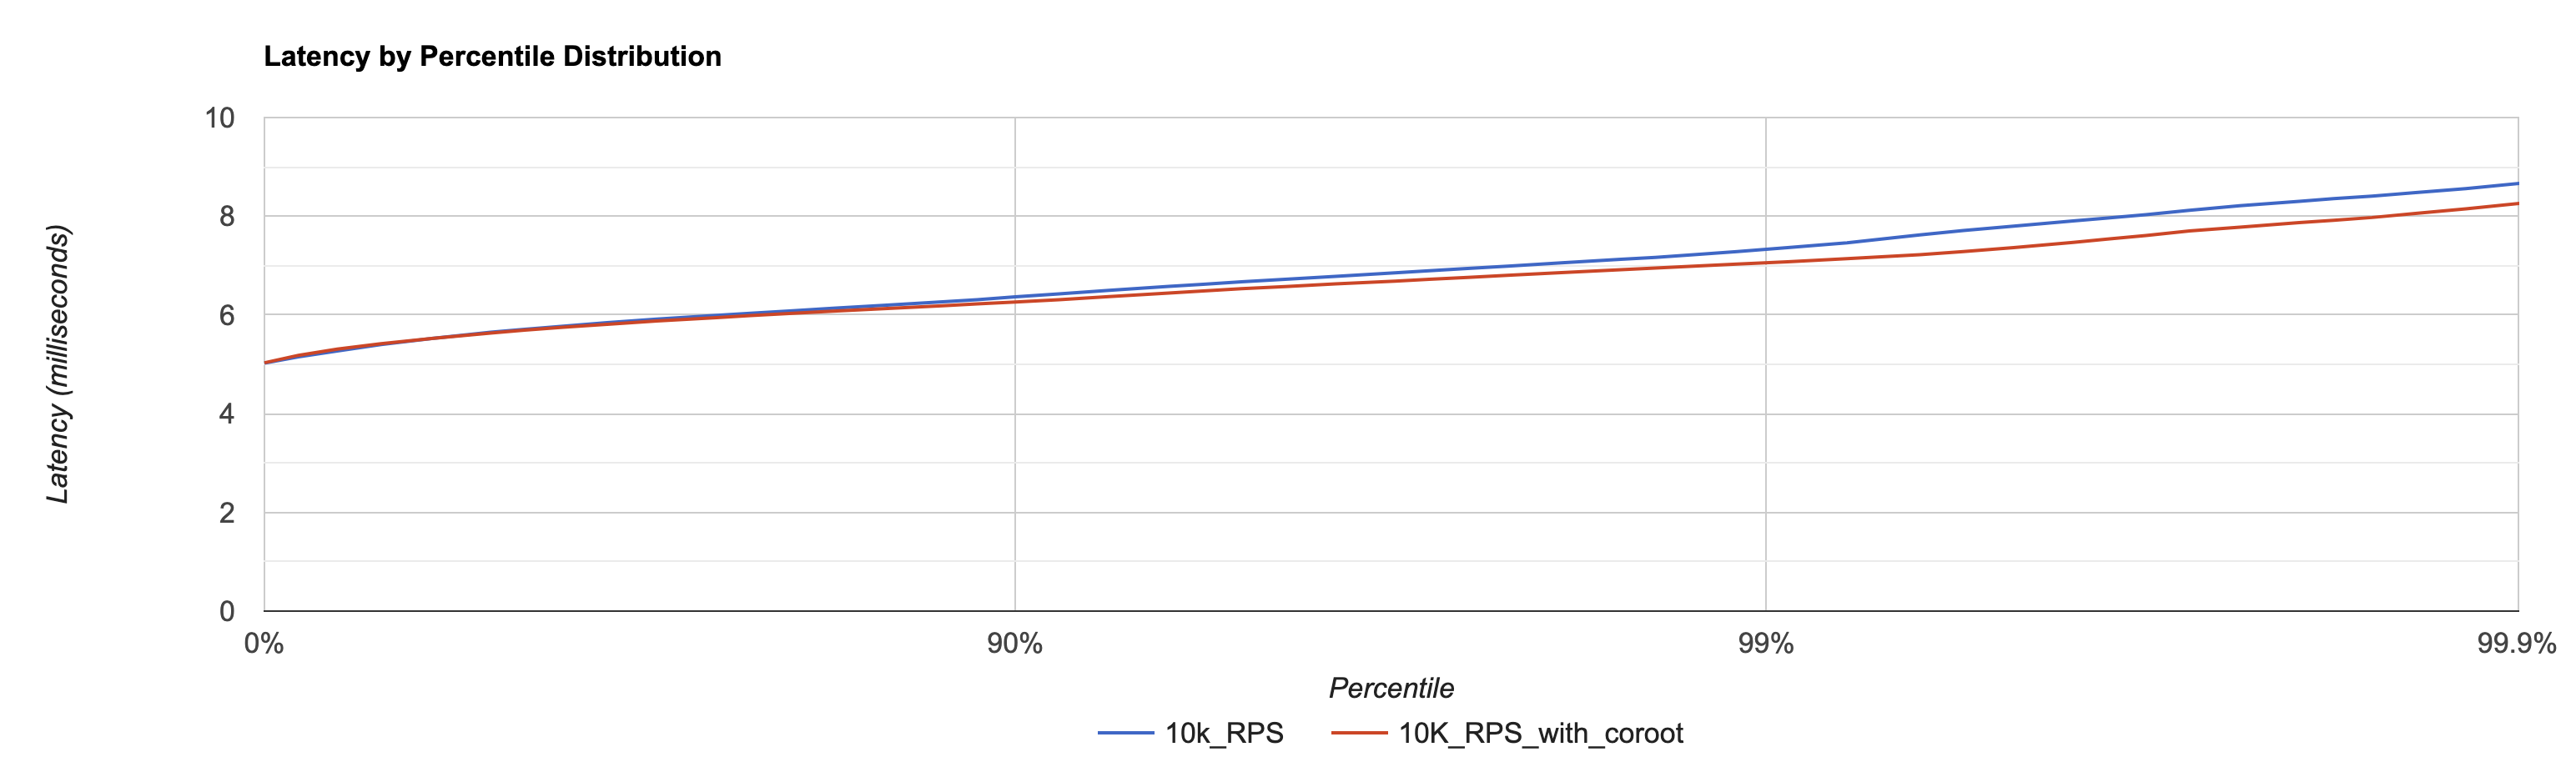
The latency difference with and without coroot-node-agent enabled falls within the margin of measurement error. During the test the agent consumed 200m CPU (20% of one CPU core).
It's essential to understand that eBPF ensures that the observer program cannot impact kernel operations, even during slowdowns caused by factors like CPU resource limitations. In such situations, some events sent from the kernel to the agent may be lost due to the limited capacity of the underlying ring buffers. In other words, this might result in some statistics not being entirely accurate, but the application performance will not be affected.
Conclusion
If you are running loads around 10,000 requests per second, you can be confident that Coroot will have no noticeable impact on your application's performance or response time. In this scenario, the Coroot agent's CPU consumption will be approximately 20% of a single CPU core.
If your workloads are significantly larger, we highly recommend conducting a similar load test. The Coroot team is here to assist you with this, please feel free to reach out to us.
MySQL instrumentation
eBPF shows how a database behaves from the outside, but explaining why it is slow requires data from the inside.
For MySQL, coroot-cluster-agent gets it the same way a DBA would: it connects as a regular client and periodically
reads performance_schema, information_schema and the server status. These are ordinary SQL queries competing for the same resources as
your application, so we tested them where they hurt the most - on a loaded server with thousands of tables - and measured the
latency of application queries, the extra resources consumed by MySQL, and the footprint of the agent itself.
Lab
- MySQL 8.4 on a dedicated virtual machine (8 vCPU, 32GB RAM, NVMe SSD): 100 databases with 100 tables each (10,000 tables, 100M rows, ~100GB on disk),
a 20GB buffer pool, binary logging enabled,
innodb_flush_log_at_trx_commit=1, andperformance_schemawith its default settings. - Load: 100
sysbenchprocesses (one per database) on two other machines hold 500 client connections and execute a fixed 500 transactions / 10,000 queries per second, roughly half of what this server can handle. - coroot-cluster-agent 1.11.3 on a separate machine, with the default settings: a 15-second scrape interval, and query, table I/O, schema and size tracking enabled. The monitoring user has the recommended permissions.
- coroot-node-agent on every machine. It stays enabled throughout the test and serves as the measuring tool: query latency is captured by eBPF
on the client side, and the CPU and memory usage of
mysqldand the agent come from container metrics.
# for each of the 100 databases
sysbench oltp_read_write --mysql-db=tenant_001 --tables=100 --table-size=10000 \
  --threads=5 --rate=5 --time=0 --db-ps-mode=disable run
Every statement touches a random table, so the workload produces about 100,000 distinct statement digests.
events_statements_summary_by_digest is permanently full (10,000 rows), and table_io_waits_summary_by_table has a row for each of the 10,000 tables.
This is the worst case for the agent, as it reads both tables on every scrape.
The test runs six 20-minute phases under the same load, with the instrumentation alternately disabled and enabled (off → on → off → on → off → on),
which makes it possible to tell its effect from the natural noise of a cloud environment.
Test Results
In the charts below, the shaded areas are the phases with the instrumentation enabled.
Client-side latency

| Phase | 1 (off) | 2 (on) | 3 (off) | 4 (on) | 5 (off) | 6 (on) |
|---|---|---|---|---|---|---|
| Queries per second | 10,056 | 10,012 | 10,015 | 10,045 | 9,950 | 10,005 |
| Average query latency (eBPF), ms | 0.718 | 0.717 | 0.798 | 0.718 | 0.716 | 0.716 |
| Queries completed within 5ms (eBPF), % | 99.75 | 99.76 | 99.39 | 99.77 | 99.77 | 99.78 |
| p99 transaction latency (sysbench, 20 queries), ms | 47.3 | 46.0 | 60.0 | 44.9 | 45.3 | 44.6 |
The latency with the instrumentation enabled is identical to the baseline, both on average and at the 99th percentile, and no queries failed. The only deviation happened in phase 3, when the instrumentation was disabled: two short episodes of increased disk latency on the MySQL machine slowed down commits. We kept this phase in the report to show the scale of the background noise compared to any difference between the "on" and "off" phases.
MySQL resource usage

| Phase | 1 (off) | 2 (on) | 3 (off) | 4 (on) | 5 (off) | 6 (on) |
|---|---|---|---|---|---|---|
| mysqld CPU usage, cores | 3.24 | 3.29 | 3.22 | 3.29 | 3.21 | 3.28 |
| mysqld memory (RSS), GB | 25.35 | 25.36 | 25.36 | 25.36 | 25.36 | 25.36 |
Serving the agent's queries costs MySQL about 0.07 CPU cores: a 2% increase in mysqld CPU usage, or less than 1% of this 8-core machine.
Memory usage and disk I/O are not affected, since the agent reads only in-memory performance_schema tables and the data dictionary.
The agent runs 52 statements per minute, sequentially over a single persistent connection, so it can never occupy more than one MySQL thread. Their cost is driven by the number of tables and statement digests rather than by the query rate:
| Query | Frequency | Rows returned | Avg. time |
|---|---|---|---|
performance_schema.table_io_waits_summary_by_table | every scrape | 10,170 | 987ms |
information_schema.INNODB_TABLESPACES (undo tablespace size) | every scrape | 1 | 121ms |
performance_schema.events_statements_summary_by_digest | every scrape | 10,000 | 79ms |
information_schema.columns, statistics, tables, key_column_usage (schema and size tracking) | every minute | 73,889 | 673ms in total |
| everything else (server status and variables, lock waits, etc.) | every scrape | - | ~20ms in total |
coroot-cluster-agent resource usage
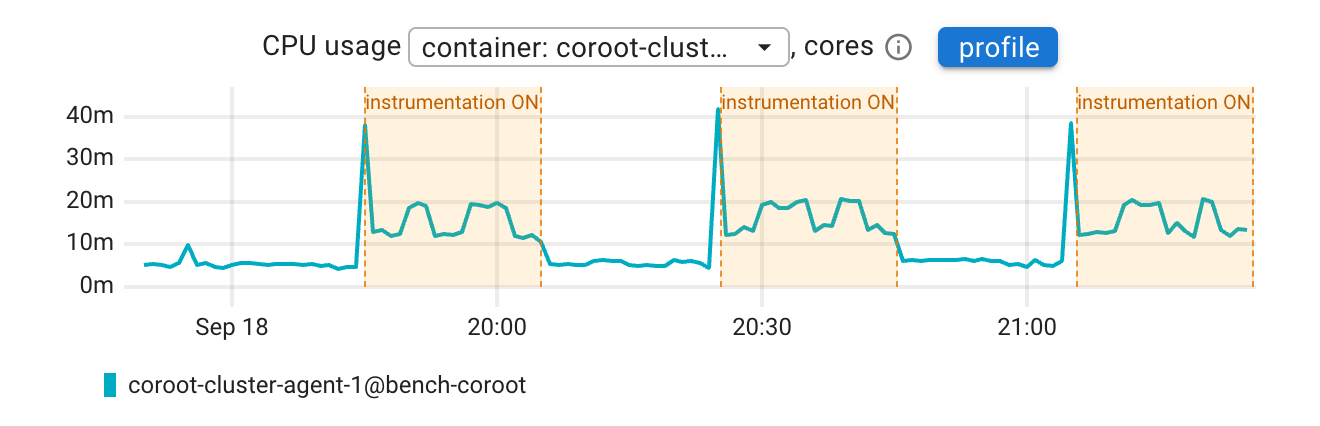
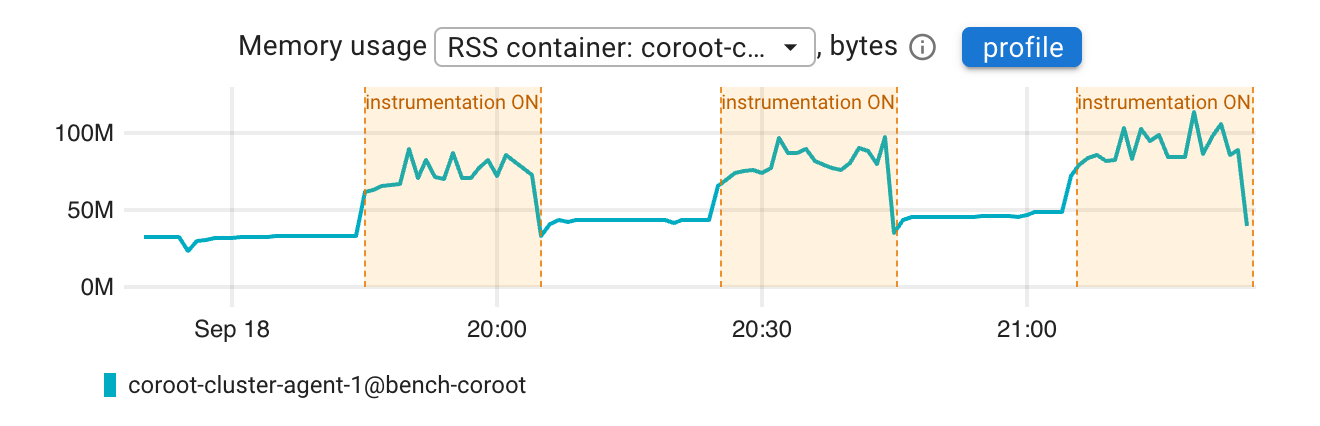
| Phase | 1 (off) | 2 (on) | 3 (off) | 4 (on) | 5 (off) | 6 (on) |
|---|---|---|---|---|---|---|
| CPU usage, cores | 0.005 | 0.015 | 0.006 | 0.016 | 0.006 | 0.016 |
| Memory (RSS), average, MB | 33 | 77 | 43 | 84 | 46 | 92 |
| Memory (RSS), peak, MB | 33 | 95 | 44 | 102 | 49 | 115 |
Compared to the idle agent, monitoring this instance costs about 0.01 CPU cores and 40-70MB of memory. The spikes at the beginning of each "on" phase are caused by restarting the agent, which is how the instrumentation was switched on and off.
Conclusion
On a MySQL server with 100 databases, 10,000 tables, 500 client connections and 10,000 queries per second:
- enabling the instrumentation has no measurable impact on the latency of application queries;
- MySQL spends about 0.07 CPU cores (+2%) on the agent's queries, with no additional memory usage or disk I/O;
- coroot-cluster-agent consumes about 0.01 CPU cores and less than 120MB of memory.
If the defaults are still too heavy for your environment (for example, a server with hundreds of thousands of tables), schema and size tracking can be limited or turned off, and the scrape interval can be increased. See what data is collected for the available options.
Postgres instrumentation
For Postgres, coroot-cluster-agent reads pg_stat_statements, pg_stat_activity and other statistics views over a single connection to the postgres database.
In addition, once a minute it briefly connects to every database on the server to track table sizes, schema changes, bloat and autovacuum statistics.
This makes a server with many databases the most demanding case for the agent, so that is what we tested, using the same method as in the MySQL benchmark above.
Lab
- Postgres 18 on a dedicated virtual machine (8 vCPU, 32GB RAM, NVMe SSD): 100 databases with 100 tables each (10,000 tables, 100M rows, 25GB),
shared_buffers=8GB,max_connections=1000,pg_stat_statementsandtrack_io_timingenabled. - Load: 100
sysbenchprocesses (one per database) on two other machines hold 500 client connections and execute a fixed 800 transactions / 16,000 queries per second, roughly half of what this server can handle. - coroot-cluster-agent 1.11.3 on a separate machine, with the default settings: a 15-second scrape interval, and schema, size and bloat tracking enabled.
The monitoring role has the recommended permissions (
pg_monitor). - coroot-node-agent on every machine as the measuring tool: query latency is captured by eBPF on the client side, and the CPU and memory usage of Postgres and the agent come from container metrics.
# for each of the 100 databases
sysbench oltp_read_write --db-driver=pgsql --pgsql-db=tenant_001 --tables=100 --table-size=10000 \
  --threads=5 --rate=8 --time=0 --db-ps-mode=disable run
The workload produces about 100,000 distinct statements, so pg_stat_statements is permanently full (5,000 entries, the default pg_stat_statements.max).
As before, the test runs six 20-minute phases under the same load, with the instrumentation alternately disabled and enabled.
Test Results
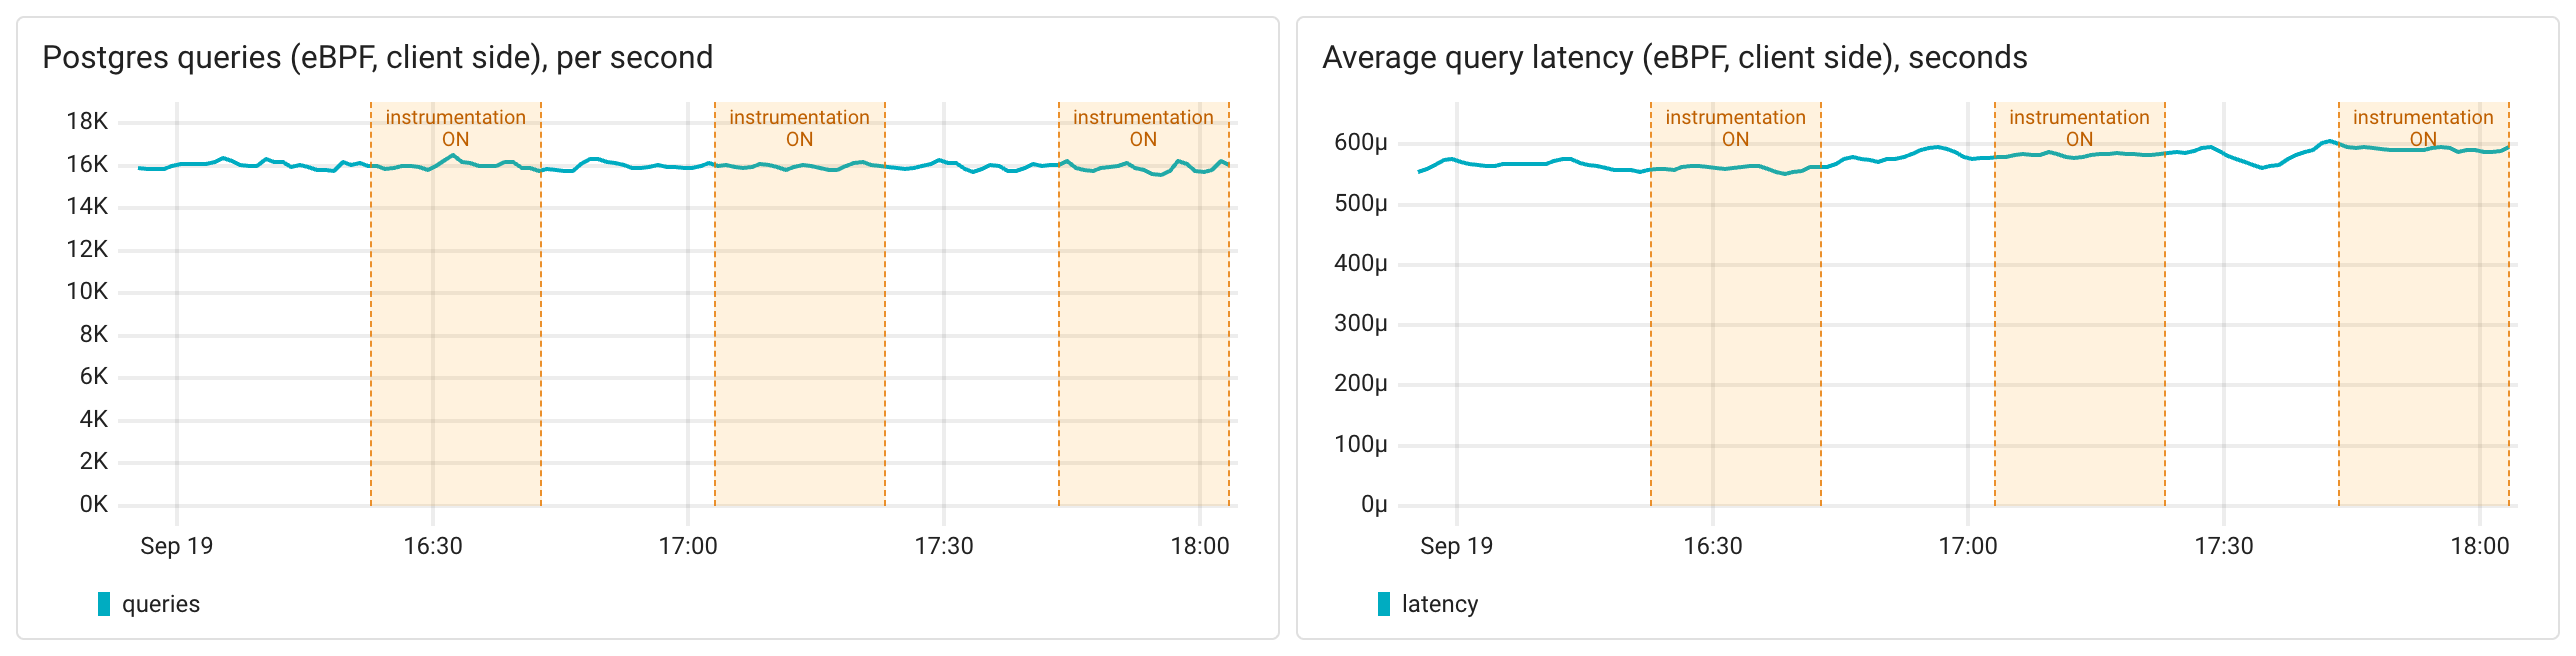
In the charts below, the shaded areas are the phases with the instrumentation enabled.
Client-side latency
| Phase | 1 (off) | 2 (on) | 3 (off) | 4 (on) | 5 (off) | 6 (on) |
|---|---|---|---|---|---|---|
| Queries per second | 16,051 | 16,035 | 16,051 | 15,959 | 15,969 | 15,912 |
| Average query latency (eBPF), ms | 0.564 | 0.560 | 0.581 | 0.583 | 0.583 | 0.591 |
| Queries completed within 5ms (eBPF), % | 99.97 | 99.96 | 99.96 | 99.96 | 99.95 | 99.94 |
| p99 transaction latency (sysbench, 20 queries), ms | 17.0 | 17.6 | 17.9 | 18.1 | 18.6 | 18.8 |
The latency slowly grows throughout the test, as tables and indexes bloat under a continuous stream of updates, but this drift does not depend on the instrumentation: there is no step when it is switched on or off, and each "on" phase is in line with the adjacent "off" phases.
Postgres resource usage

| Phase | 1 (off) | 2 (on) | 3 (off) | 4 (on) | 5 (off) | 6 (on) |
|---|---|---|---|---|---|---|
| Postgres CPU usage, cores | 3.08 | 3.21 | 3.09 | 3.07 | 3.20 | 3.07 |
The CPU usage of Postgres with the instrumentation enabled (3.11 cores on average) is the same as without it (3.12 cores). The two bumps on the chart (phases 2 and 5) are autoanalyze processing thousands of tables that reach the analyze threshold at about the same time. They occur regardless of the instrumentation.
The cost of the agent's queries is too small to be seen in the CPU usage, so we logged them on the server (log_min_duration_statement=0 for the monitoring role):
about 970 statements per minute with a total execution time of 6.6 seconds per minute, never more than one statement at a time.
| Queries | Frequency | Avg. time |
|---|---|---|
pg_stat_statements (5,000 entries) | every scrape | 13ms |
pg_stat_activity (500 connections), WAL, replication, checkpoints, settings, etc. | every scrape | ~20ms in total |
pg_database_size() for all databases | every minute | 408ms |
| Table and index bloat estimation | every minute, per database | 31ms |
| Table sizes, dead tuples and analyze statistics | every minute, per database | 12ms |
| Schema tracking (columns, indexes, constraints), autovacuum progress | every minute, per database | 17ms |
In other words, the per-database part takes about 60ms per database, or 6 seconds per minute for 100 databases, and accounts for most of the cost.
coroot-cluster-agent resource usage
| Phase | 1 (off) | 2 (on) | 3 (off) | 4 (on) | 5 (off) | 6 (on) |
|---|---|---|---|---|---|---|
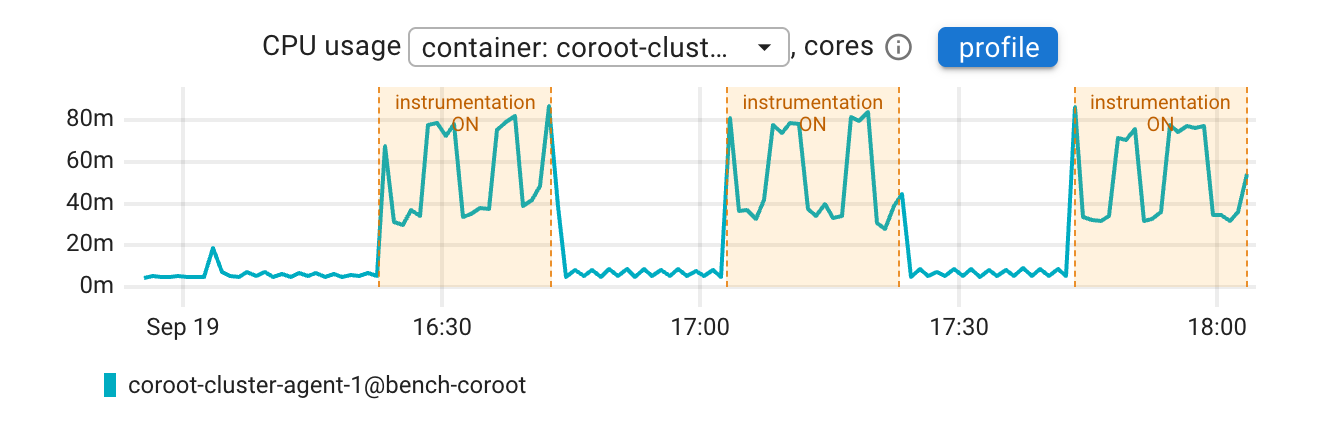
| CPU usage, cores | 0.005 | 0.055 | 0.006 | 0.054 | 0.006 | 0.052 |
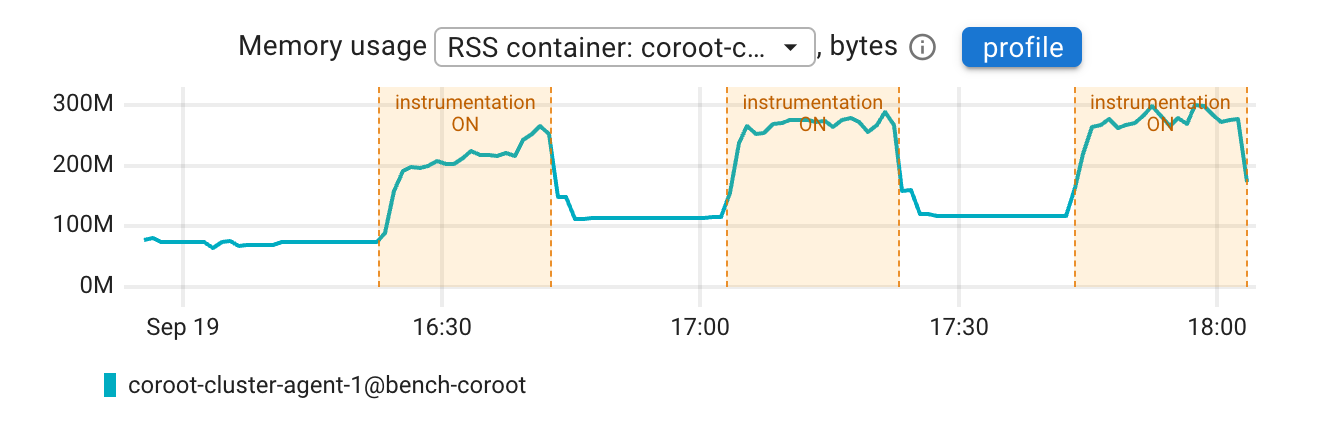
| Memory (RSS), average, MB | 72 | 218 | 114 | 269 | 118 | 278 |
| Memory (RSS), peak, MB | 75 | 265 | 117 | 288 | 123 | 308 |
Compared to the idle agent, monitoring this instance costs about 0.05 CPU cores and 150-190MB of memory. This is more than in the MySQL test because the agent reports bloat, size and vacuum statistics for the top tables of each of the 100 databases, which adds up to about 25,000 metric series.
Conclusion
On a Postgres server with 100 databases, 10,000 tables, 500 client connections and 16,000 queries per second:
- enabling the instrumentation has no measurable impact on the latency of application queries;
- the additional CPU usage of Postgres is below the measurement noise: the agent's queries take about 6.6 seconds of execution time per minute;
- coroot-cluster-agent consumes about 0.05 CPU cores and less than 310MB of memory.
The cost grows with the number of databases rather than with the query rate. If the defaults are too heavy for your environment, schema, size and bloat tracking can be limited or turned off, and the scrape interval can be increased. See what data is collected for the available options.
MongoDB instrumentation
For MongoDB, coroot-cluster-agent collects most of the metrics from in-memory counters (serverStatus, replSetGetStatus, $currentOp), which is cheap.
The only expensive statistics are collection storage stats ($collStats): they cost MongoDB a few milliseconds per collection, no matter how small the collection is.
Since Coroot only needs the largest and the fastest-growing collections, the agent doesn't walk all of them. On each round it looks at
the collections with the most writes (according to the top command) and the collections of the largest databases, up to 500 collections in total.
Index definitions of all collections are fetched with a single $listCatalog aggregation.
We tested this on a server with 10,000 collections, using the same method as in the benchmarks above.
Lab
- MongoDB 8.0 (a single-node replica set) on a dedicated virtual machine (8 vCPU, 32GB RAM, NVMe SSD): 100 databases with 100 collections each,
every collection has a secondary index (10,000 collections, 30,000 WiredTiger files, 100M documents, 37GB on disk), a 10GB WiredTiger cache,
and the profiler configured as recommended (
slowOp, 200ms). - Load: a load generator modeled after the
oltp_read_writescenario ofsysbench. Each event consists of 18 operations on a random collection: 10 point reads, 4 range reads, 2 updates, a delete and an insert. 100 clients (one per database) on two other machines hold 500 connections and execute a fixed 400 events / 7,200 operations per second. 20% of the documents are "hot", so the working set fits into the cache. - coroot-cluster-agent on a separate machine, with the default settings: a 15-second scrape interval, and collection size and index change tracking enabled. The monitoring user has the recommended permissions, including the optional role for index change tracking.
- coroot-node-agent on every machine as the measuring tool: query latency is captured by eBPF on the client side,
and the CPU and memory usage of
mongodand the agent come from container metrics.
The test runs four 15-minute phases under the same load, with the instrumentation alternately disabled and enabled.
Test Results
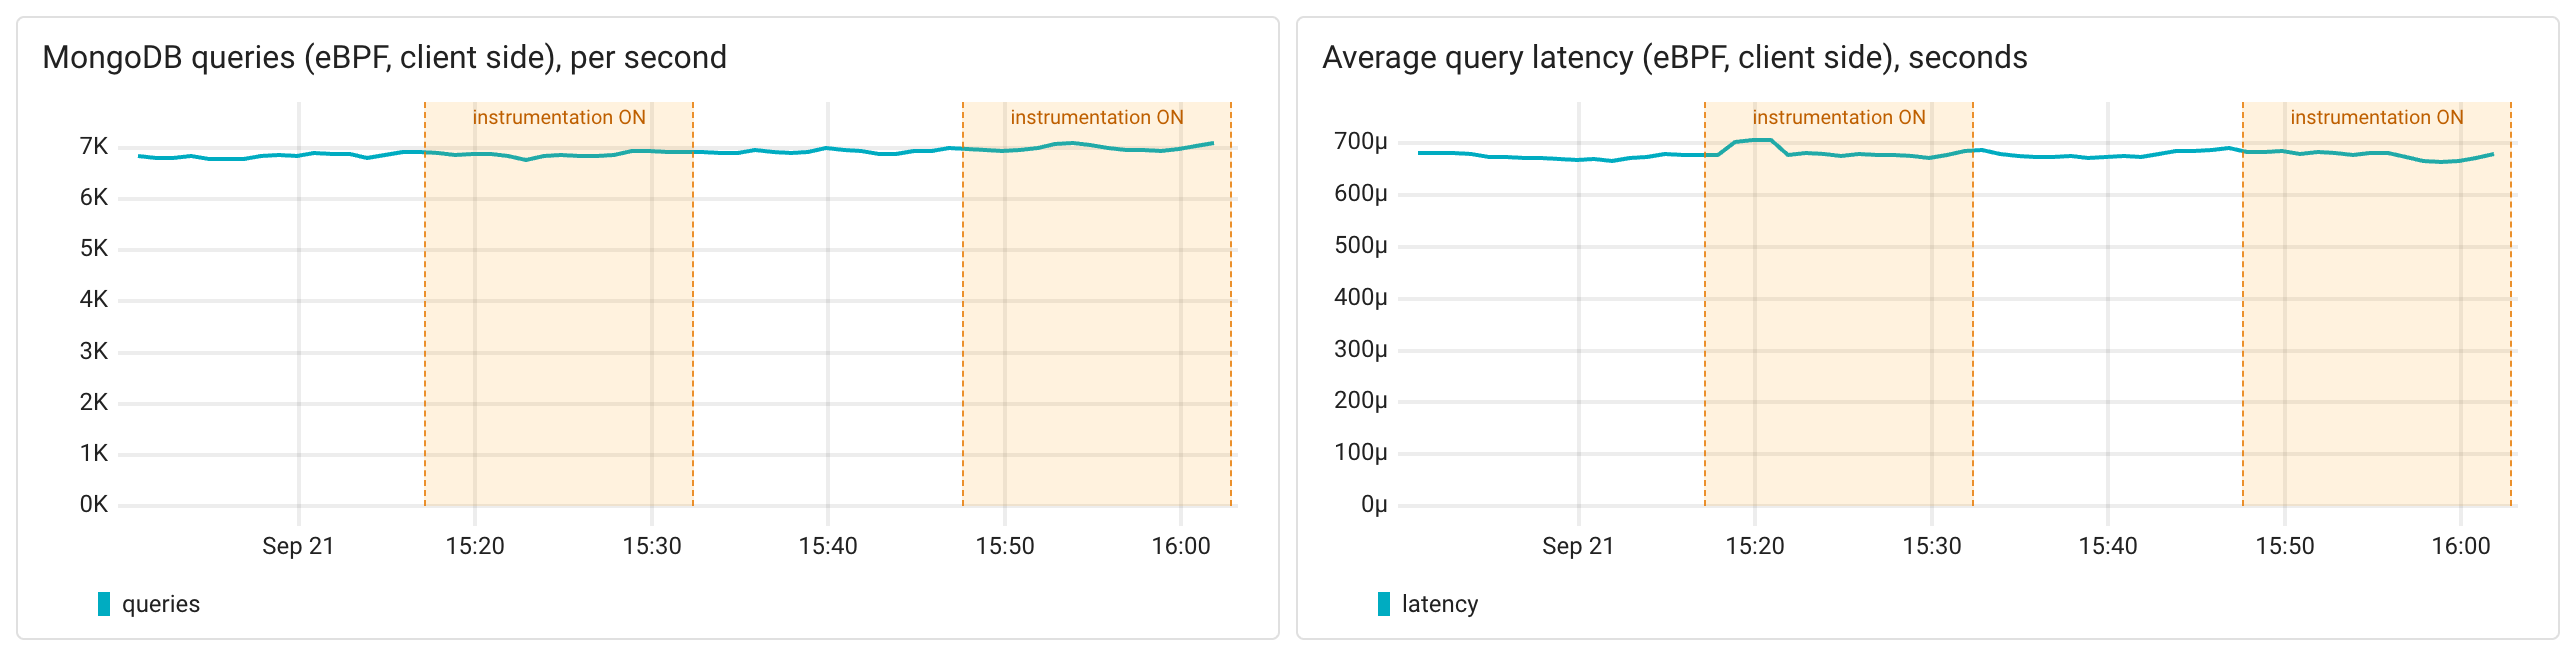
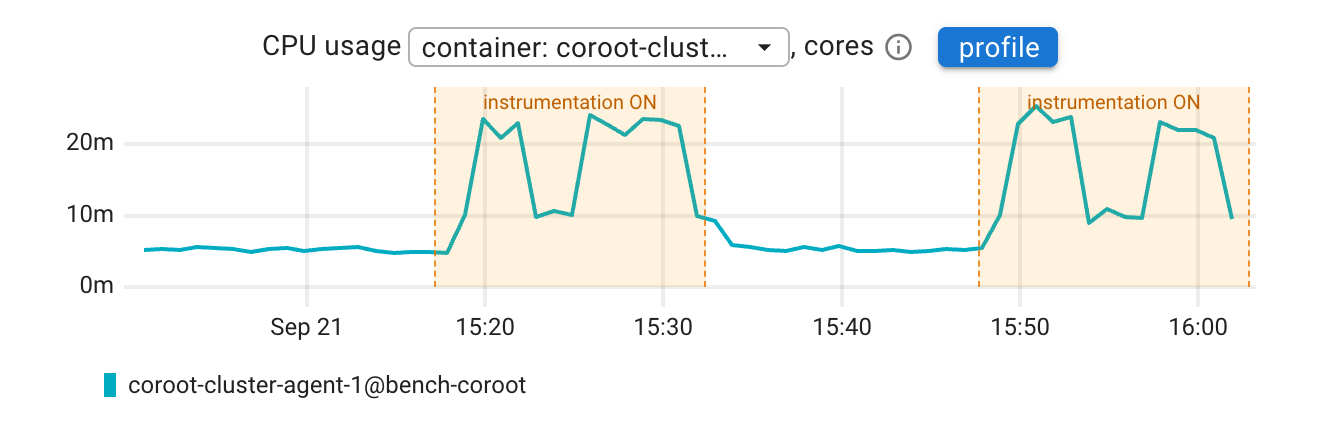
In the charts below, the shaded areas are the phases with the instrumentation enabled.
Client-side latency
| Phase | 1 (off) | 2 (on) | 3 (off) | 4 (on) |
|---|---|---|---|---|
| Operations per second (eBPF) | 6,867 | 6,874 | 6,942 | 7,027 |
| Average operation latency (eBPF), ms | 0.673 | 0.680 | 0.681 | 0.676 |
| Operations completed within 5ms (eBPF), % | 99.90 | 99.88 | 99.90 | 99.89 |
| p99 event latency (18 operations), ms | 26.3 | 27.4 | 26.8 | 26.7 |
The latency with the instrumentation enabled is the same as the baseline, both on average and at the 99th percentile, and no operations failed.
MongoDB resource usage

| Phase | 1 (off) | 2 (on) | 3 (off) | 4 (on) |
|---|---|---|---|---|
| mongod CPU usage, cores | 2.41 | 2.37 | 2.40 | 2.39 |
| mongod memory (RSS), GB | 15.1 | 15.2 | 15.2 | 15.3 |
The CPU usage of mongod with the instrumentation enabled is within the measurement noise of the baseline. Memory usage slowly grows during the test regardless of the instrumentation.
All commands are executed sequentially over a single connection:
| Command | Frequency | Avg. time |
|---|---|---|
serverStatus | every scrape | 11ms |
$currentOp (750 connections and sessions) | every scrape | 18ms |
profiler level and new system.profile entries | every scrape, per database | < 1ms |
listDatabases (with sizes) | every minute | 0.5 - 0.9s |
top | every minute | < 50ms |
$listCatalog (index definitions of all collections) | every minute | < 100ms |
$collStats (only the size fields are requested) | every minute, for at most 500 collections | 3ms |
Collection tracking adds up to a few hundred commands per minute (about 350 in this test) regardless of the number of collections. Walking all 10,000 collections would take 20,000 commands and more than 30 seconds of execution time every minute.
coroot-cluster-agent resource usage
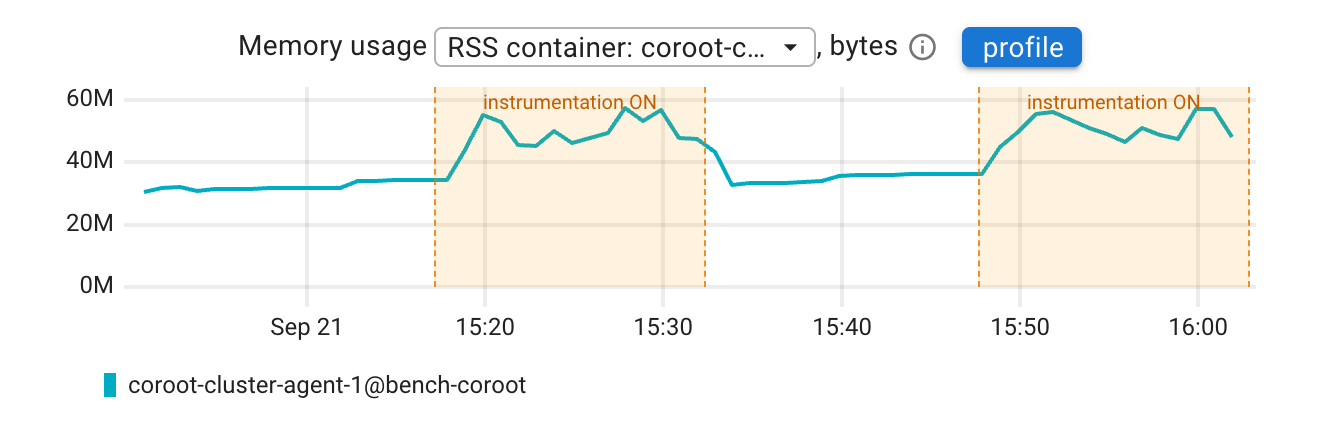
| Phase | 1 (off) | 2 (on) | 3 (off) | 4 (on) |
|---|---|---|---|---|
| CPU usage, cores | 0.005 | 0.015 | 0.005 | 0.015 |
| Memory (RSS), average, MB | 33 | 50 | 35 | 51 |
| Memory (RSS), peak, MB | 34 | 60 | 36 | 60 |
Compared to the idle agent, monitoring this instance costs about 0.01 CPU cores and 15-25MB of memory, and the agent receives about 1 Mbit/s from MongoDB.
Conclusion
On a MongoDB server with 100 databases, 10,000 collections, 500 client connections and 7,200 operations per second:
- enabling the instrumentation has no measurable impact on the latency of application queries;
- the additional CPU usage of
mongodis below the measurement noise, with no additional memory usage; - coroot-cluster-agent consumes about 0.015 CPU cores and less than 60MB of memory.
Note that this benchmark doesn't cover the cost of the MongoDB profiler itself: it was enabled during all phases, as writing profile entries
is performed by mongod regardless of whether anything reads them. See Prerequisites for how to keep it low.