Overview
Coroot is an opinionated observability solution out of the box. This means it comes with a wide range of predefined inspections and dashboards that help you quickly identify and troubleshoot common issues without any manual configuration.
However, every environment is unique, and sometimes you need to go beyond the built-in views. That's where custom dashboards come in. Coroot allows you to create your own dashboards to visualize any metrics that matter to you, turning Coroot into a true single pane of glass for all your observability needs.
Whether you're tracking business KPIs, third-party metrics, or application-specific performance indicators, custom dashboards help you extend Coroot's built-in capabilities.
To learn how to gather custom metrics in Coroot, follow this guide.
This page will walk you through how to create a new dashboard, add and organize panels, and build effective dashboards tailored to your environment.
Let's get started.
Create a dashboard
- Navigate to Dashboards and click Add dashboard.
- Provide a name for your dashboard and, optionally, a description.
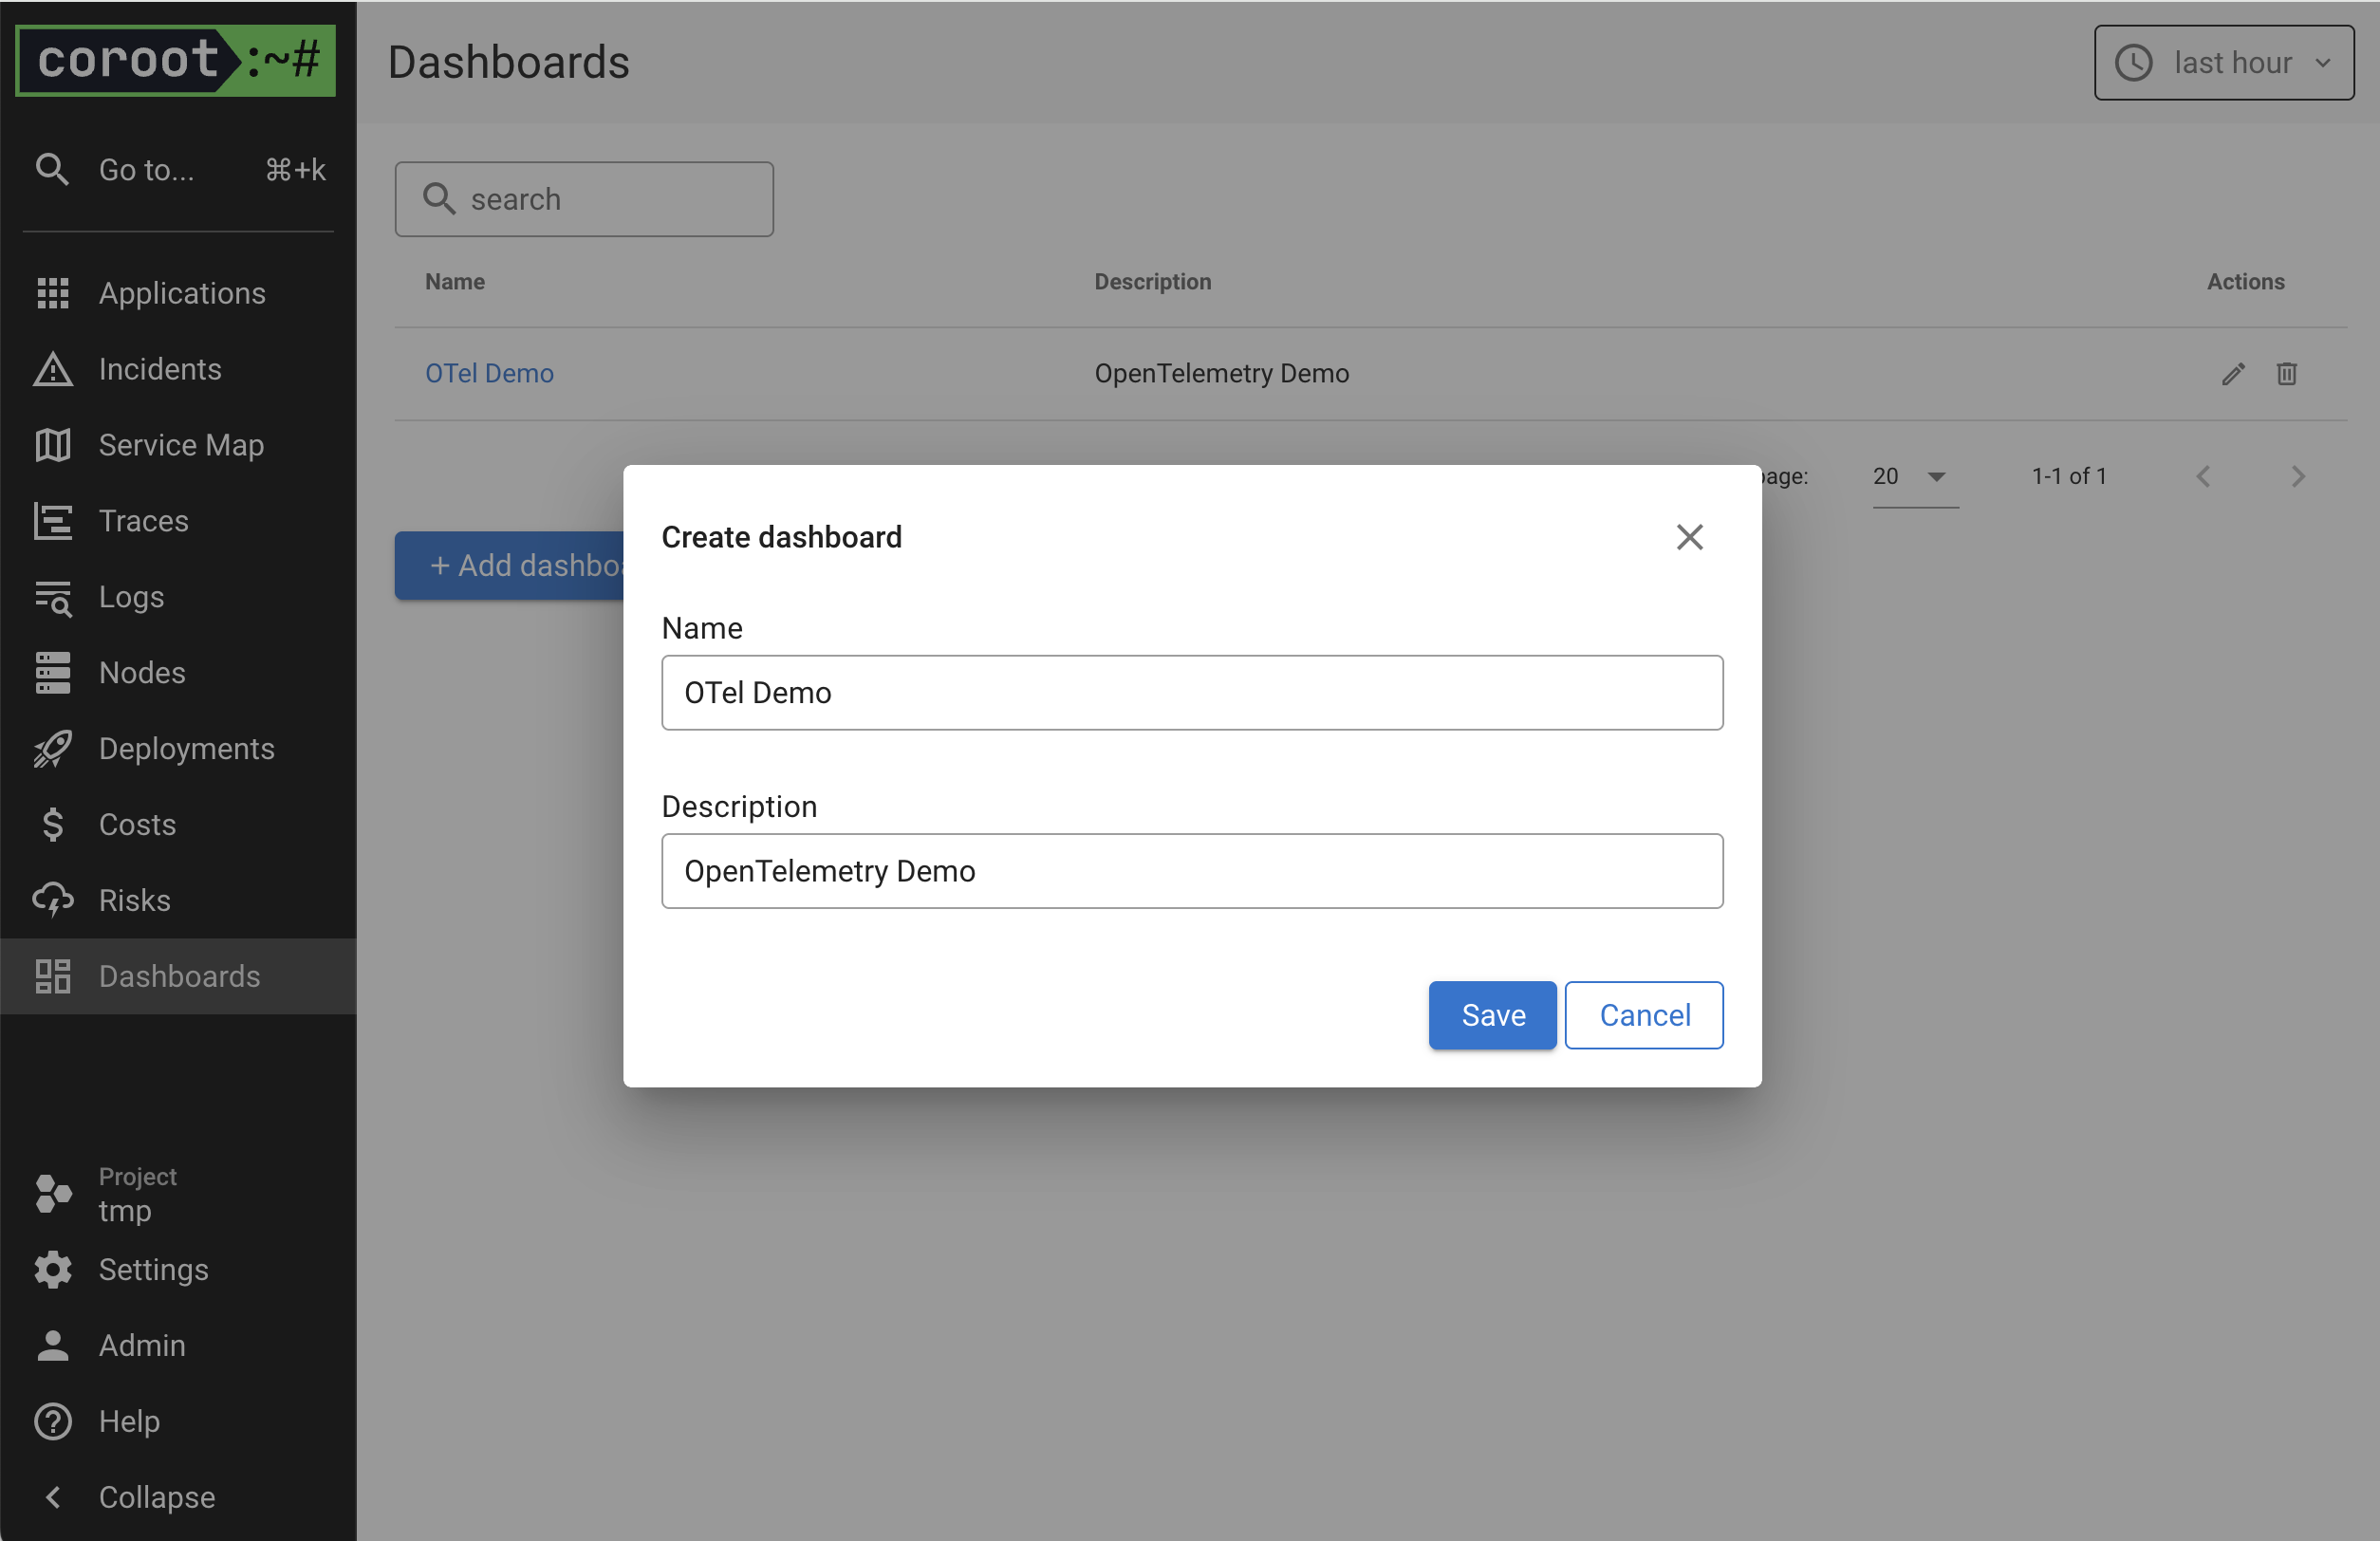
- Click Save.
Add a panel
Currently, only the Time series chart panel type is supported.
- Click Add panel.
- Enter a Name and optionally a Description.
- Choose or create a panel Group.
- Enter a PromQL expression in the Query #1 field.
- Optionally, provide a Legend for the query. You can reference label values using the format
{{ label_name }}.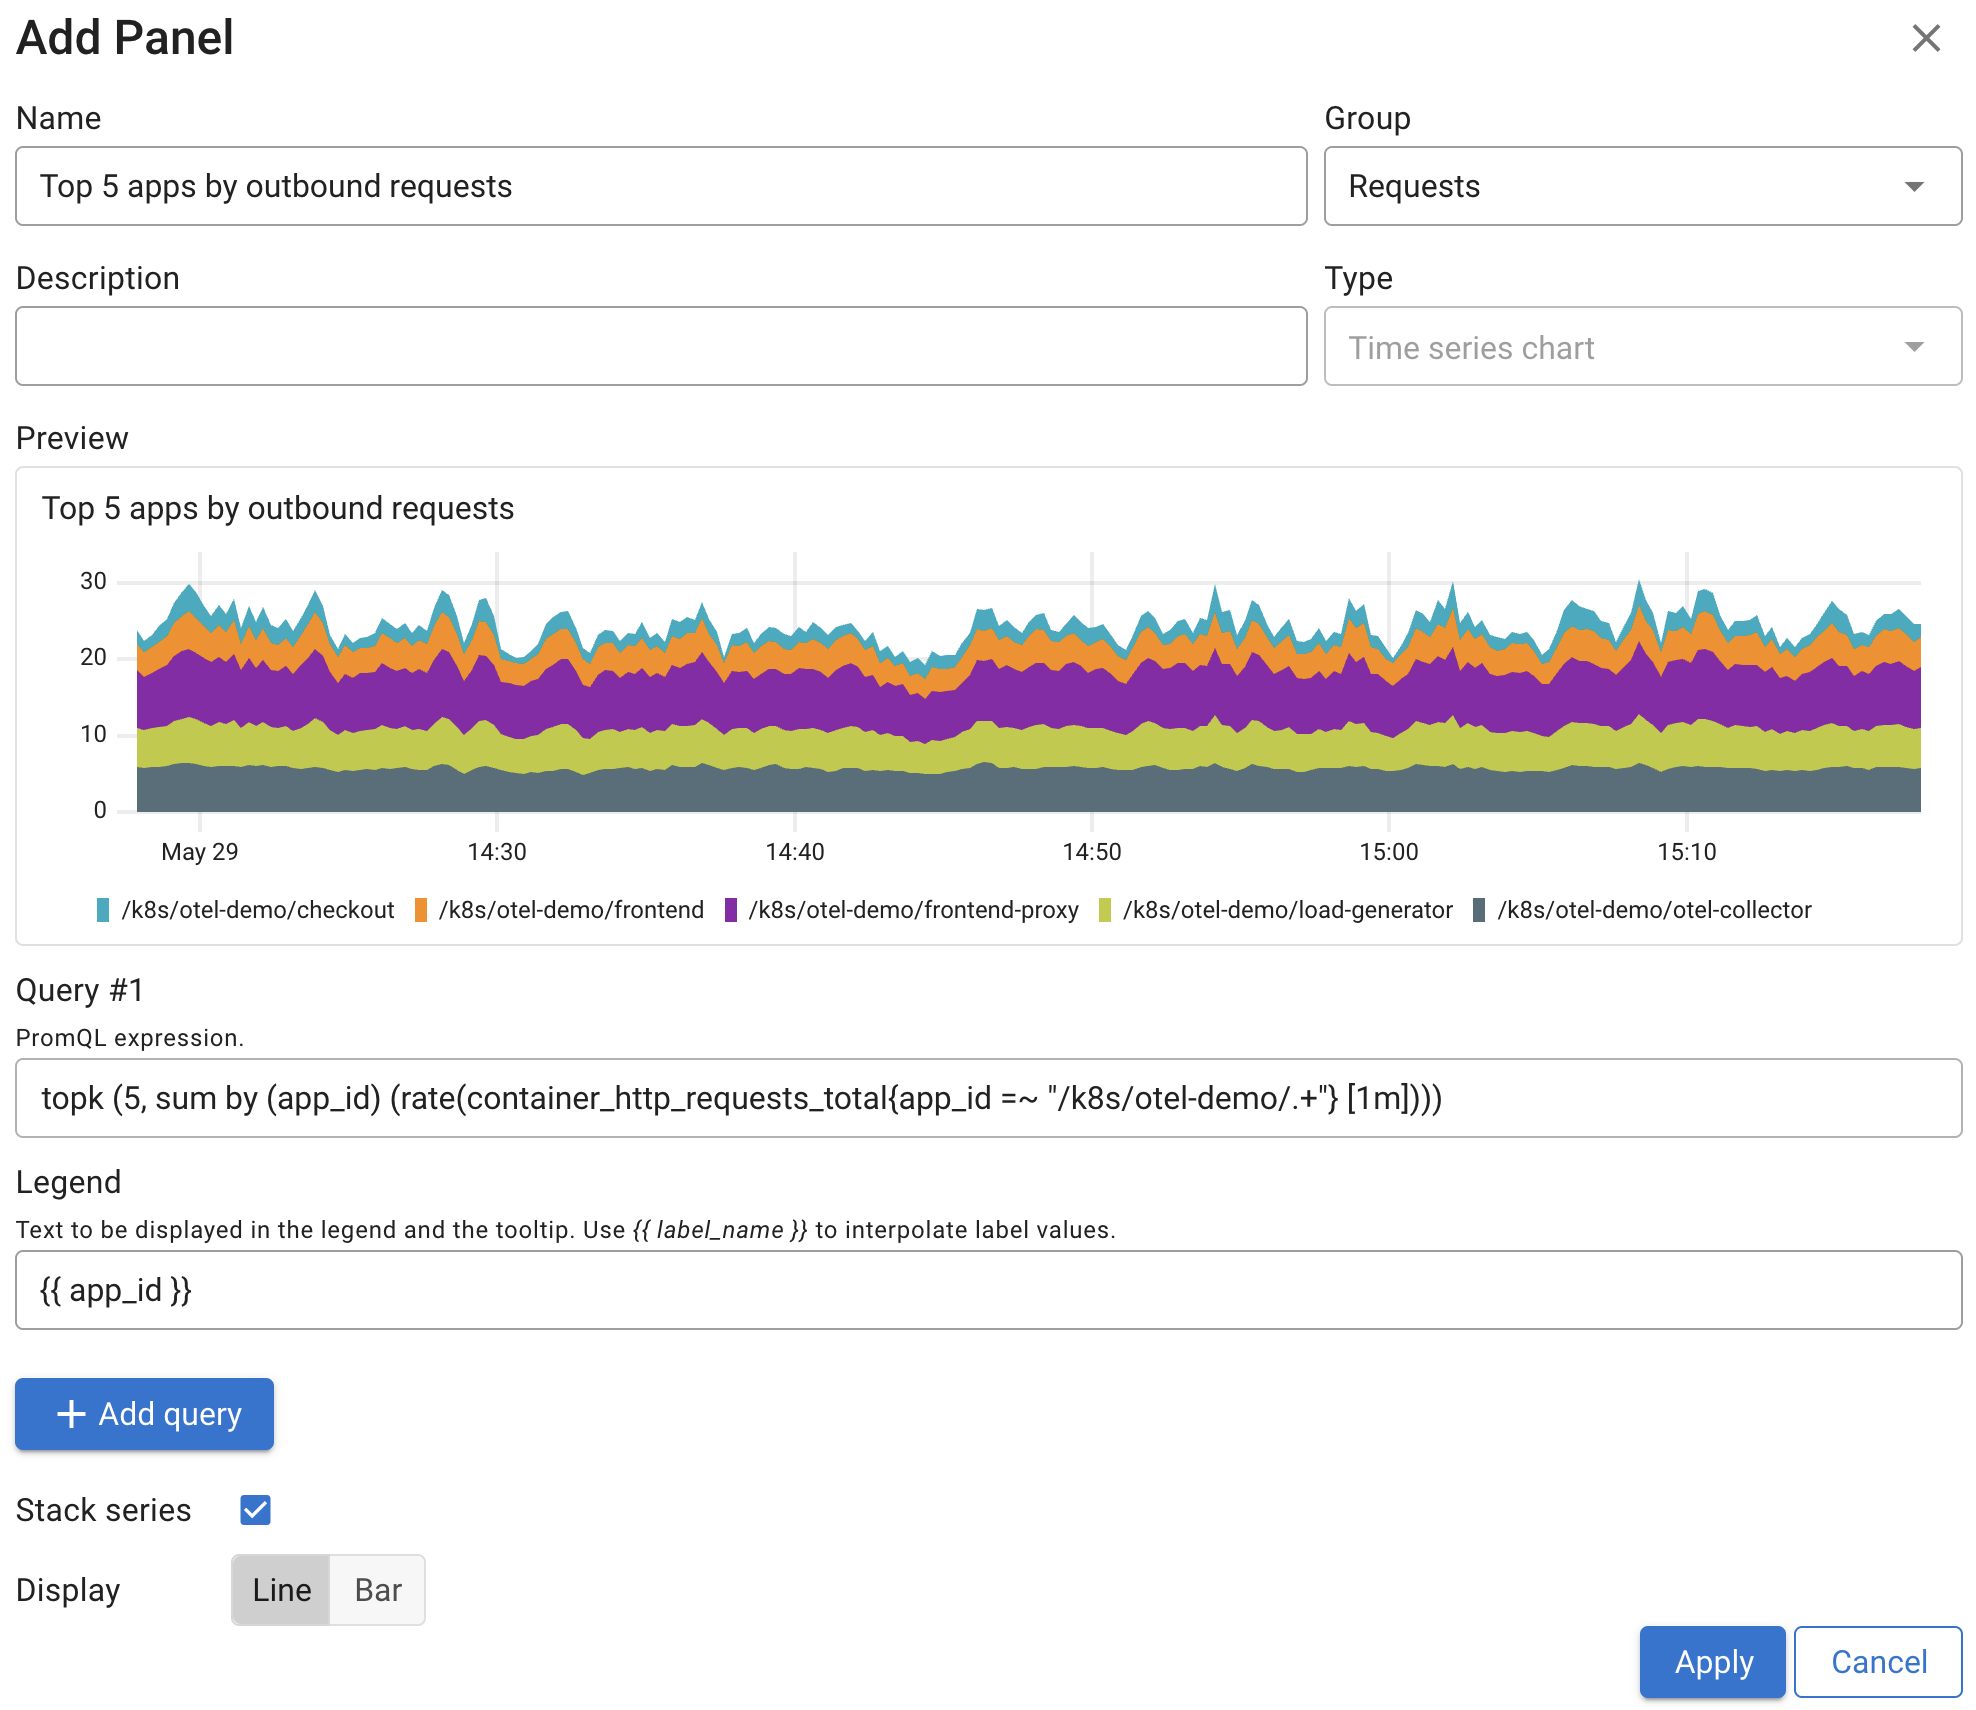
- You can add additional PromQL queries if needed.
- Click Apply.
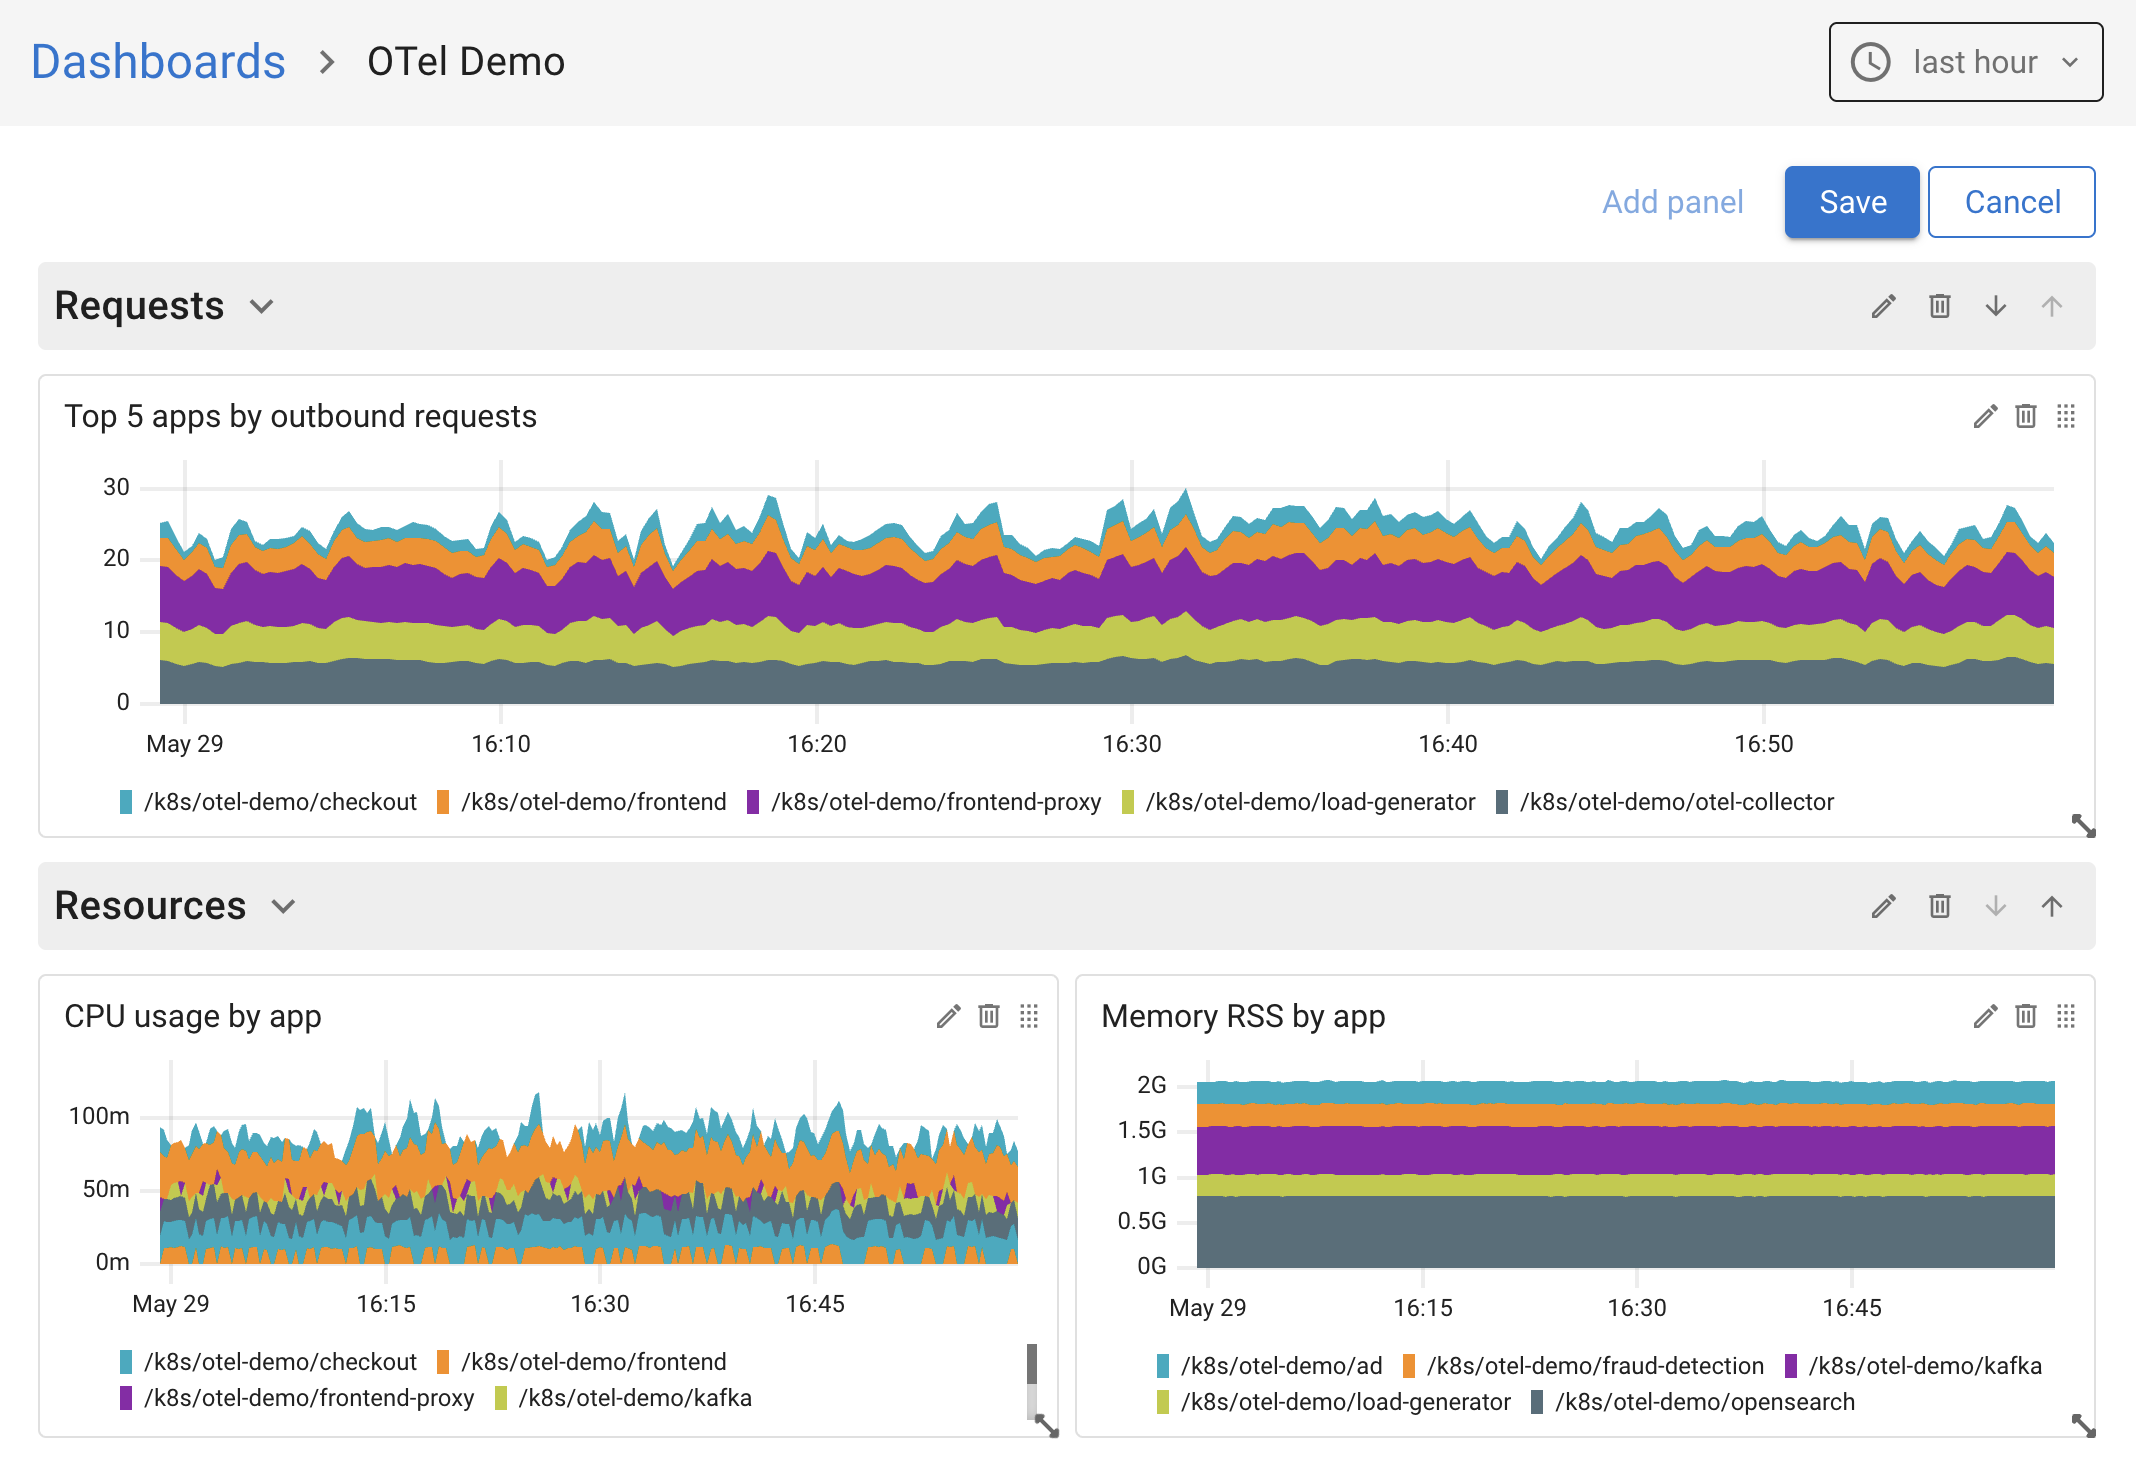
- Adjust the panel’s size by dragging its bottom-right corner, and move it by dragging the top-right corner.

- Click Save to save the dashboard.
Panel groups
Panel groups let you organize related panels under a shared title. They make it easier to keep things tidy and focus on specific parts of your system, such as resource usage, database metrics, or custom business indicators.
You can collapse groups by default to reduce visual clutter, which is especially useful in larger dashboards.
Groups are easy to reorder with ↑ and ↓ buttons, and you can move panels between them whenever needed to keep everything organized.
Dashboard Permissions
Dashboards in Coroot follow role-based access control (RBAC). In the Community edition, only Admins and Editors can create or edit dashboards. Viewers can access all dashboards in read-only mode.
The Enterprise edition offers more control with fine-grained permissions. You can define who can view or edit specific dashboards, making it easy to manage access across teams and environments.