Overview
AI-powered Root Cause Analysis is available in Coroot Enterprise (from $1 per CPU core/month) or through Coroot Cloud integration for Community Edition users.
Enterprise users: Start your free trial today.
Community Edition users: Enable AI features by connecting to Coroot Cloud with 10 free investigations per month.
Coroot’s AI-powered Root Cause Analysis helps teams quickly understand and fix incidents.
It summarizes complex telemetry data, like metrics, logs, traces, and profiles, into clear and actionable insights. Using Large Language Models (LLMs), Coroot automatically analyzes system behavior and explains what likely caused performance issues or outages.
For example, we detected an anomaly in the service SLIs, such as latency spikes and some errors. You can select the anomaly and ask Coroot to explain what caused it.
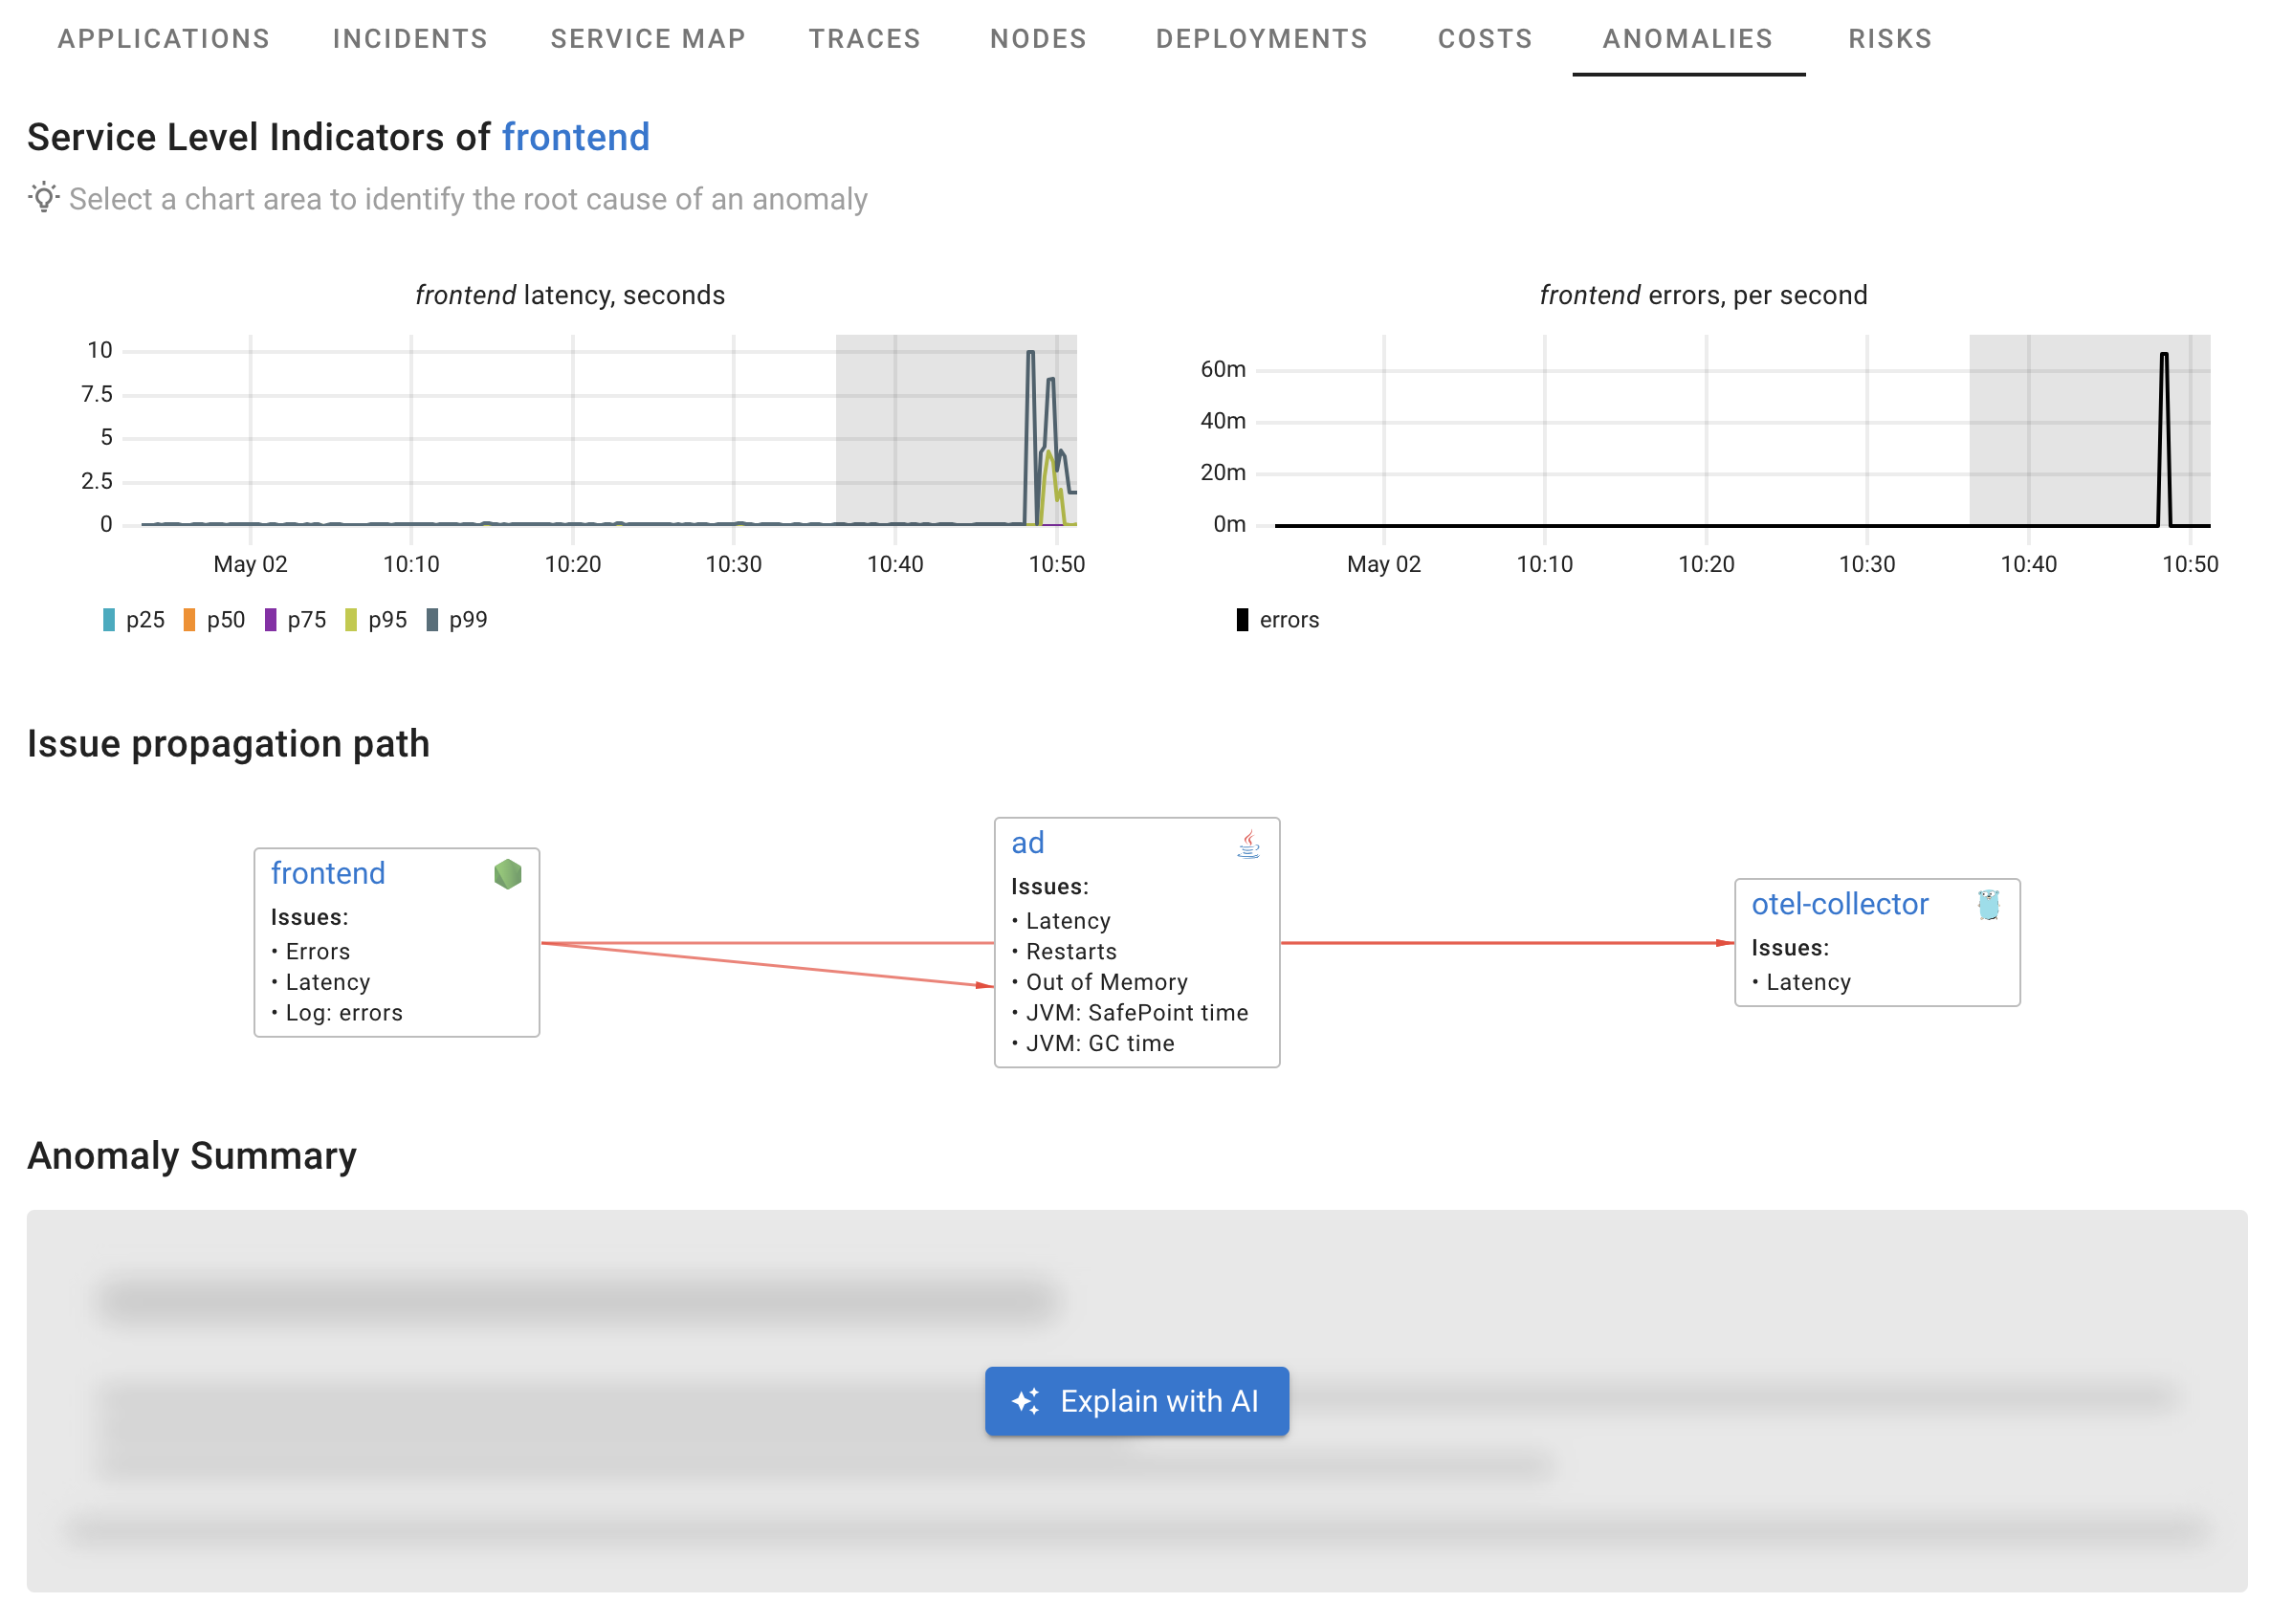
First, Coroot follows the dependency graph from the affected service. It works like an engineer, checking possible causes by comparing telemetry data with the anomaly. This step uses various ML (Machine Learning) algorithms and doesn’t involve LLMs.
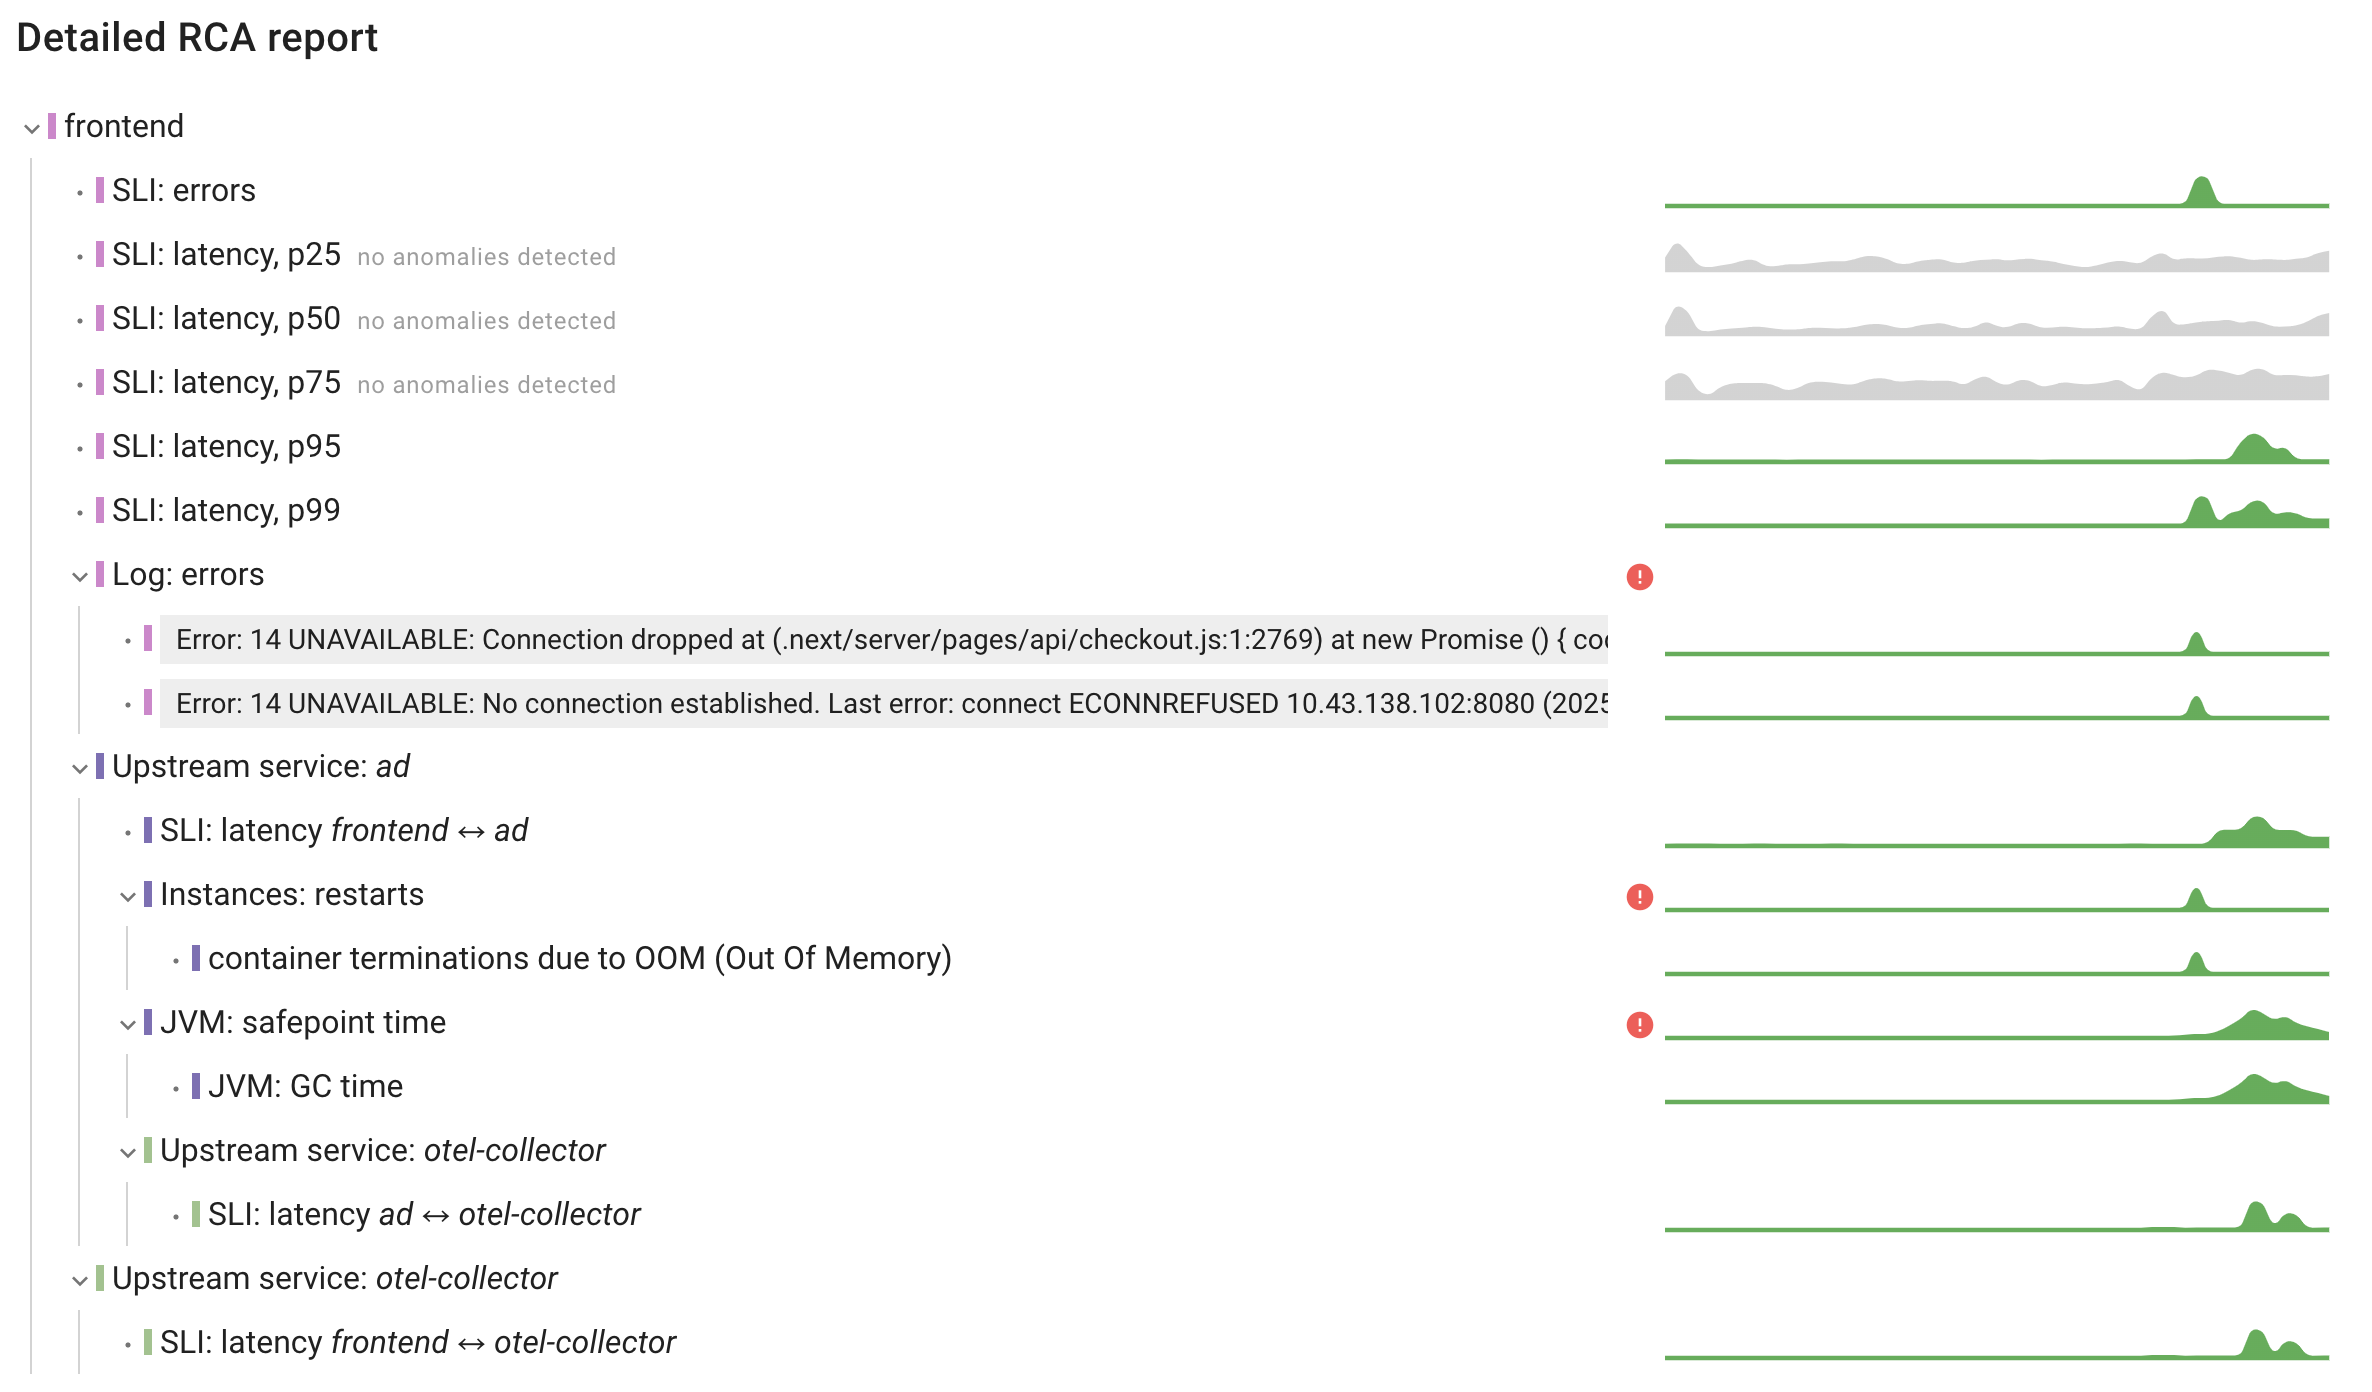
As a result, Coroot identifies the most likely root causes, relevant logs, and key signals that support each hypothesis.
However, the output can still be quite detailed and may require some analysis. Without full context, it can be hard to interpret. In many cases, even experienced engineers look for solutions in documentation or community forums.
This is where the LLM helps. Using the rich context collected by Coroot, it summarizes the findings and suggests possible fixes or next steps.
When you click the "Explain with AI" button, Coroot sends only its findings to the selected model, not all the raw telemetry data. This way, we avoid relying on LLMs for the actual root cause analysis, where they are not very effective. Instead, we use them for what they do best: explaining complex issues and summarizing results.
Here’s the summary for this incident:
Anomaly summary
The frontend service is experiencing significant performance degradation with latency spikes reaching up to 4.28s (p95) and 10s (p99), along with failed requests occurring at a rate of up to 0.067 per second.
Issue propagation paths
The issue appears to follow these paths:
- frontend → ad (high latency correlation)
- ad → otel-collector (increased latency)
- frontend → otel-collector (direct dependency also affected)
Key findings and Root Cause Analysis
The root cause appears to be in the ad service (Java application):
- Instances of ad service have been terminated by the OOM killer, indicating memory exhaustion
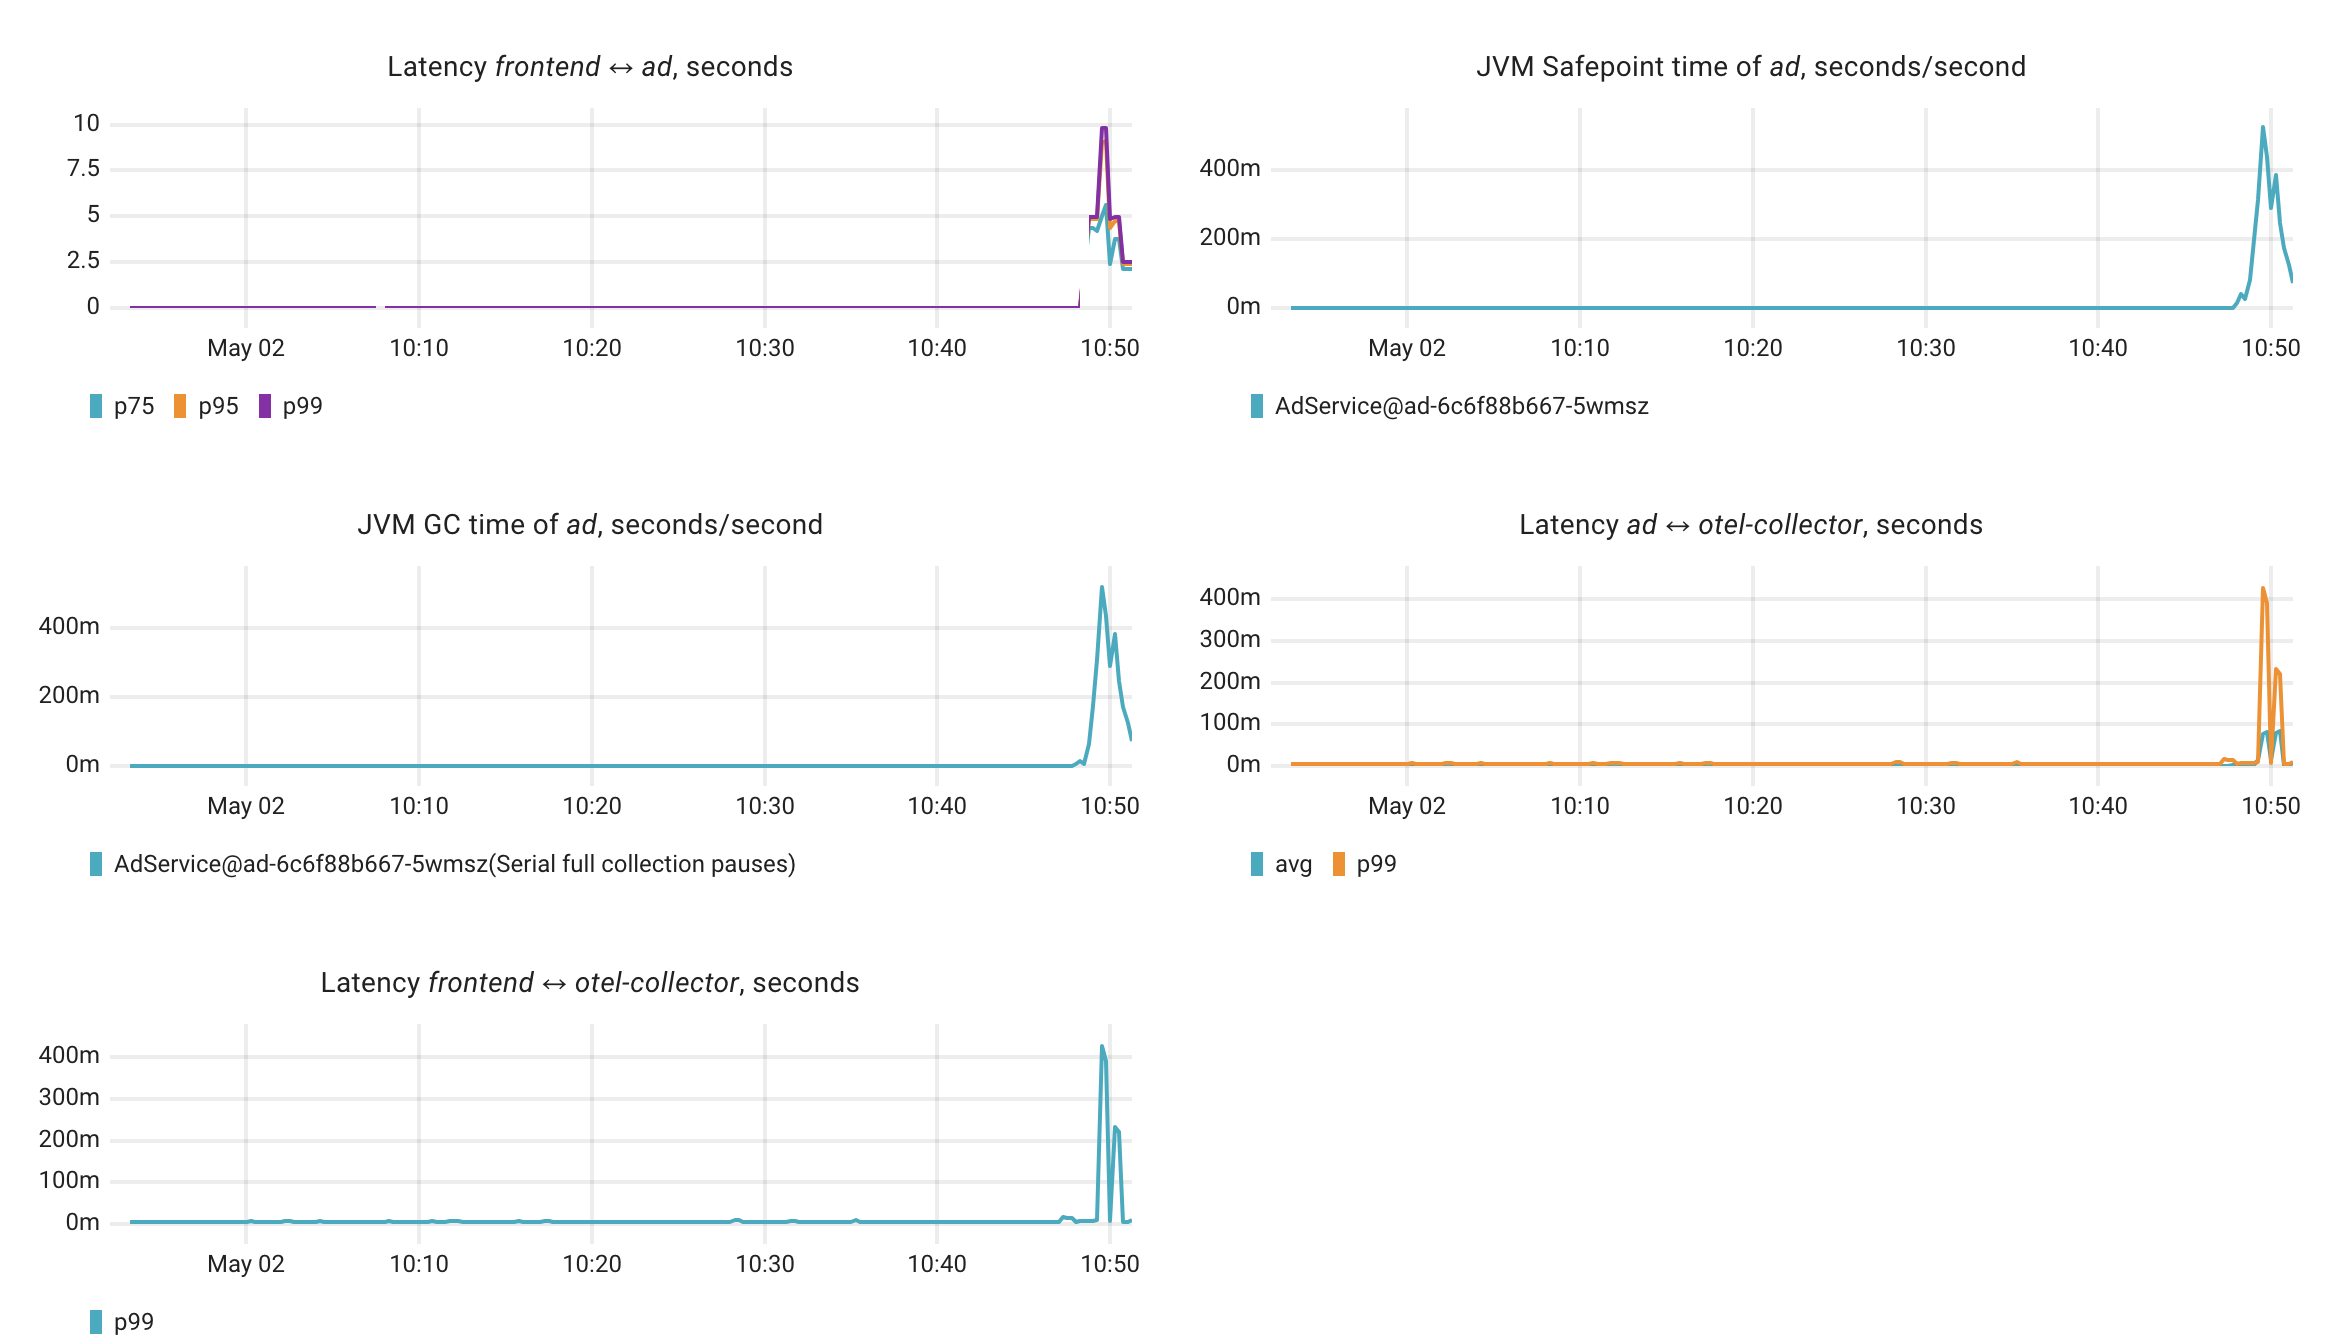
- Before termination, the service experienced high JVM Safepoint time (up to 0.52s per second)
- Serial full collection GC pauses reached 0.52s per second, strongly correlating with the frontend latency issues
- The ad service's communication with otel-collector also shows increased latency (up to 427.5ms at p99)
This suggests the ad service is experiencing severe memory pressure, leading to excessive garbage collection, which is blocking request processing and eventually causing OOM crashes.
Remediation
To resolve this issue:
- Increase the heap memory allocation for the ad service to prevent OOM situations
- Consider tuning the JVM garbage collection settings to reduce full GC pauses:
- Switch from Serial GC to G1GC or ZGC for better pause time management
- Adjust heap size ratios (young/old generation)
- Investigate potential memory leaks in the ad service code
- Review the interaction between ad service and otel-collector to optimize telemetry data transmission
- Consider implementing circuit breakers in frontend to gracefully handle ad service failures
Relevant charts
Coroot’s AI-powered Root Cause Analysis makes it easier to understand and fix issues by combining smart diagnostics with clear AI explanations.
In the next section, we’ll cover how to configure Coroot to work with different AI model providers like OpenAI and Anthropic.